
TradingEdge: Stocks keep soaring despite poor fundamentals

This is a recap of the most notable research published during the week. We entered the beginning of earnings season with a lot of anxiety about the initial reports, but investors have shrugged off some devastating corporate earnings and economic data. If there is a piece of research that hadn't been published by Friday, you'll see a [NEW] tag.
Earnings expectations
Financial media is ablaze with the idea that this week is going to be an important one for investors. We'll be getting our first real glimpse at corporate earnings and how the pandemic has altered the corporate landscape.
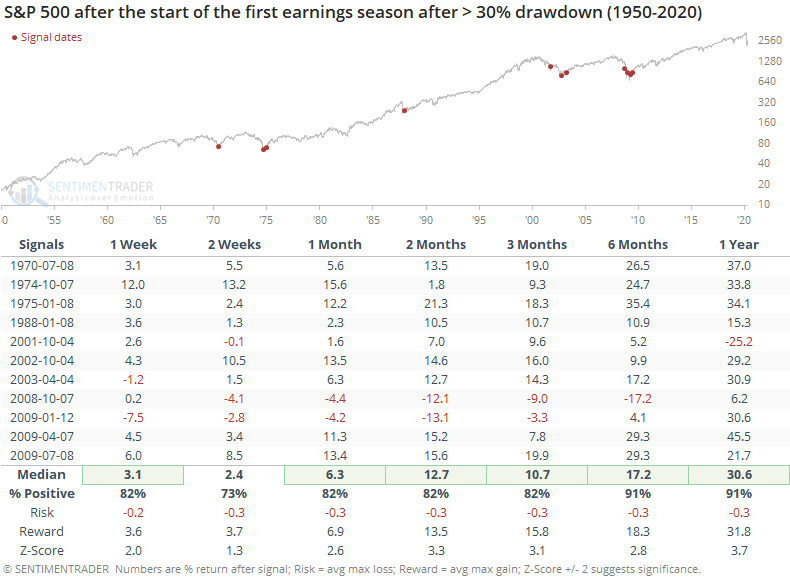
Because stocks had just suffered massive losses, investors had already baked much of the worst of the coincident recessions and bear markets. Surely, the earnings reports were about to be terrible, but investors already knew that and were trying to look around the corner about what the prospects were once the economy recovered.
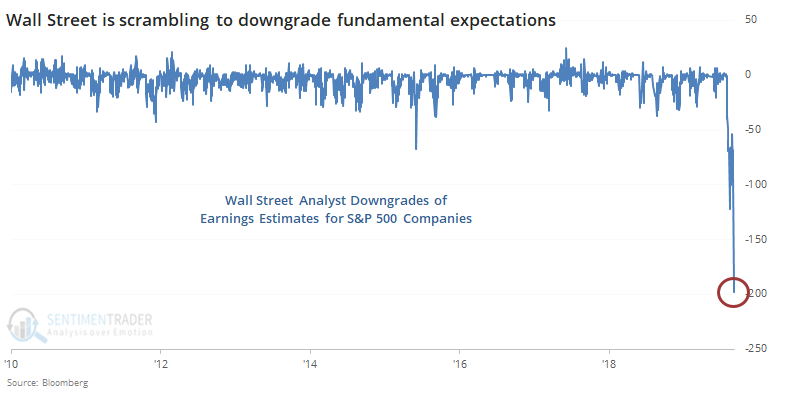
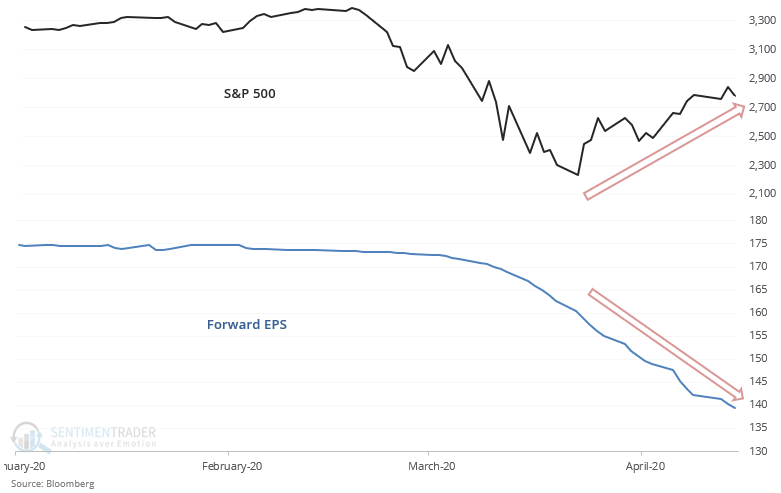
The lowered expectations can be seen in the steady drop in earnings expectations. With rising stocks and falling expectations, it seems like investors are showing irrational optimism, but the only other time it happened to this degree was March 2009 as stocks were bottoming (from a much lower level, though).
The two primary reasons to be optimistic about the past couple of weeks are that we've had a historic surge of buying pressure (here and here) and the major indexes have retraced a substantial portion of the February-March decline. When either of those conditions triggered, it was rare to see much, if any, loss going forward, especially over the next 6-12 months.
And yet stocks continued to surge
There was a 3-week "everything rally" that included markets across the world.
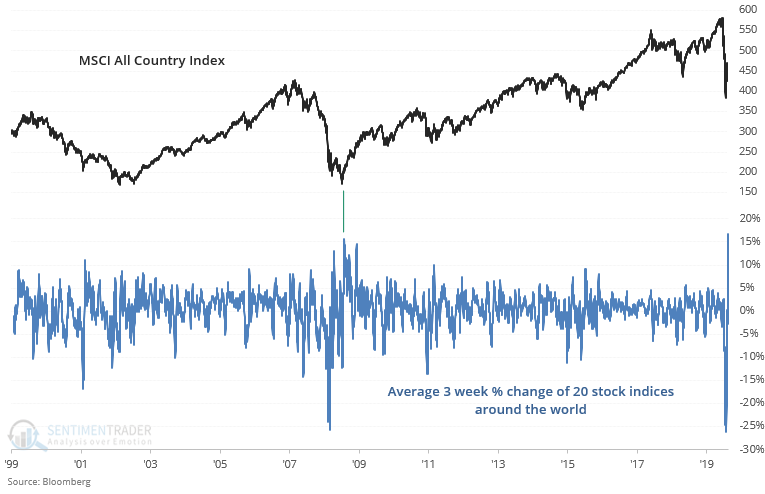
And across assets, too.
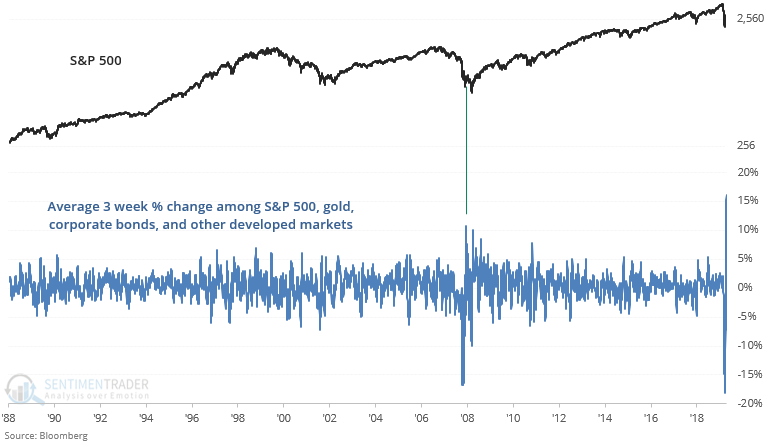
The only real comparison was somewhere along the timeline from October 2008 - March 2009. We seem to be further along that timeline now, with compelling signs of broad recoveries in stocks.
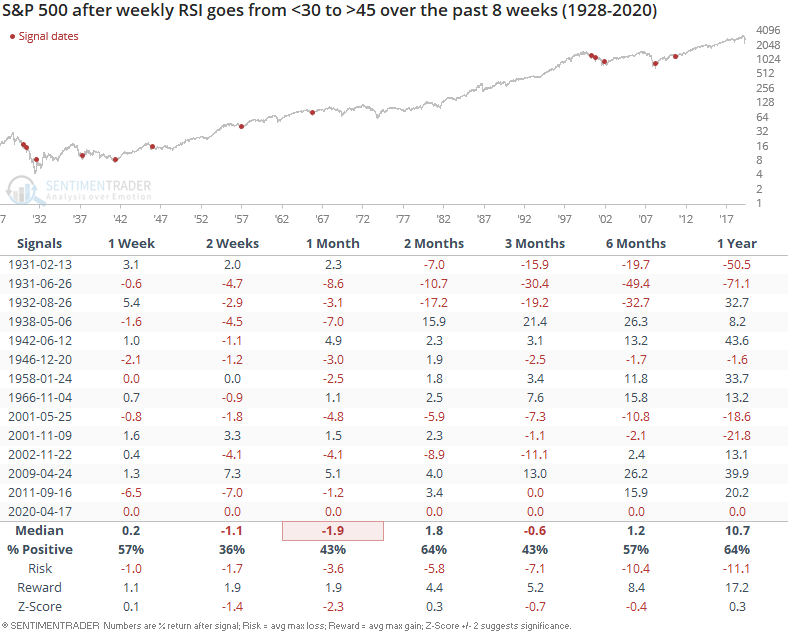
[NEW] Global equities were extremely oversold in late-March, regardless of how you looked at it. Troy notes that the S&P 500's 14-week RSI fell to among the lowest readings ever, and now it's snapping back. When the S&P's weekly momentum went from oversold to normal (>45), the S&P often struggled over the next 2-4 weeks. Once again, many post-crash rallies are followed by some form of a pullback:
Using a relatively obscure charting method, an extremely high number of stocks have reversed higher in recent weeks. Again, that led to some choppiness shorter-term, but the few times it happened on this scale all came after major lows.
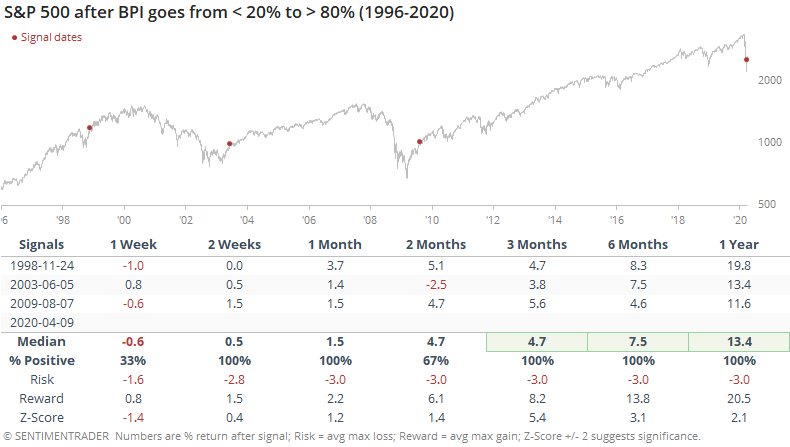
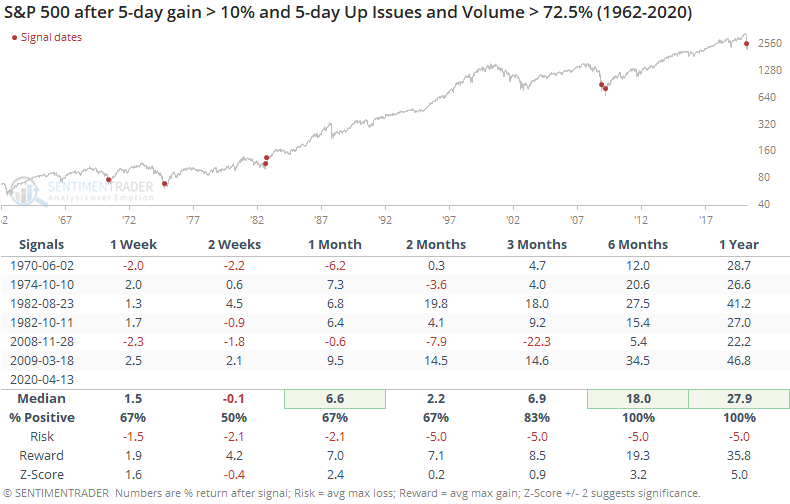
And even though we've technically missed a couple of "official" breadth thrusts, there is no denying that buying interest has been tremendous, and it has never led to a decline over the next year.
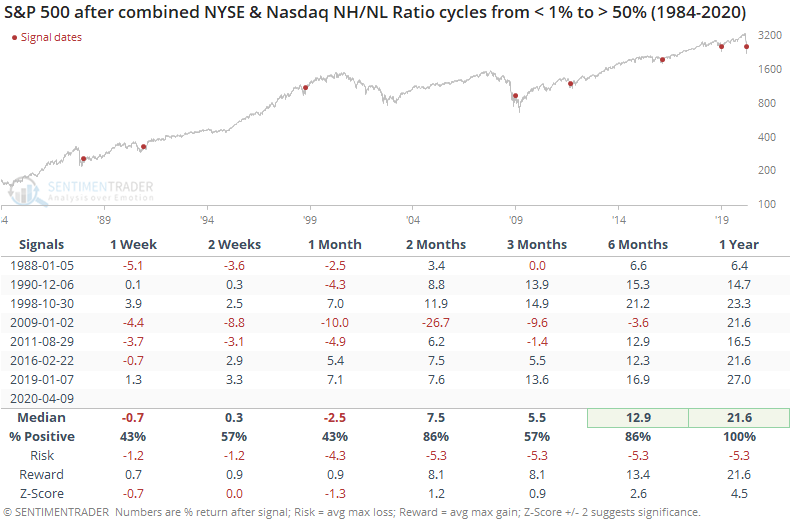
It has also led to a recovery in the New High / New Low Ratio for the NYSE and Nasdaq, but those need to be watched in case they slip persistently back below 50%.
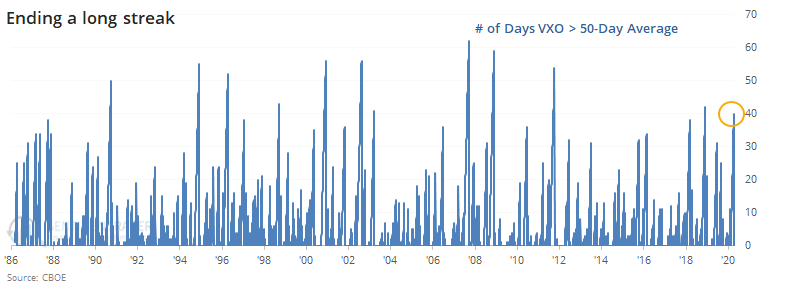
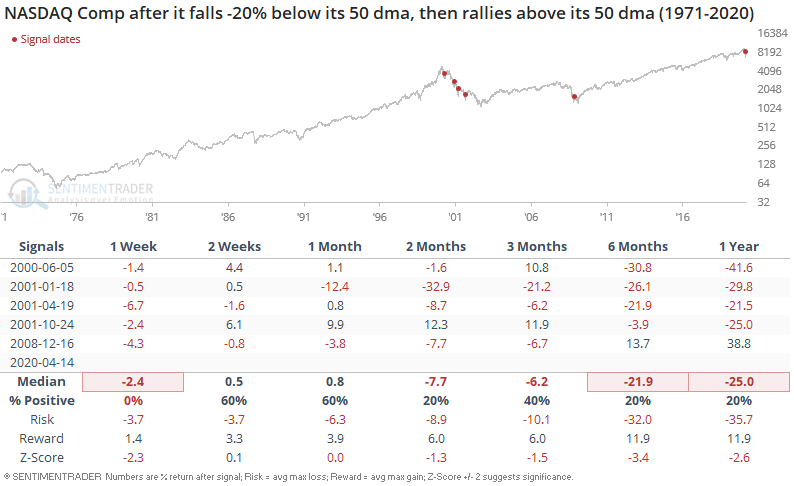
[NEW] As part of the recovery, Troy notes that the S&P 500 has finally crossed above its 50-day average after a historic market plunge. And while some stocks have done very well (e.g. Amazon, other tech stocks), a relatively small % of stocks are fully participating in the rally. To be exact, only 39% of S&P 500 members are above their 50-day moving averages:
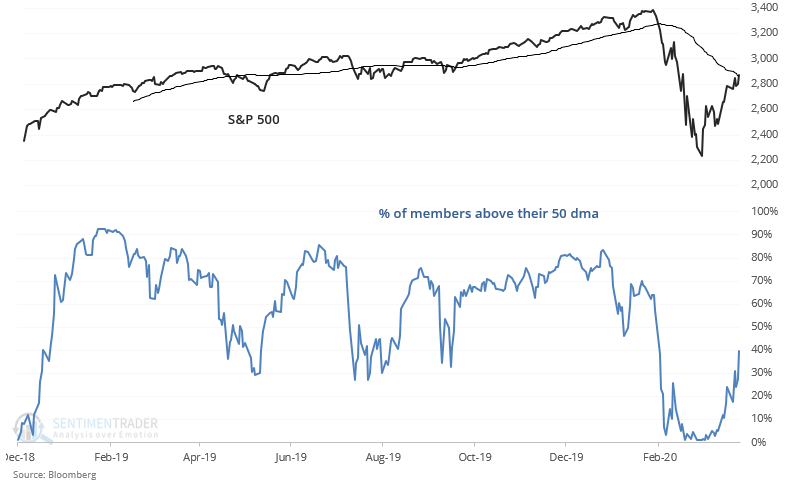
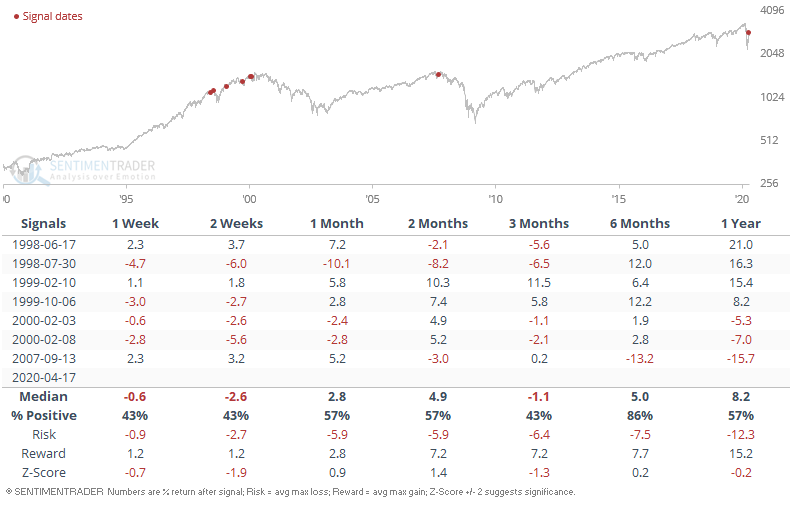
When the S&P 500 crossed above its 50-day average while fewer than 40% of its members did so, the S&P usually pulled back over the next few weeks:
Resetting the cycle
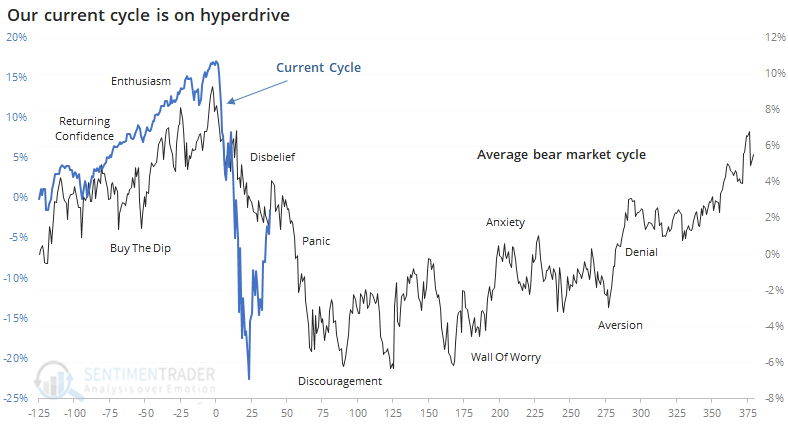
Price action alone would suggest we're in the post-panic "discouragement" part of the decline, but these kinds of thrusts are what we usually see near the latter part of the trough of a typical Sentiment Cycle.
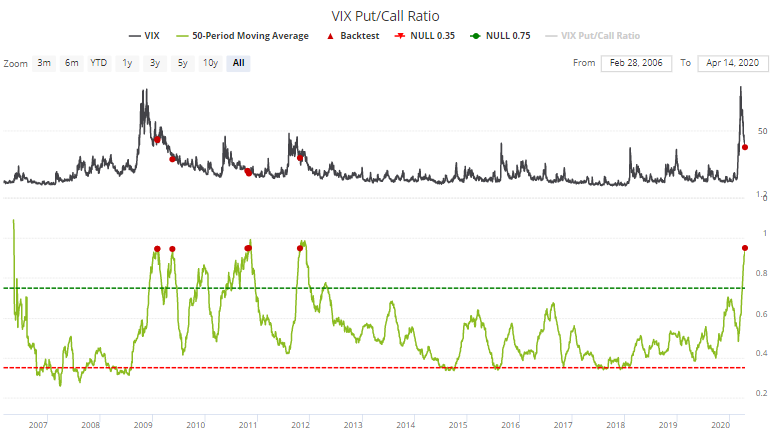
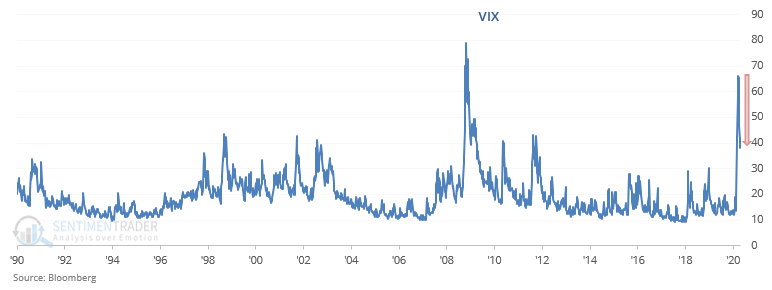
The VIX "fear gauge" has been relaxing from its recent spike. It recently crossed below its 50-day average for the first time in months.
And options traders seem to be betting on it continuing to fall. That has preceded a short-term spike in the past.
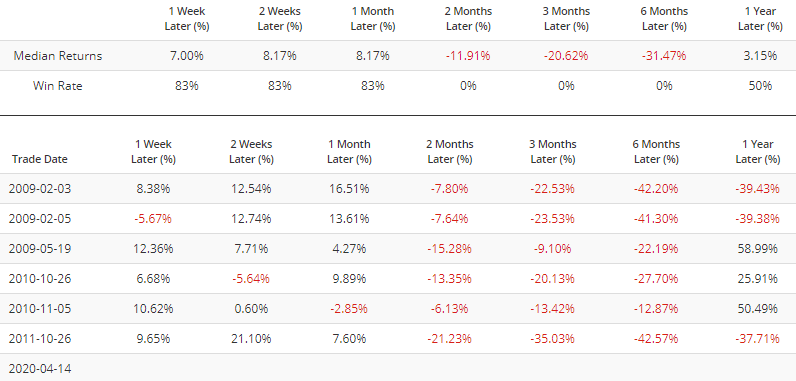
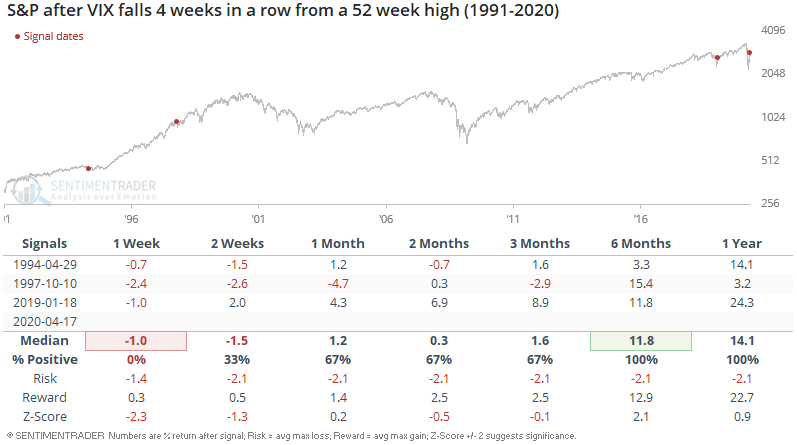
[NEW] Troy notes that the VIX "fear gauge" has now dropped 4 weeks in a row.
When this happened in the past after VIX reached a 52 week high, the S&P 500 struggled over the next week since most post-crash rallies are followed by some form of a pullback. On a longer-term time frame, all 3 of the historical cases saw more gains over the next 6-12 months:
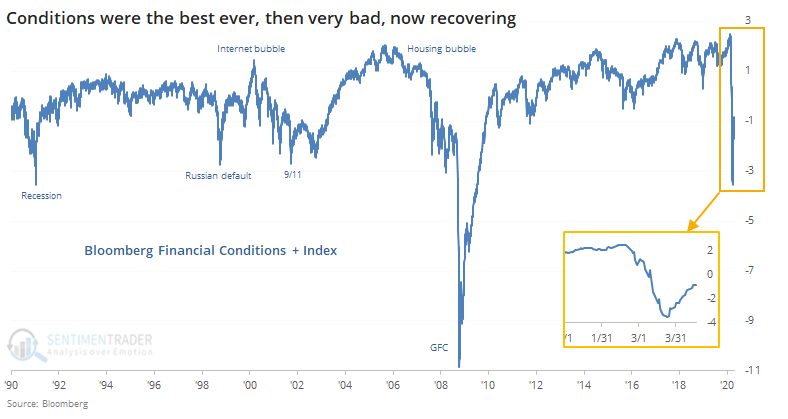
A drift lower in implied volatility, among other measures, has helped to suggest that financial conditions are easing after a record negative plunge.
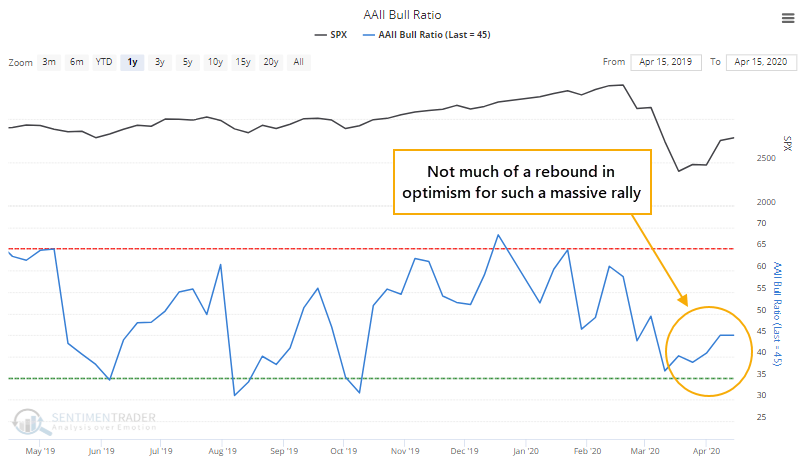
Despite the recovery and easing conditions, individual investors still don't seem very interested in coming back.
Big tech to the rescue
It might seem a bit disturbing that short-term, it's been the big-cap stocks driving this rally, and there has been some curious concentration of volume in declining stocks, at least for a day. Not so much in the Nasdaq, though, which has surged, especially relative to other sectors like financials. Only 2001 saw a performance like this.
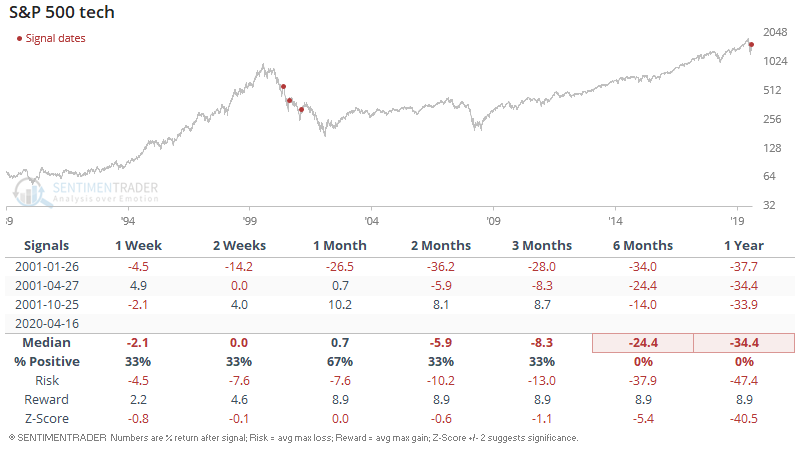
It has been enjoying good gains even though it's suffering a death cross, which has not been a consistent reason to worry. More of a concern is that it has rebounded so quickly after having sold off so hard below its 50-day moving average.
For the past few weeks, most of what we've looked at has been overwhelmingly positive for stocks across most time frames, especially medium- to long-term. Now, studies are turning a little less so but primarily focused on the shorter-term end of the time frames.
[NEW] There haven't been many compelling developments in other markets or sectors, though several of the latter are becoming stretched. By Friday, that list expanded. Troy notes that sentiment continues to rise among other sectors that have been aided by the current coronavirus pandemic or fell the most (and are now staging the sharpest snapback). For example, XLK Optix's 10-day average is at 75:
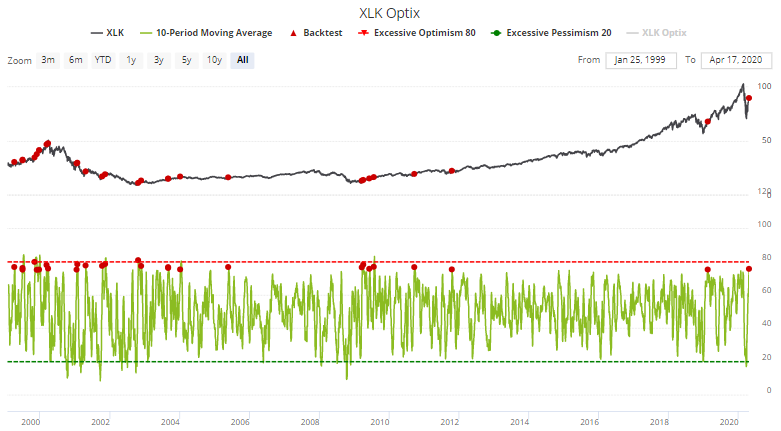
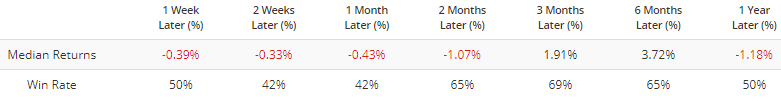
This sometimes led to a short term pullback in tech stocks:
XLY Optix's 10-day average is extremely high at 78, no doubt pushed up by Amazon's strong rally:
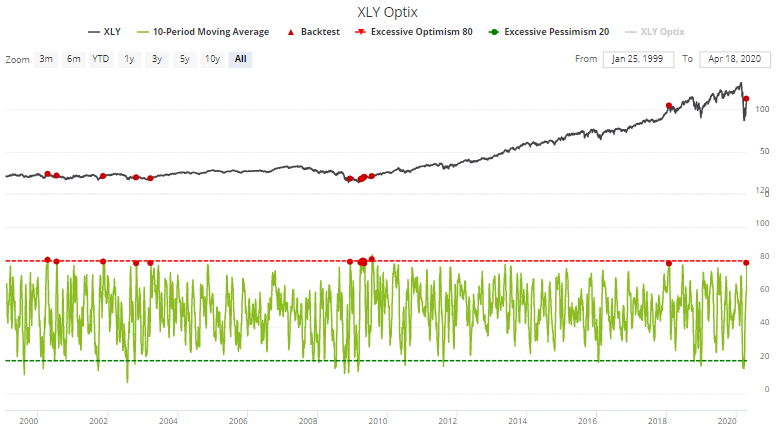
Once again, this sometimes (but not always) led to a short term pullback for consumer discretionary.
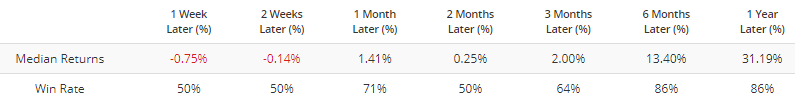
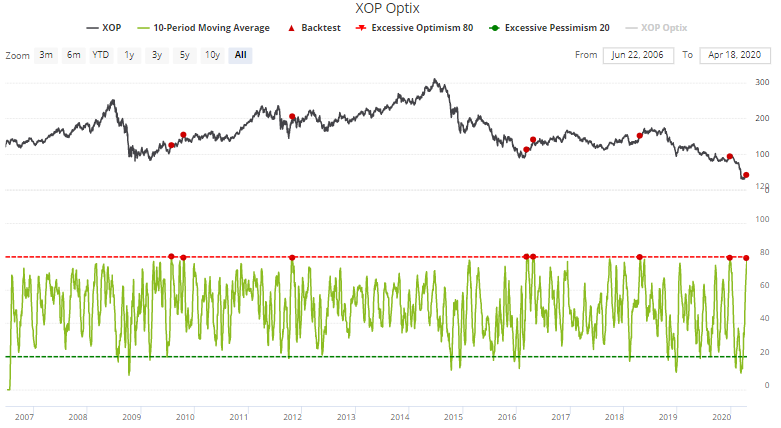
Oil producers got crushed earlier this year and are now staging a comeback. As a result, XOP Optix's 10-day average is at 79, a level which in the past often led to a short term pullback:
Commodity crush
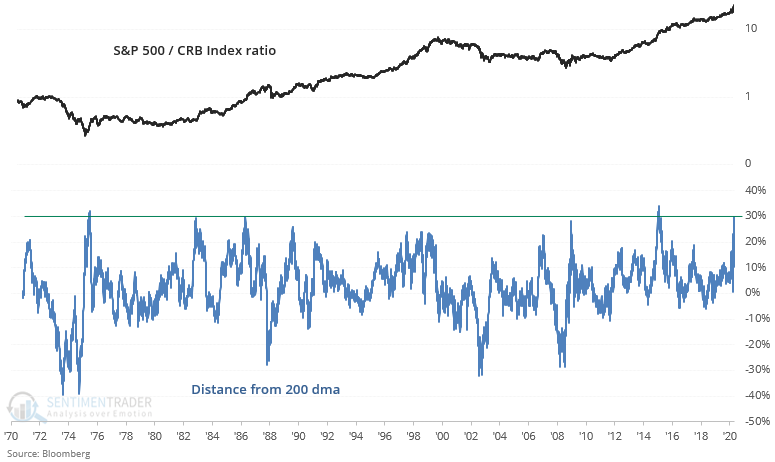
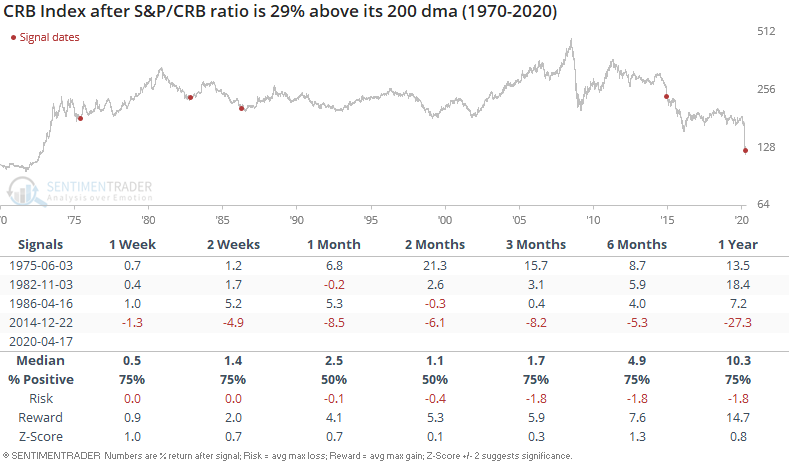
[NEW] Troy notes that commodities have been crushed over the past few months, even as stocks recovered since their bottom in late-March. Oil continues to make marginal new lows despite extreme readings across different types of indicators. The S&P 500 / CRB Index ratio has surged above its 200-day average:
When stocks outperformed commodities this much, this quickly, the S&P faced short term weakness over the next few weeks and months:
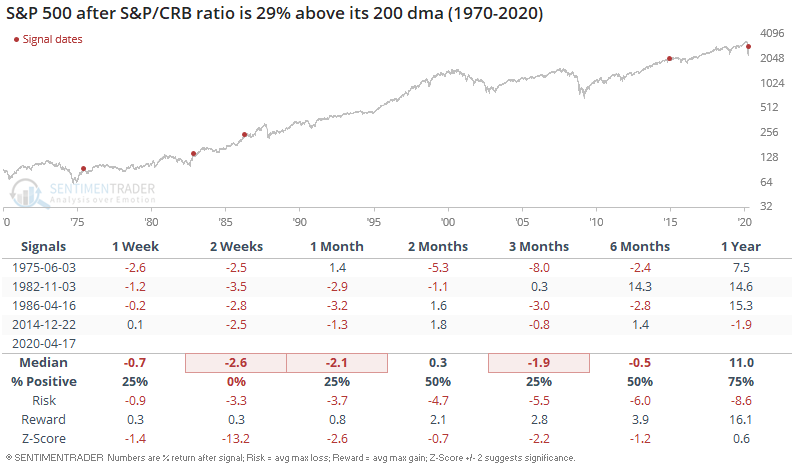
This was a bullish sign for commodities in the 1970s and 1980s, although this signal wasn't very useful for bears during the 2014-2015 commodities crash.
That also happened to be a time when oil rig counts plunged to a degree like we've witnessed in recent weeks.
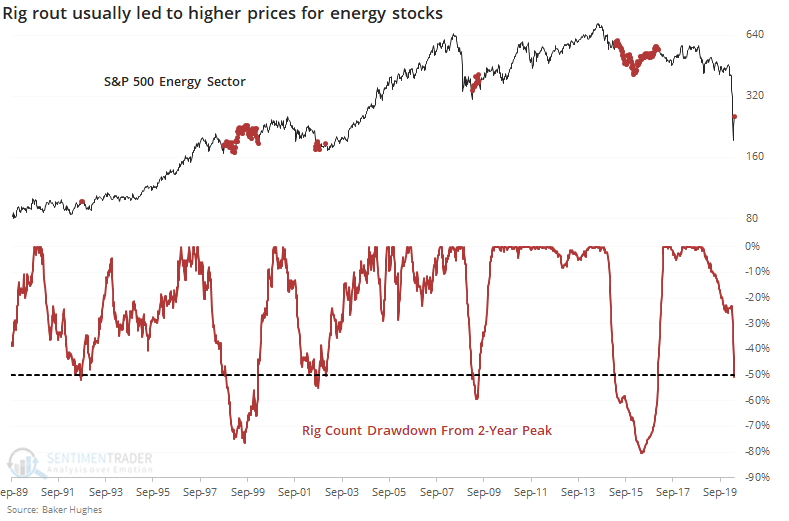
That led to generally higher energy stock prices longer-term, but they still tended to underperform the broader market.
Overall, this is a tough part of the market cycle. Stocks have alleviated many of the extremes, with the short-term outlook a lot muddier than it was even a week ago. Bonds aren't showing any compelling aggregate extremes, and gold is extremely stretched but showing good momentum. Commodities, in general, are struggling to show a unified recovery, especially since oil continues to sag.