
What can we learn when the grocery bill goes up

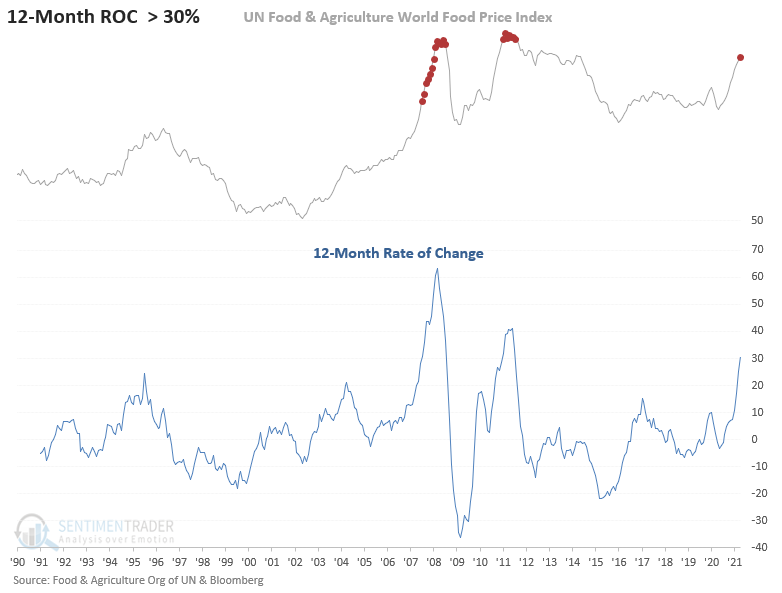
I've seen several references to the year-over-year change in the UN Food and Agriculture World Food Price Index of late. The 12-month rate of change recently crossed above 30%, a level not seen since 2011.
Let's look at the stock market outlook when food prices reach lofty levels like today.
HISTORICAL CHART
Once food prices reach lofty levels like today, they don't stay there for long. However, as an investor, we want to know if a surge in food prices can provide us with an information edge in the stock market.
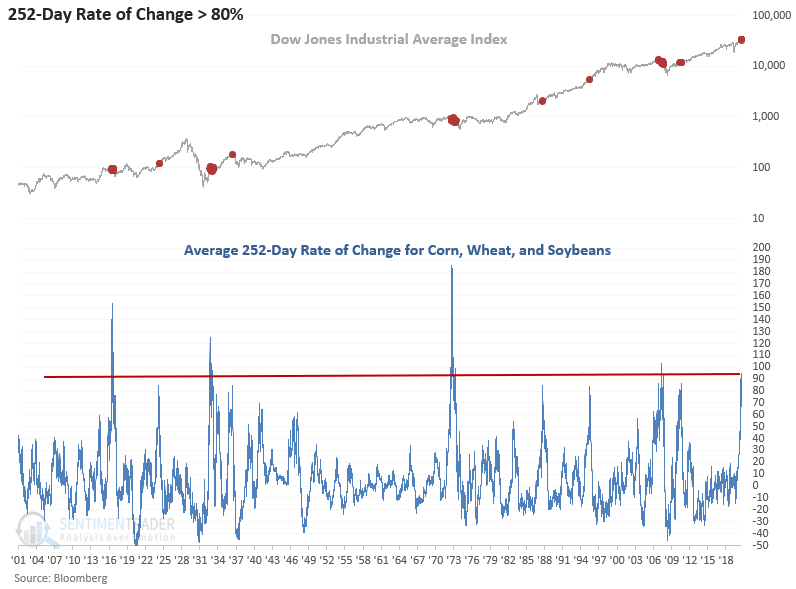
Unfortunately, the world food price index does not have a long history. Let's create a proxy for food prices by combining corn, wheat, and soybeans and measuring the average 252-day rate of change for the group.
FOOD PRICE MOMENTUM CHART
The recent surge in momentum reached the 5th highest level in history on 5/7/21.
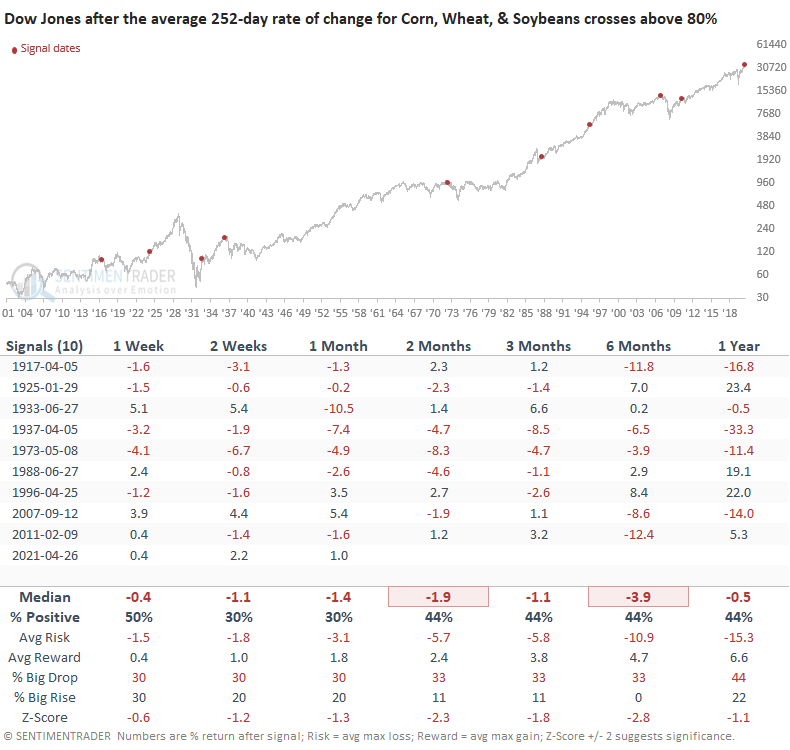
Now that we have more historical data for food prices, let's see what happens to stock prices when the combined average surges above 80%.
HOW THE SIGNALS PERFORMED
Performance looks weak across all timeframes. If one is looking for a historical analog, I suspect the 1933 and 2011 signals might be best as they both occurred after the initial surge from a bear market/recession period.
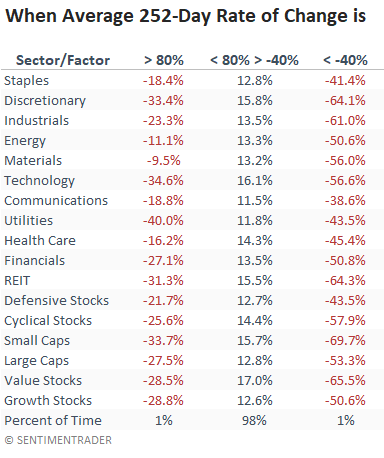
Let's take a look at annualized returns for the combined food proxy momentum indicator.
ANNUALIZED RETURNS SINCE 1927 - COMBINED AVERAGE LEVELS
The table highlights how sectors and factors encounter a more challenging environment when the combined average increases above 80%. Traditionally defensive and commodity-based sectors do better while more growth-oriented ones like discretionary and technology struggle.
Interestingly, we've seen that performance trend of late.
I would note that while rare, stocks do not like either end of the inflation or deflation spectrum.
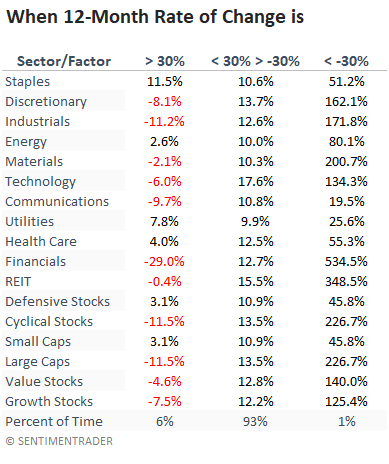
ANNUALIZED RETURNS SINCE 1990 - WORLD FOOD PRICE INDEX LEVELS
The following table provides annualized returns since 1990 using the world food price index with a bracket level of +30% to -30% to reflect the current environment. The +30% performance trends look similar even with less history. However, the -30% or worse y/y level for food prices occurred at a point in time that marked the bottom of the stock market in 2009, hence the strong annualized returns.
Please keep in mind that the sample size is small, and the 2007-08 bear market and 2009 recovery period influenced returns in a meaningful way.
I suspect the stock market remains in a trading range until we see some relief from high commodity prices of all types.