
What extreme price swings mean for this bull market

Looking at price swings during bull and bear markets
One of the market tropes being bandied about now is that since stocks are swinging wildly from day to day, it necessarily means that the bull market is over. Only during bear markets do we see volatility like this.
It certainly has been volatile. Over the past 2 months, the S&P 500 has had a closing gain or loss of more than 1% on 21 sessions, exactly half the sessions. That's high.
The chart below shows the number of +/- 1% daily changes in the S&P over a rolling 42-day stretch, with the gray shading highlighting bear markets. Most of the heavy clusters of 1% swings certainly seemed to be during bear markets.
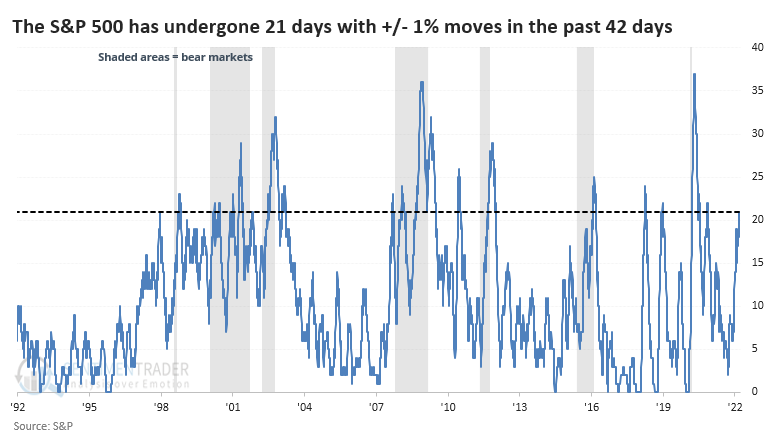
It gets noisy as we zoom out, but going back to 1928, it looks like pretty much the same thing. But there were 3,038 days when the rolling count of 1% days met or exceeded 20, and 1,397 of those days were during bull markets. So, if we were witnessing a big cluster of 1% daily swings, there was still a 46% chance we were in a bull market environment.
When we add the number of 2% and 3% daily swings to our analysis, the results get even more interesting.

French pessimism
The French stock market may be in the process of setting up for better days ahead - however, history suggests that things may get worse before they get better.
The chart below displays all days since 1996 when the France Optimism Index was below 2. A reading this low signals an absurdly washed-out level of bullishness (essentially, there is 2% bullish sentiment and 98% bearish sentiment). You can run this test in our Backtest Engine.
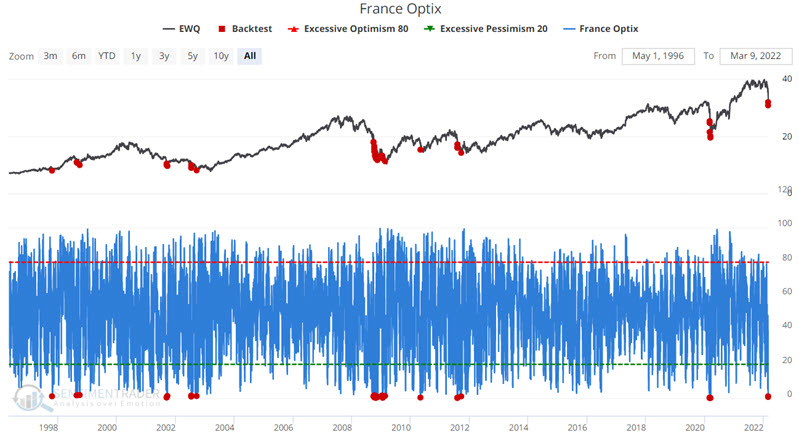
1-day readings are pretty volatile, and we typically like to smooth things out with a moving average. But after similarly low readings, forward results are generally positive - albeit not overwhelmingly so - through 6 months. The 12-month returns are extremely robust.
