
What Happens When Hard Data Hardens

Post-recovery pullback
Stocks recovered from a morning drop, but the S&P still lost more than 3.5% from its recent peak on an intraday basis. That’s largest drop so far during the recovery from the December low, more than 90 trading sessions.
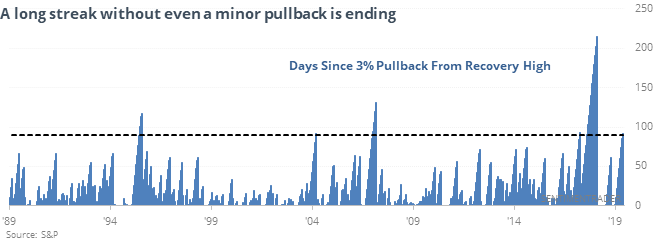
This ends one of the longest-ever streaks since 1928 without seeing this much of a pullback. A year later, the S&P’s winning percentage and average return were nothing special. The losses were all relatively small, though, and the risk/reward was heavily tilted to the reward side.
Hard data makes a comeback
For the past couple of months, soft economic data like surveys have beat hard data like retail and home sales, employment figures, etc. That has changed, with hard data beating soft data.
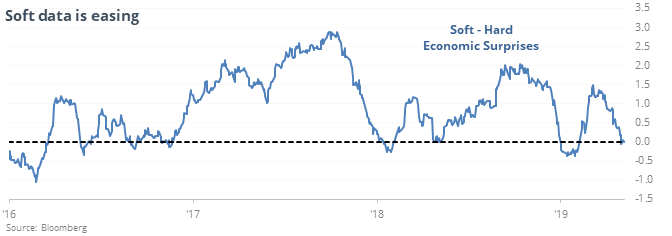
That should be a good sign and under similar conditions stocks did okay. The dollar did not.
Leaving SPY
The most-established ETF in the world has been bleeding assets. Investors pulled an average of $1.8 billion each day from SPY over the past week. When the S&P was still above its 50-day average at the time, SPY tended to frustrate those sellers over the next two weeks, with gains after 9 of 11 days per the Backtest Engine.
Curling up
The spread between Smart and Dumb Money Confidence is starting to turn. The 20-day average just turned higher for the first time in months. When it does so from a very low level, the S&P rose over the next week only 2 out of 9 times. A month later, it was higher 4 times, but still had risk of -3.2% versus reward of +1.9%.
Bad beans
Optimism on soybeans, at 15%, is tied for the lowest on record with May 2015 and August 2018.
This post was an abridged version of our previous day's Daily Report. For full access, sign up for a 30-day free trial now.