Products
SentimenTrader Trading Tools
‍
Backtest Engine
My Trading Toolkit
Correlation Analysis
Seasonality
Market Prediction
Indicators & Data API
‍
Proprietary Indicators & Charts
Market Data API
Strategies & Scanner
‍
50+ Trading Strategies
Smart Stock Scanner
Smart Option Scanner
Research Reports
‍
Research Solutions
Reports Library
Free Resources
Simple Backtest Calculator
Simple Seasonality Calculator
The Kelly Criterion Calculator
Sentiment Geo Map
Public Research Reports
Education
Sentiment Indicators
Technical Indicators
Pricing
Company
About
In the News
Testimonials
Client Success Stories
Contact
Log inLoginSign up
< BACK TO ALL REPORTS

What happens when the 2-year yield surges on a CPI day

Dean Christians
2022-02-11
The 2-year treasury yield surged by the most significant amount on a CPI day since 2003. Let's assess the outlook for stocks and bonds after similar instances.

Key points:

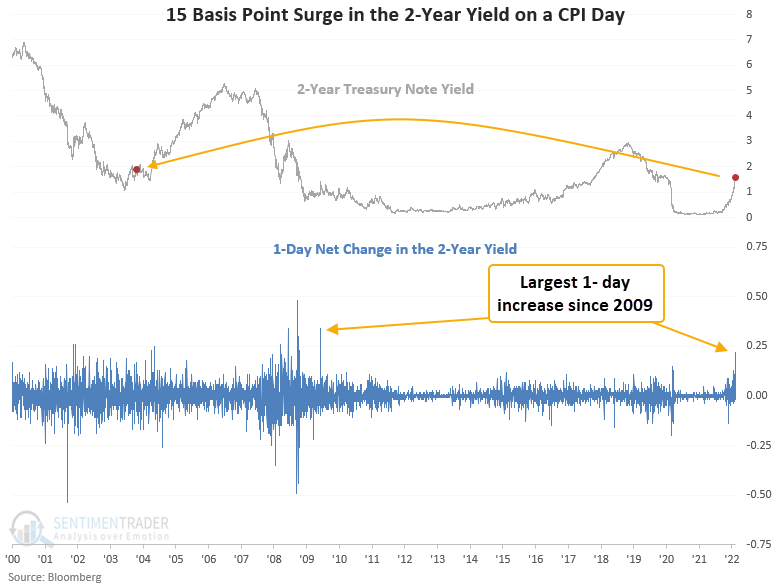
  • The BLS released the January Consumer Price Index data on Thursday
  • The 2-year Treasury note yield increased by 22 basis points 
  • Stocks show slightly negative to flat returns in a rising rate environment in the near term

What happens when the 2-year yield surges on a CPI release day

Let's conduct a study to assess the outlook for stocks and bonds when the 2-year treasury note yield increases by 15 basis points or more on a CPI release day. To assess more historical instances, I lowered the threshold from 22 to 15 bps. If I used a similar increase to the level achieved on Thursday, the study would show only 1 other example. That signal occurred in 1983.

The 22 basis point increase in the 2-year yield represents the most significant 1-day net change since June 2009. When I include the CPI date condition, we see that this is the first 15 bps or more increase on a CPI day since October 2003.

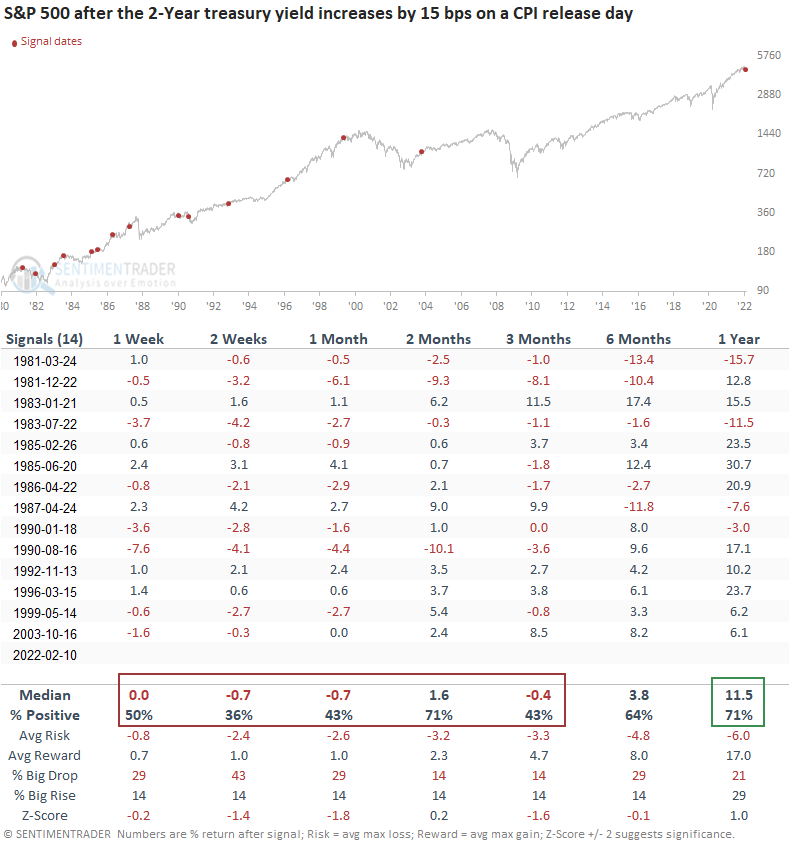
Similar CPI yield surges show slightly weak returns for the S&P 500

This signal has triggered 14 other times over the past 41 years. After the others, the S&P 500 shows slightly weak returns and unfavorable win rates across most short and medium-term time frames. However, the 1-year win rate and return suggest that similar increases in the 2-year yield do not foreshadow the end of the equity bull market. 

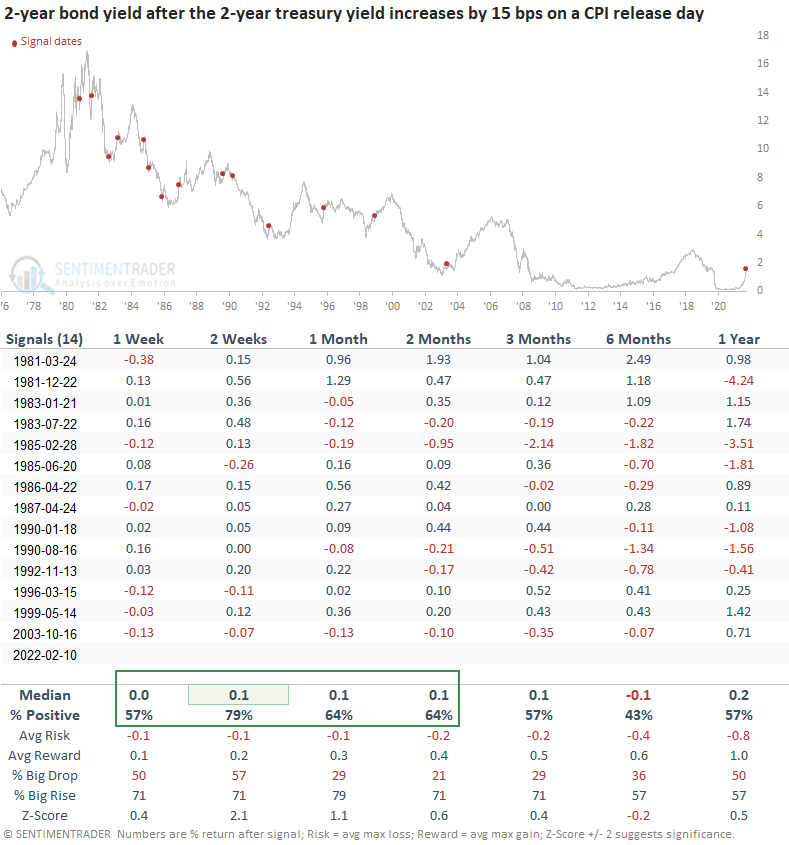
Similar CPI yield surges show the 2-year yield can rise even further in the near term

The short to medium-term time frames suggest the 2-year yield can continue to increase, especially in the 2-week window. The table also shows higher rates at some point in time over the next 6 months in 13 out of 14 instances.

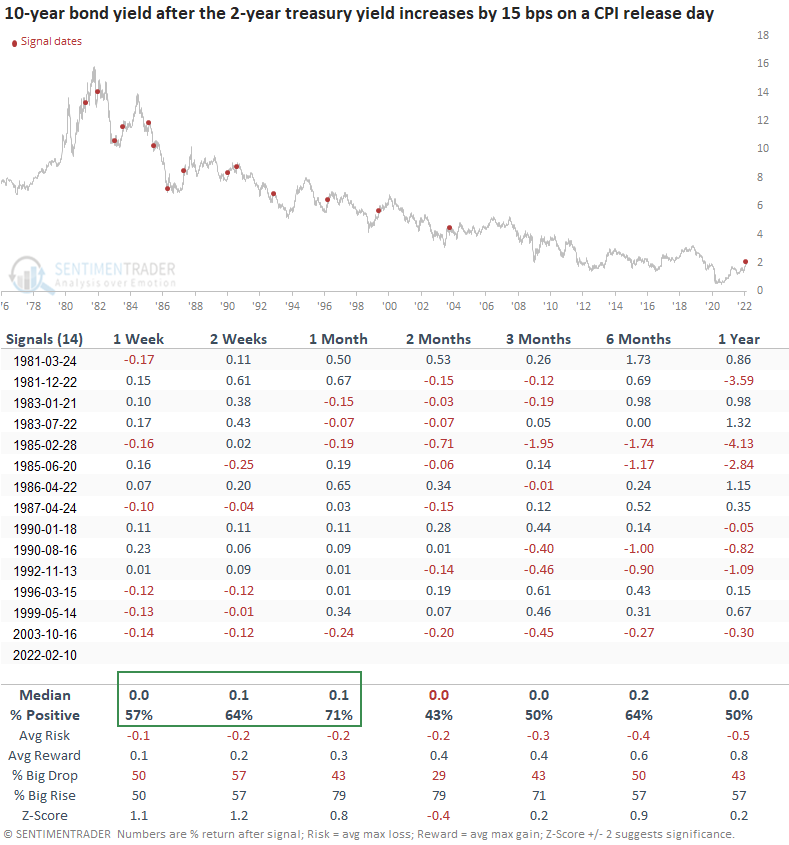
Similar CPI yield surges show the 10-year yield can rise even further in the near term

The 1-4 week time frames suggest the 10-year yield can continue to increase, especially in the 4-week window. As was the case with the 2-year, the table shows longer duration yields increased at some point in time over the next 6 months in 13 out of 14 instances.

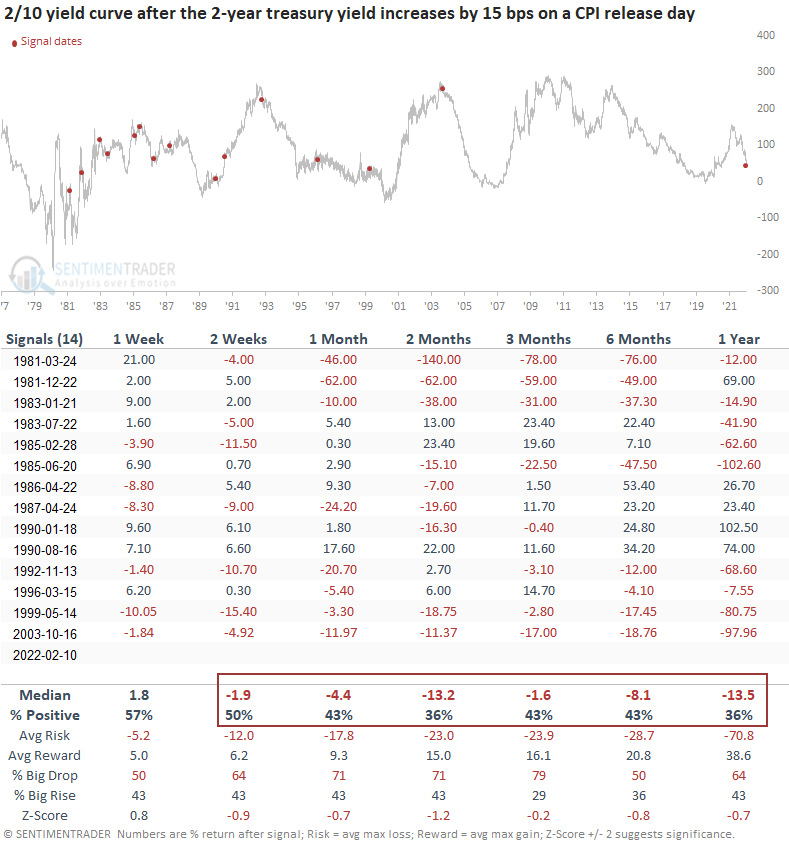
Similar CPI yield surges show the yield curve can continue to flatten

Except for the 1-week time frame, the CPI yield surge suggests the 2/10's yield curve can continue to flatten.

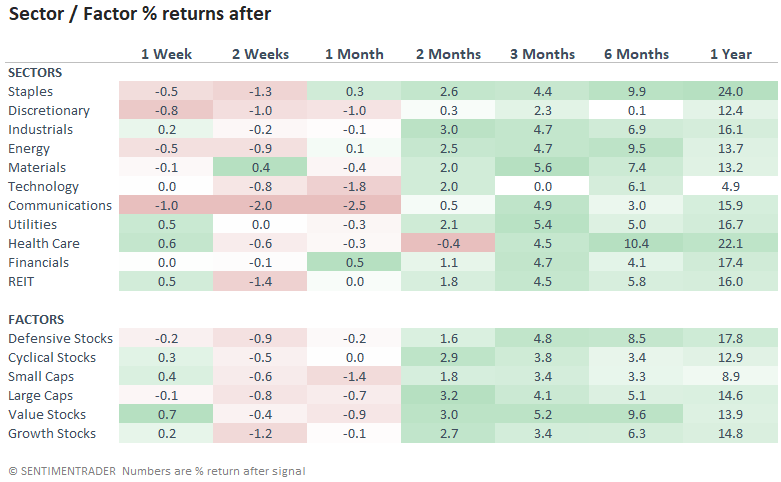
Sectors and factors confirm the broad market message

When we examine sectors and factors, the return patterns look similar to the S&P 500. One might expect soft results in the near term but significantly better days ahead, especially a year from now. 

What the research tells us...

When the 2-year treasury yield increases by 15 bps or more on a CPI day, stocks struggle, and bond yields increase in the near term. However, the adjustment to higher rates is relatively short-lived as equities show significantly better results a year later. We should also be mindful of further flattening in the 2/10's yield curve from an already low spread of 44 bps.

In a note on Wednesday, I shared a study that shows what happens when the 2-year yield increases for 7 consecutive weeks. Today's note provides additional evidence that confirms an environment where stocks struggle in the near term as the market adjusts to the new reality of higher interest rates.

PRODUCTS
SentimenTrader
Trading Tools
Indicators & Data API
‍
Strategies & Scanner
‍
Research Reports
FREE
RESOUrCES
Simple Backtest
Calculator
Simple Seasonality
Calculator
The Kelly Criterion
Calculator
Sentiment Geo Map
‍
Public Research Reports
‍
Education
Sentiment Indicators
‍
Technical Indicators
‍
Pricing
Bundle pricing
‍
FAQ
‍
Announcements
‍
COMPANY
‍
About
‍
In the News
‍
Testimonials
‍
Client Success Stories
CONTACT
‍
General Inquiries
‍
Media Inquiries
‍
Financial Professionals Inquiries
‍
© 2026 Sundial Capital Research Inc. All rights reserved.
Setsail Marketing
TermsPrivacyAffiliate Program
Risk Disclosure: The information and tools provided are for research and analytical purposes only and are not intended as investment advice. Market analysis involves uncertainty, and outcomes may differ from expectations. Users should conduct their own due diligence and consider their individual circumstances before making any financial decisions. Past performance is not necessarily indicative of future results.

Hypothetical Performance Disclosure: Hypothetical performance results have many inherent limitations, some of which are described below. No representation is being made that any account will or is likely to achieve profits or losses similar to those shown; in fact, there are frequently sharp differences between hypothetical performance results and the actual results subsequently achieved by any particular trading program. One of the limitations of hypothetical performance results is that they are generally prepared with the benefit of hindsight. In addition, hypothetical trading does not involve financial risk, and no hypothetical trading record can completely account for the impact of financial risk of actual trading. for example, the ability to withstand losses or to adhere to a particular trading program in spite of trading losses are material points which can also adversely affect actual trading results. There are numerous other factors related to the markets in general or to the implementation of any specific trading program which cannot be fully accounted for in the preparation of hypothetical performance results and all which can adversely affect trading results.

Testimonial Disclosure: Testimonials appearing on this website may not be representative of other clients or customers and is not a guarantee of future performance or success.