
What I'm looking at - AIM, yield curve steepening, Macro Index, Initial Claims, emerging market currencies
Here's what I'm looking at:
AIM (Advisor & Investor Model)
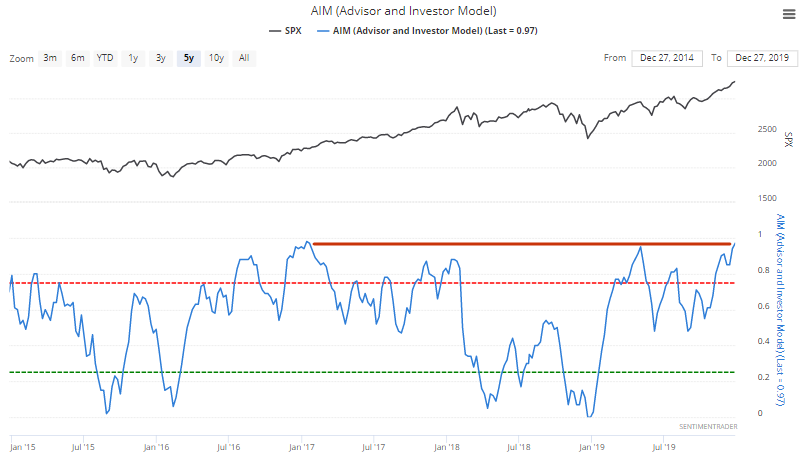
With the U.S. stock market trending higher into year-end, more and more market investors are turning optimistic towards U.S. equities. This stands in stark contrast with the end of 2018, when the common question wasn't if a recession was about to start, but when it will start. Our Advisor and Investor Model, which looks at sentiment readings from advisor and investor surveys, has risen to the highest level in almost 3 years:
While extremely high sentiment readings are often short term bearish for stocks, they aren't usually bearish on a 6-12 month basis. A resurgence in excessive optimism tends to happen 1-2 years after a major period of market turmoil.
*It usually takes some time for investors and traders to mentally shake off the ghosts of the past.
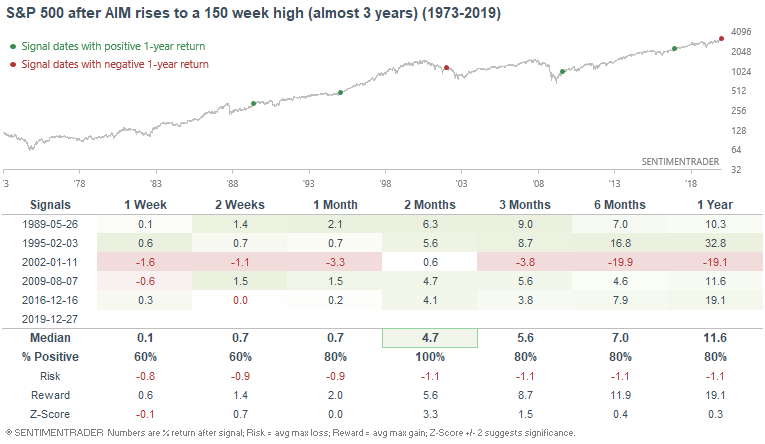
AIM rising to an almost 3 year high occurred in:
- 1989 (after the 1987 crash). Stocks continued to rally over the next year
- 1995 (after a yearlong consolidation in 1994). Stocks continued to rally over the next year
- 2002 (after the 2001 recession). This was a false rally, and the bear market went down 1 more leg
- 2009 (after the 2008/09 recession and stock market crash). Stocks continued to rally over the next year
- 2016 (after the 2015-2016 global slowdown scare). Stocks continued to rally over the next year
Yield curve steepening
Investors were freaking out over the yield curve inversion this year due to the signal's historical ability to predict recessions and bear markets. With long term yields no longer falling, the 10 year - 2 year Treasury yield curve has steepened to the highest level since 2018:
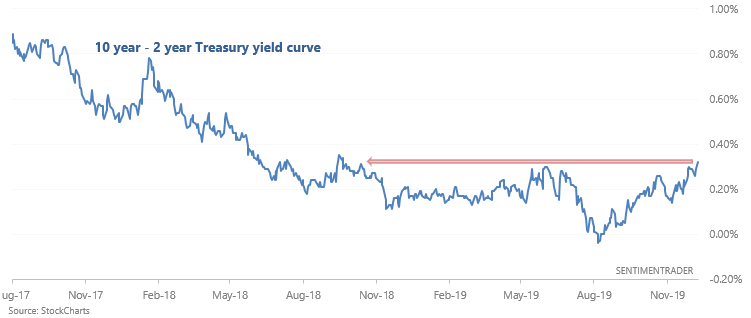
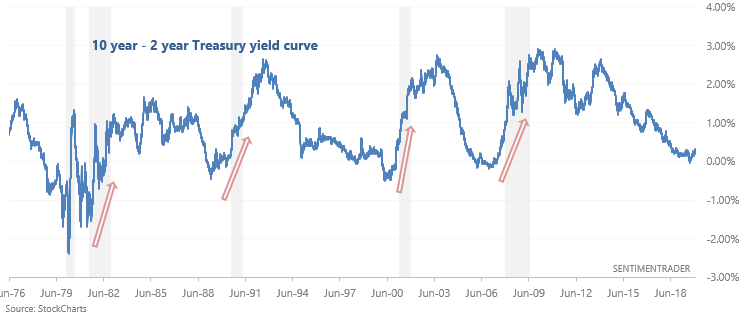
This isn't a terrific signal for stock market bulls, since the yield curve tends to steepen going into a recession/bear market:
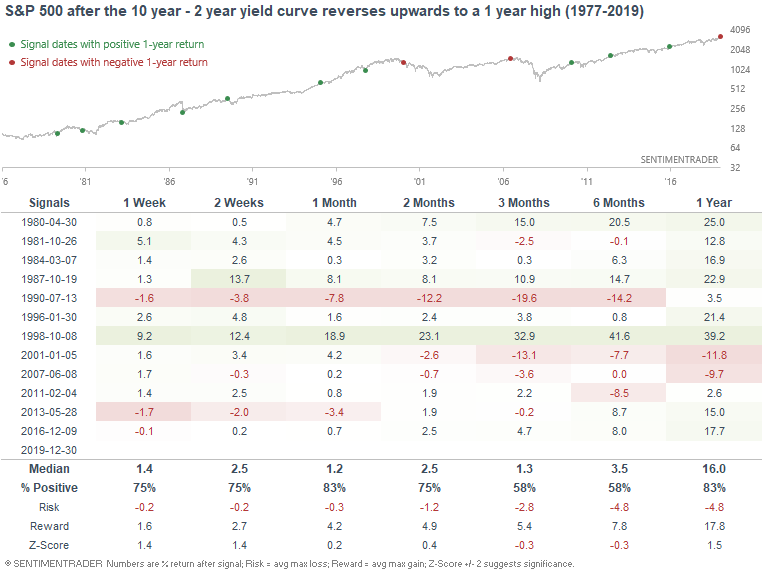
The following table looks at every case in which the 10 year - 2 year Treasury yield curve steepened to a 1 year high:
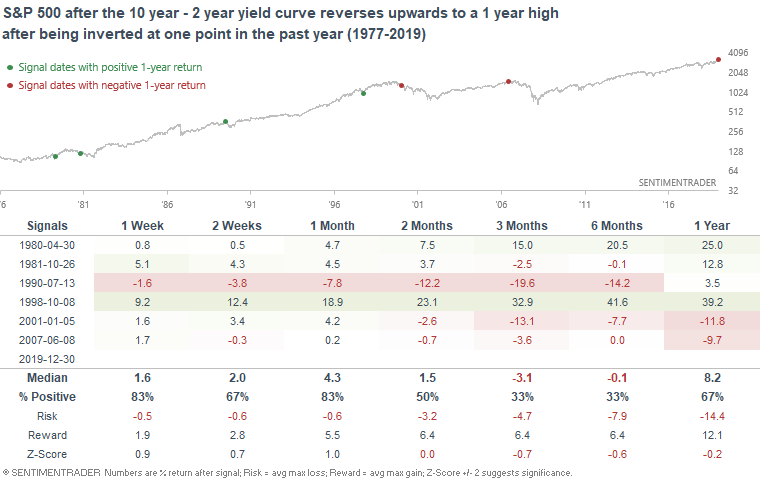
We can narrow down this list of dates to cases which saw an inverted yield curve sometime over the past year:
Overall, the yield curve is sending a long term bearish signal for stock market bulls. It will weigh down on the Macro Index for January 2020, but will not be enough to flip the Macro Index from bullish to bearish. It's important to remember that the yield curve is merely one of many fundamental indicators to watch. It's not the Holy Grail of timing bear markets or recessions.
Macro Index
Speaking of the Macro Index, its reading for January 2020 will be 0.72. While this reading is worse than what we've seen in recent months, it still means that the Macro Index is in bullish territory. Bearish territory is under 0.7, which we saw last December (just before stocks crashed).
Macro Index readings <0.7 are quite useful for predicting recessions, bear markets, and market crashes. And since major stock market crashes and recessions don't usually happen back to back, a stock market rally tends to last more than 1 year after the Macro Index was last bearish.
The following table illustrates what happened next to the S&P when the Macro Index was under 0.7, and then the S&P surged more than 20% in the next year:
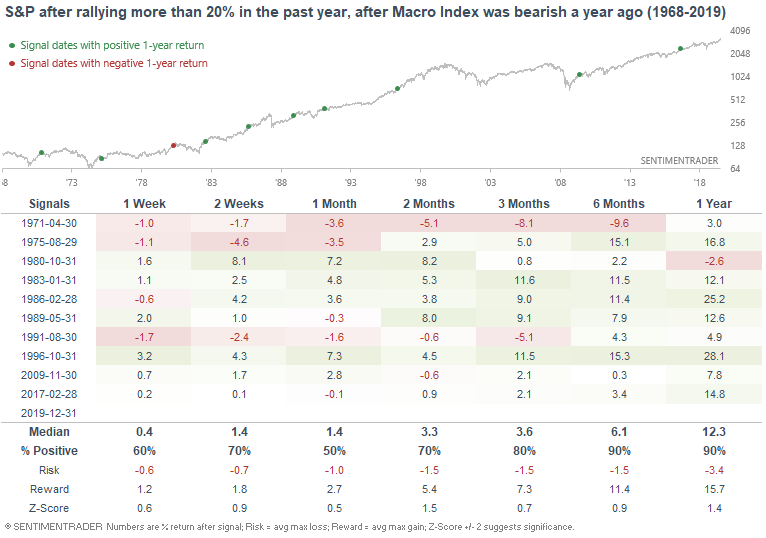
As you can see, the S&P usually pushed on towards more gains over the next 6-12 months, although the next year was typically not as bullish as the previous year (i.e. 2020 won't be as bullish as 2019).
Initial Claims
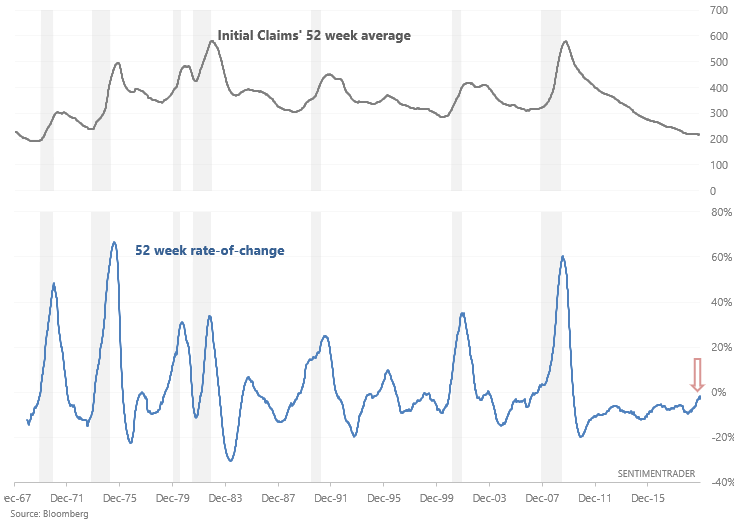
As Tiho Brkan mentioned, the 52 week rate-of-change in Initial Claim's 1 year average is about to turn positive for the first time in almost a decade:
Labor market indicators like Initial Claims are quite useful for long term market timing, which makes the trend in Initial Claims somewhat worrisome. The following table illustrates what happens when Initial Claims is on the verge of trending higher:
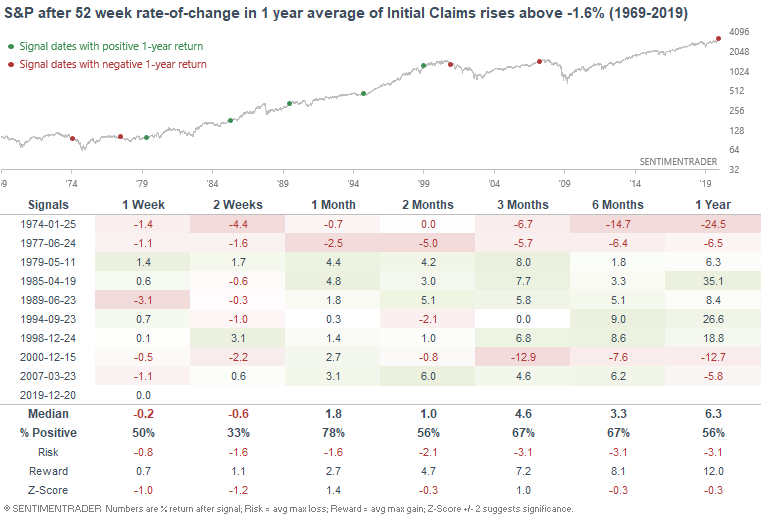
The S&P's returns were worse than random over the next year since this can happen before or during the start of a recession (see 2007, 2000, 1974). However, there were also other false signals (1998, 1994), which is why I'm not terribly concerned about Initial Claims right now. I'd be more concerned if:
- Initial Claims start to solidly trend higher, which hasn't happened yet.
- The S&P also starts to trend lower, which hasn't happened yet.
Overall, it's better to combine labor market indicators with a trend following filter since nothing is more important than price. I.e. instead of turning bearish on stocks when Initial Claims is trending higher, turn bearish only if Initial Claims is trending higher AND the S&P is trending lower.
Emerging market currencies
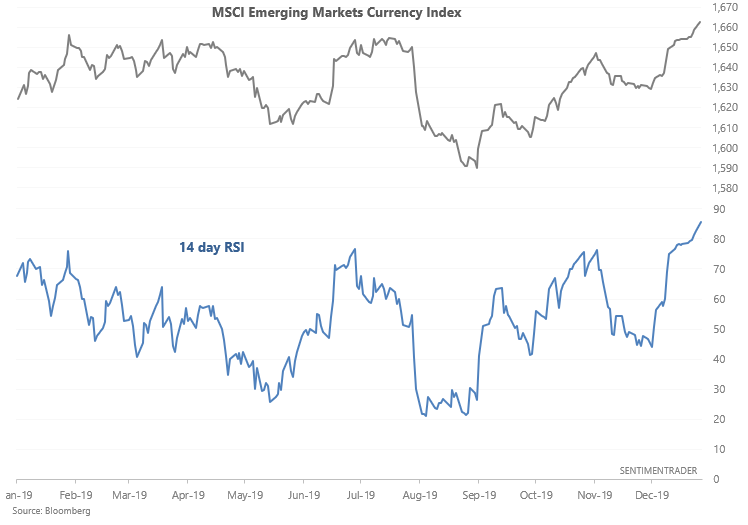
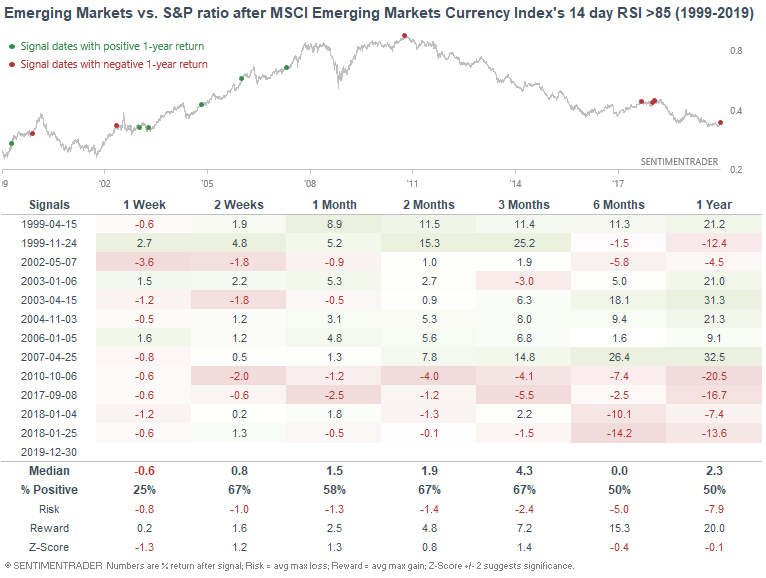
As the WSJ noted, the MSCI Emerging Markets Currency Index has risen sharply and the U.S. Dollar is at risk of breaking down. This has pushed the MSCI Emerging Markets Currency Index's RSI to the highest level in almost 2 years:
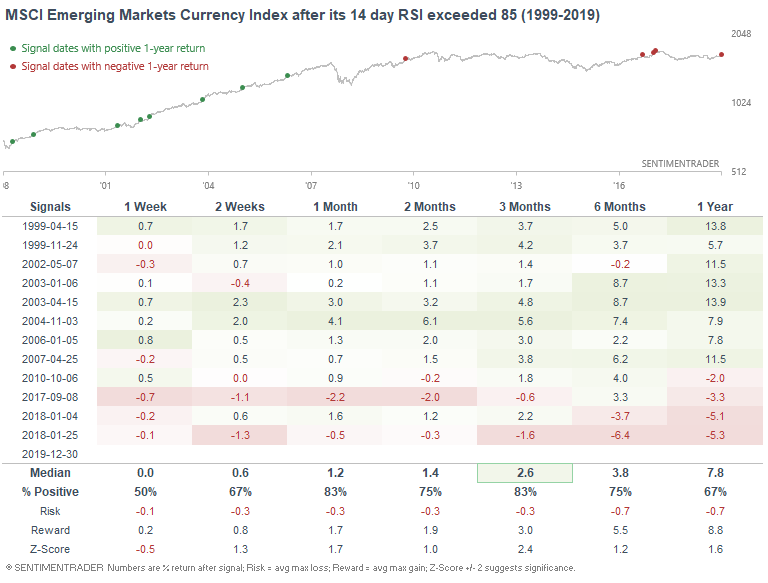
When emerging market currencies witnessed extremely strong momentum, they often pushed higher over the next 3 months. Granted, the last few signals didn't work too well since emerging markets have been continuously weak over the past decade:
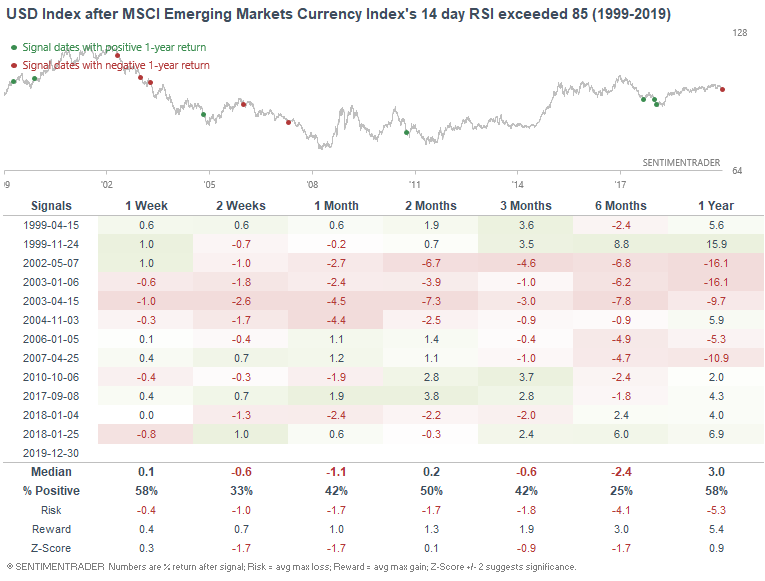
Meanwhile, the U.S. Dollar Index often performed poorly over the next 6 months.
Does this mean that emerging market equities will outperform U.S. equities? Not necessarily. When this happened in the past, the ratio between the MSCI Emerging Markets Index and S&P 500 didn't always go up.
Perhaps the U.S. Dollar is in the beginning of a downtrend. Take these thoughts with a grain of salt since I don't trade emerging markets or currencies. Disclaimer: I have no skin in the game for emerging market equities or forex.
My trading portfolio
I've been moving countries and changing residencies over the past half year, so I haven't done much trading up until a month ago. Now that I've settled down, I've reopened trading accounts. In the interest of transparency, I'm going to show you what my own trading portfolio is doing, similar to what Jason does.
From October 25 (when I started to trade again) - present:
- My account is up 2.55%
- Currently 100% in bonds
I don't place discretionary trades - these are purely based on my quantitative models.