What I'm looking at - breakouts, Put/Call, NASDAQ breadth, new highs
With stocks at all-time highs, here's what I'm looking at:
Breakouts
Various stock markets, indices, and sectors continue to breakout.
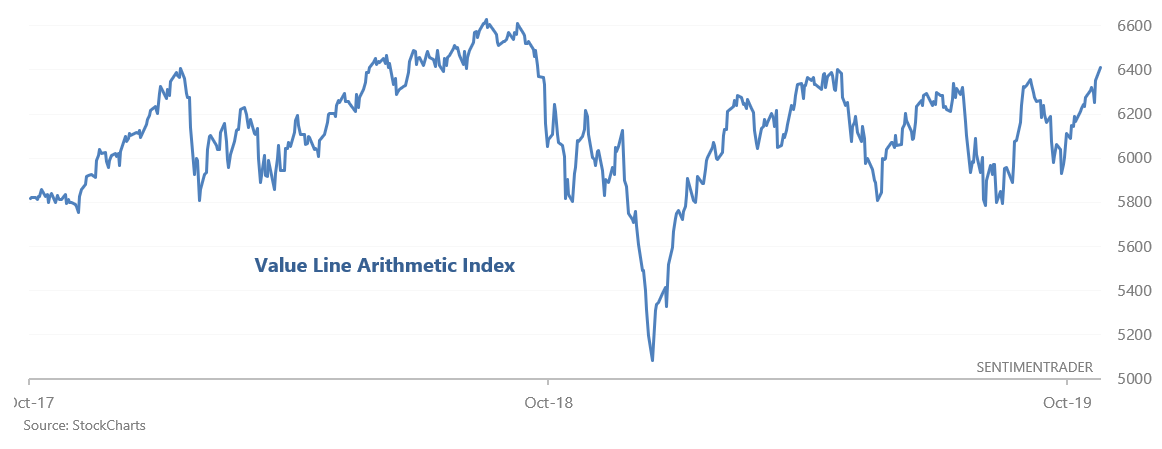
For example, the Value Line Arithmetic Index - an index of North American stocks - has broken out to the highest level since October 2018:
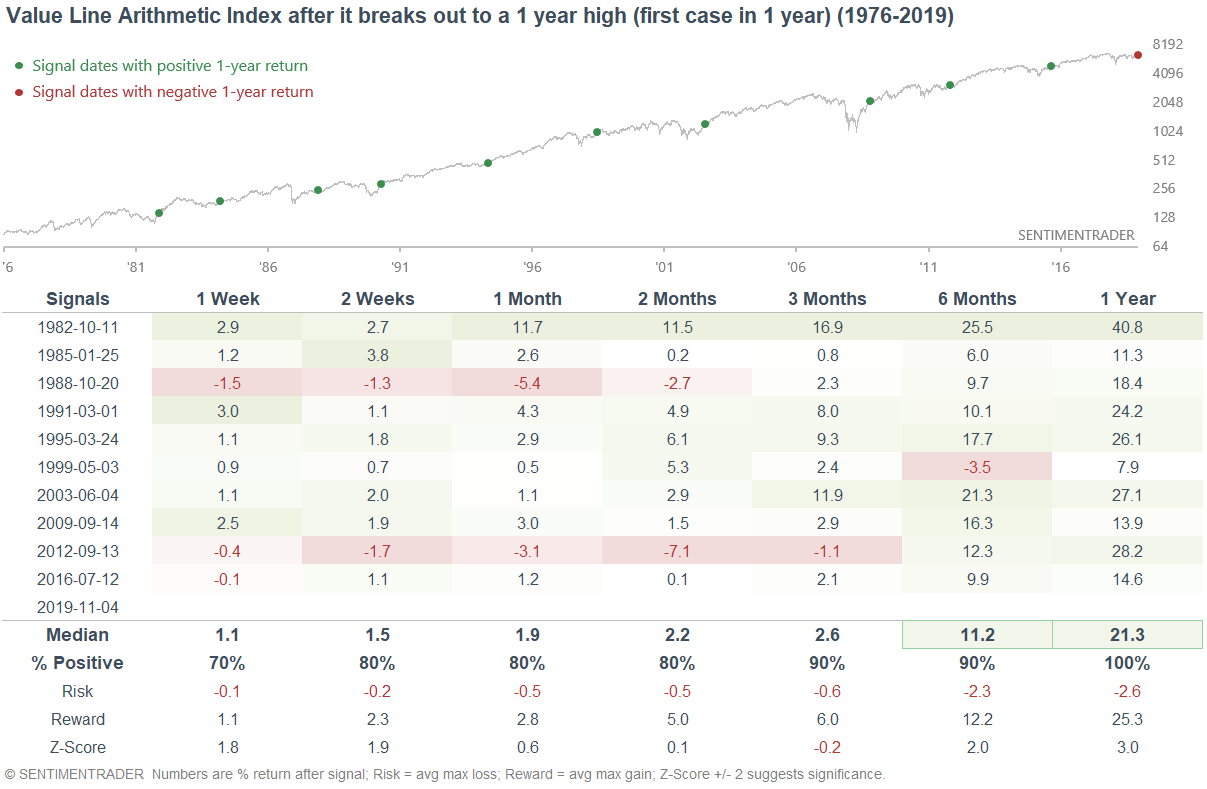
Such breakouts are typically bullish for stocks over the next 6-12 months. Here's what the Value Line Arithmetic Index did next:
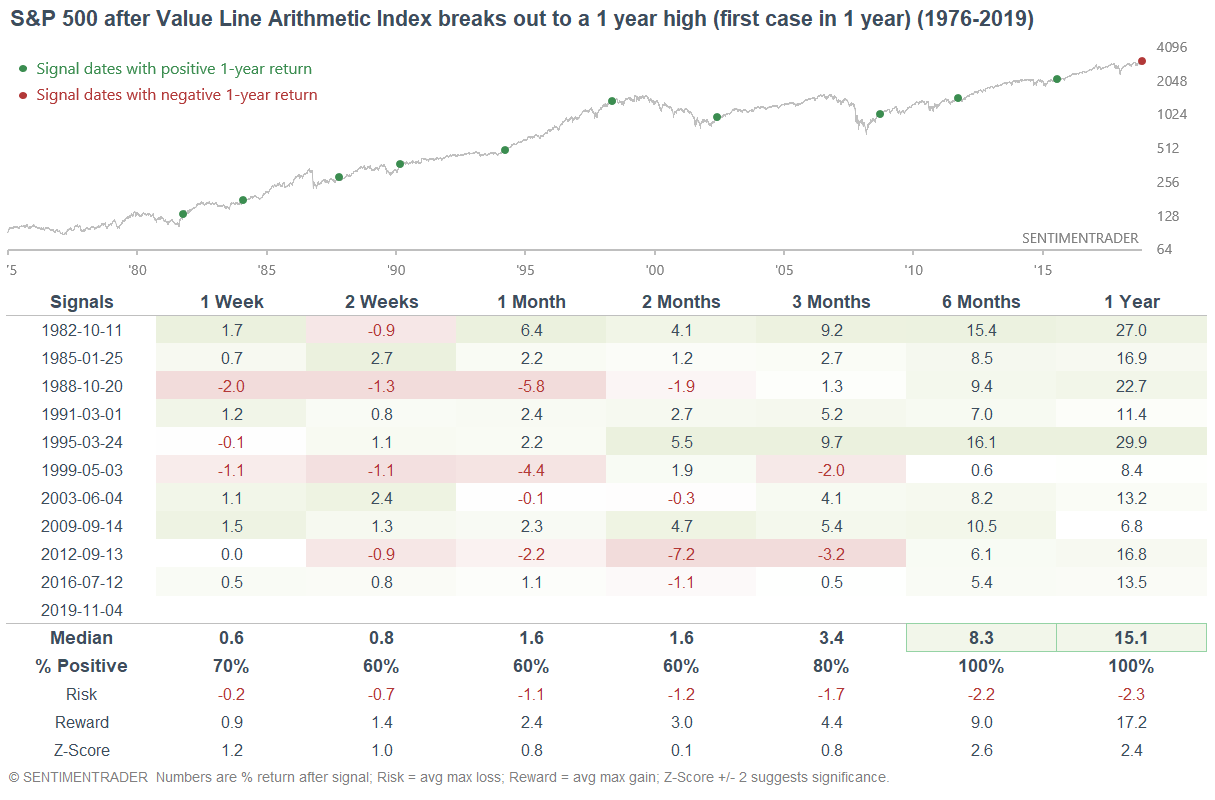
Here's what the S&P 500 did next:
Similarly, the STOXX Europe 600 (90% of European market cap) has broken out to a multi-year high:
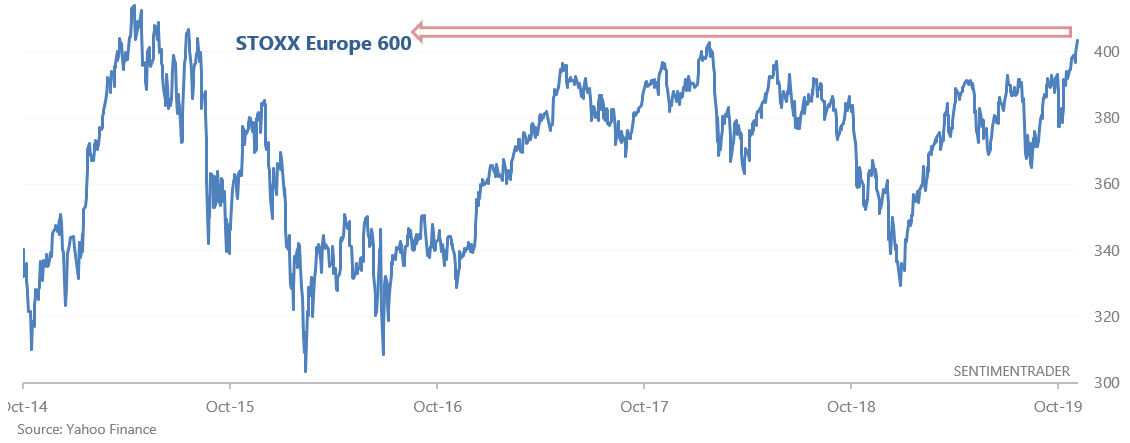
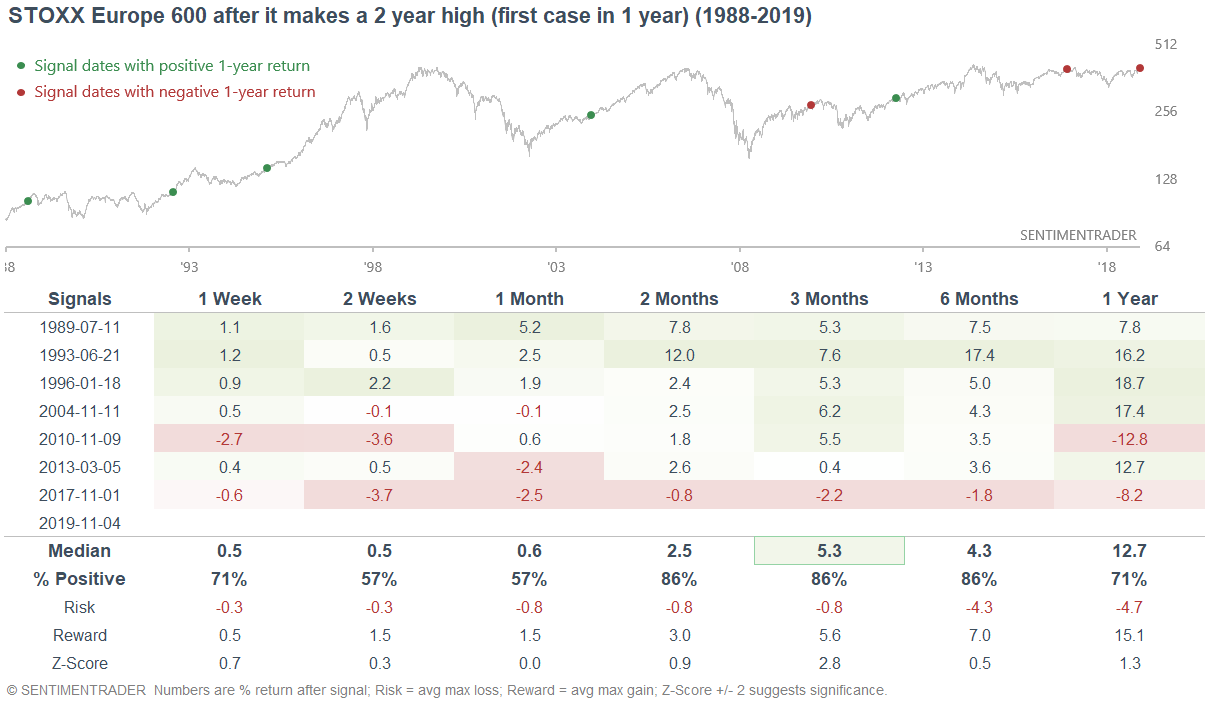
When it did so in the past, the STOXX Europe 600 typically rallied over the next 2-6 months (with the most recent case being an exception)....
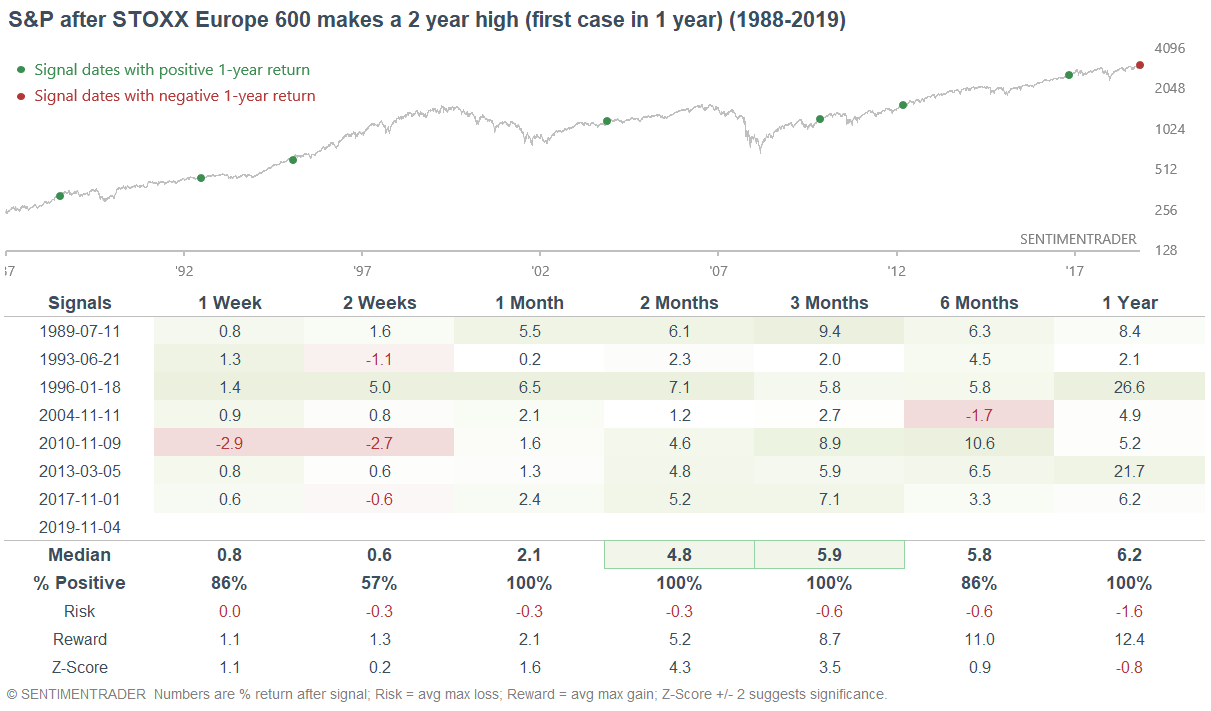
....and the S&P 500 typically did well.
Put/Call
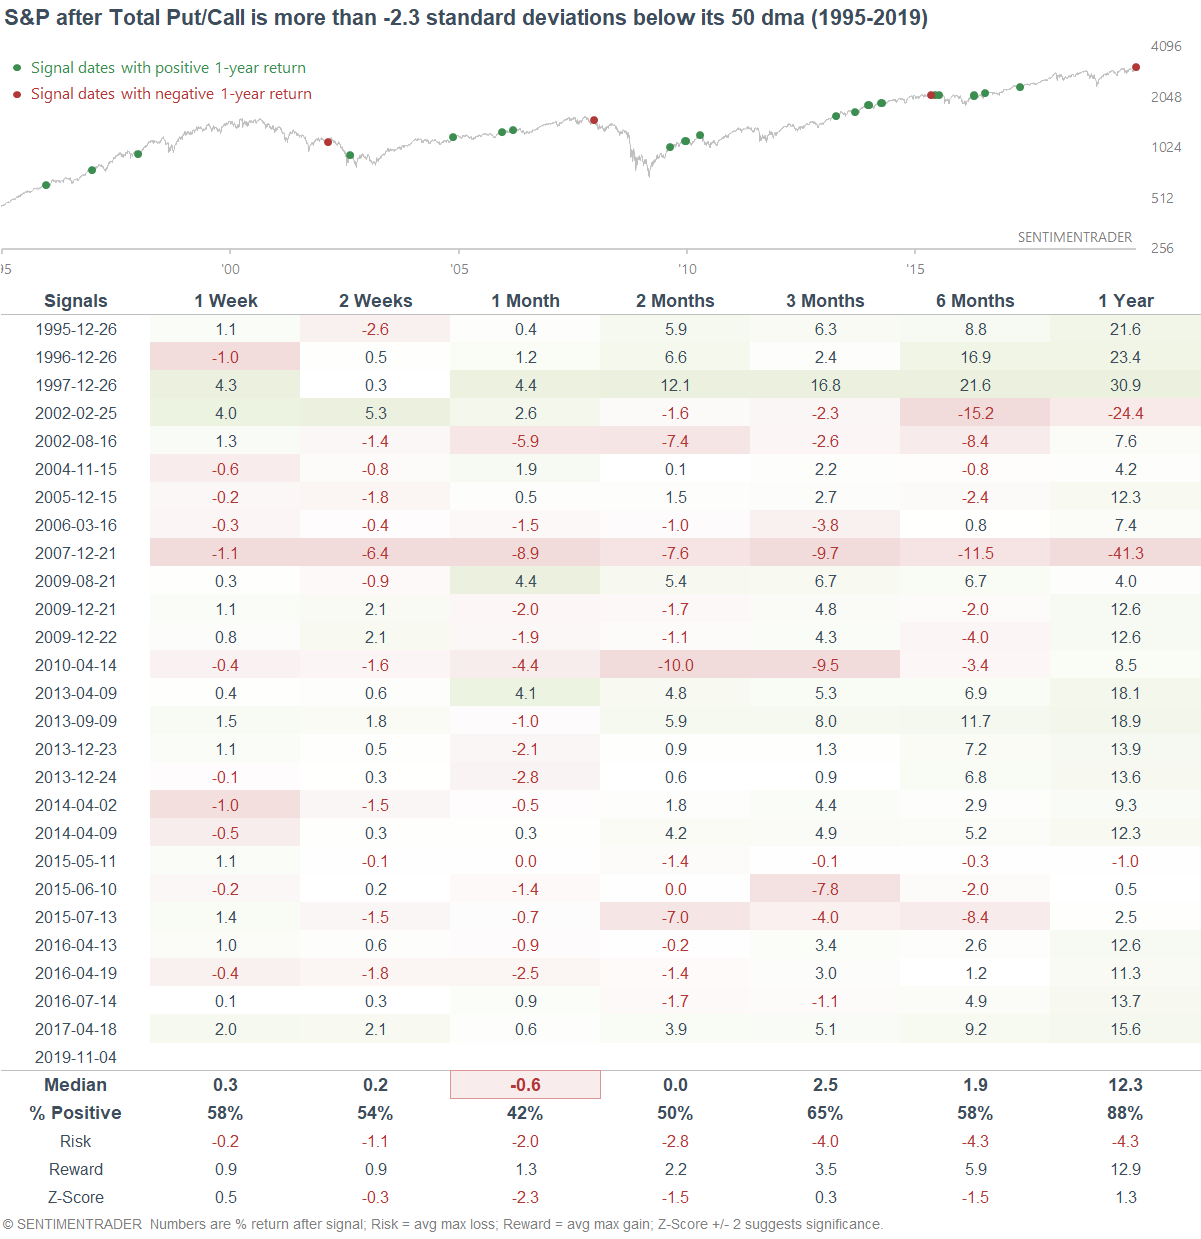
With yesterday's jump in the stock market, the Total Put/Call ratio fell the lowest level in years:
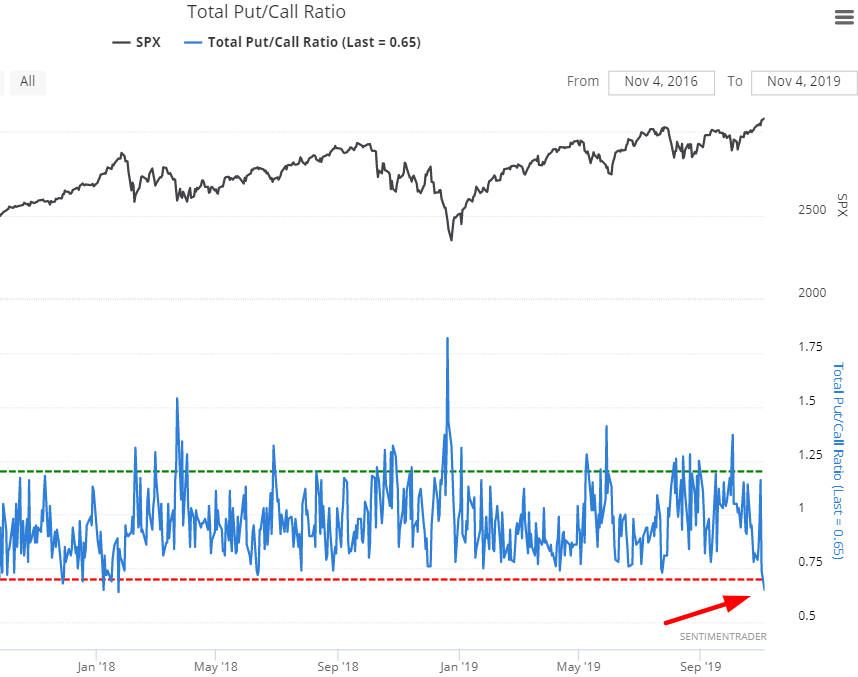
The Put/Call ratio is now more than -2.3 standard deviations below its 50 dma. When this happened in the past, the S&P's returns over the next month were more bearish than random:
NASDAQ breadth
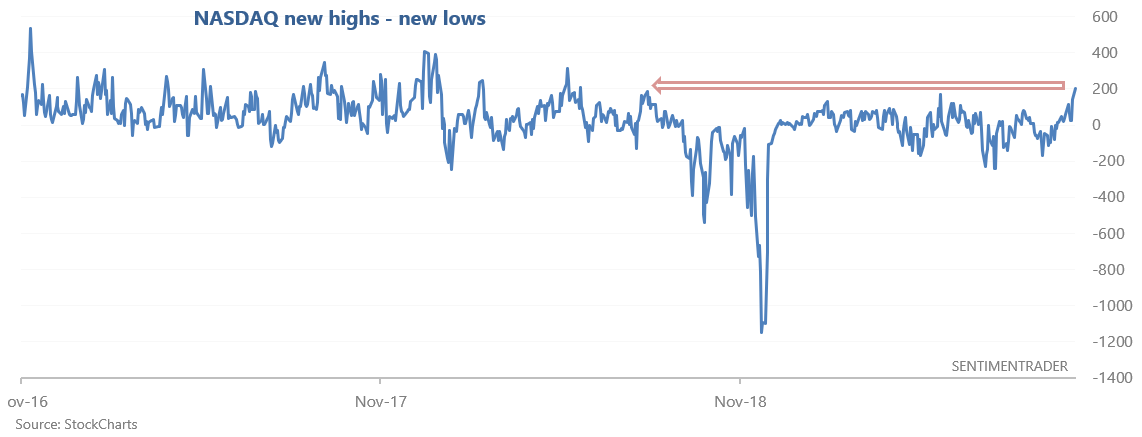
With the NASDAQ Composite making new all-time highs, the number of issues making new 52 week highs - number of issues making new 52 week lows has risen to the highest level in more than 1 year:
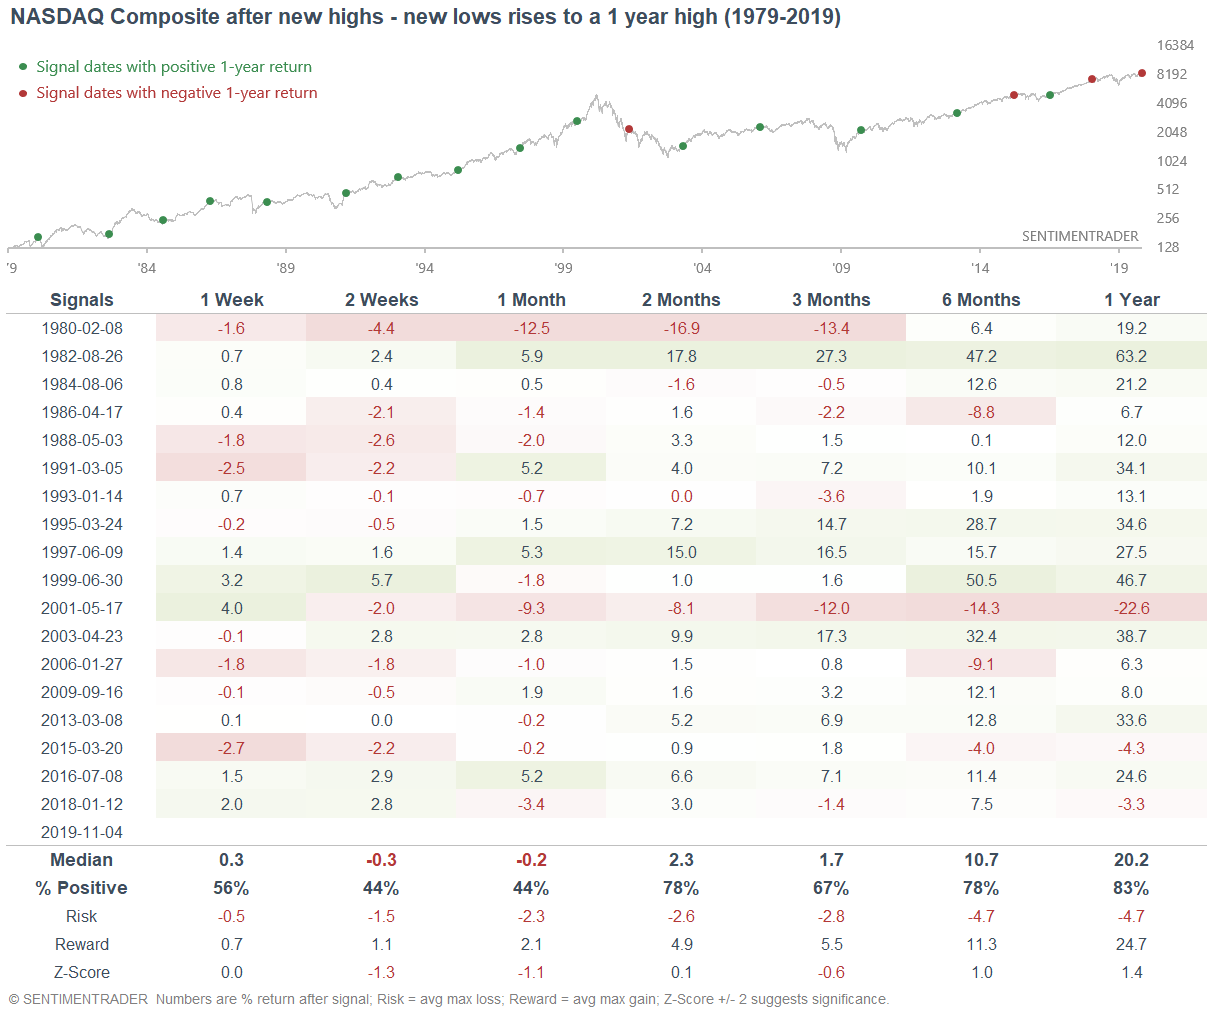
When this happened in the past, the NASDAQ sometimes faced short term weakness, but returns over the next year were mostly bullish. The one big exception was May 2001, but that historical case was far different from today (stocks were already in a deep bear market, economy was already in a recession, etc.):
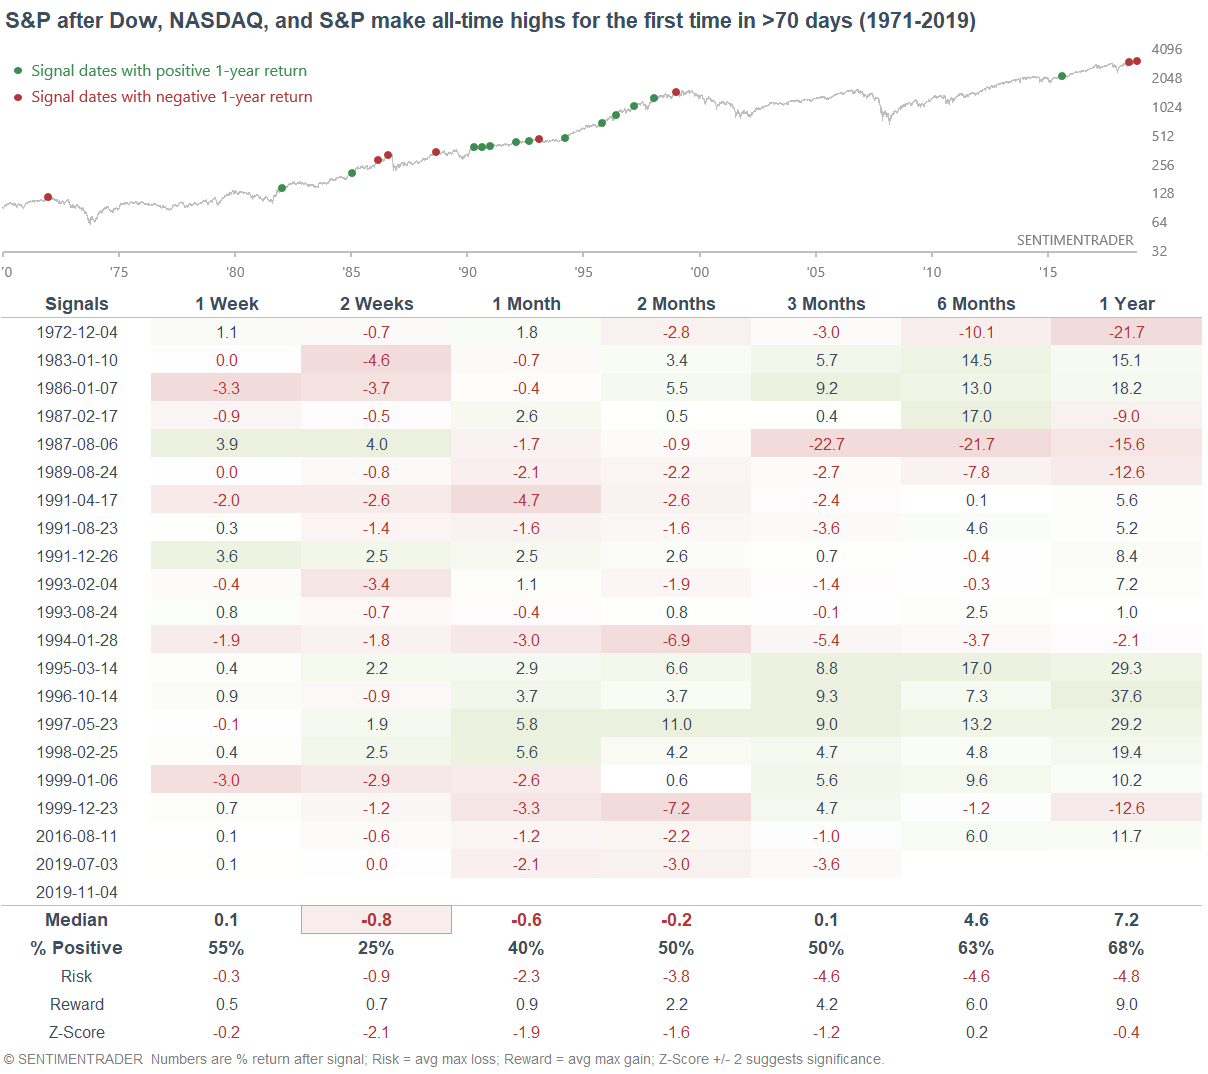
New highs
As Jason mentioned, the Dow, NASDAQ Composite, and S&P 500 are all sitting at all-time highs for the first time in more than 70 days. When this happened in the past, the U.S. stock market (as denoted by the S&P 500 often faced weakness over the next 2 weeks: