What I'm looking at - bullish percent, U.S. recession, historic volatility, historic overseas selling
Here's what I'm looking at:
Bullish Percent Index
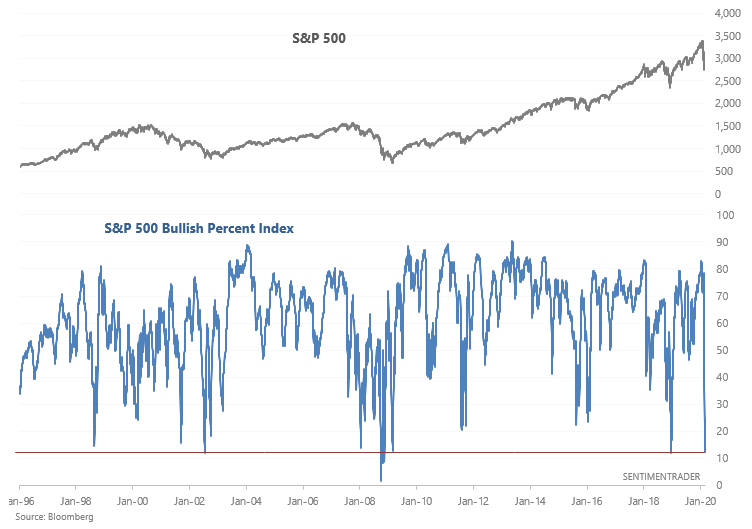
Regardless of how you look at it, the speed of the stock market's recent crash was historic. Even the Q4 2018 crash did not match such speed - that crash took 3 months, whereas the current crash took place in a matter of weeks.
The S&P 500's Bullish Percent Index, a breadth indicator that looks at the % of S&P stocks on point and figure buy signals, has crashed to one of the lowest levels ever:
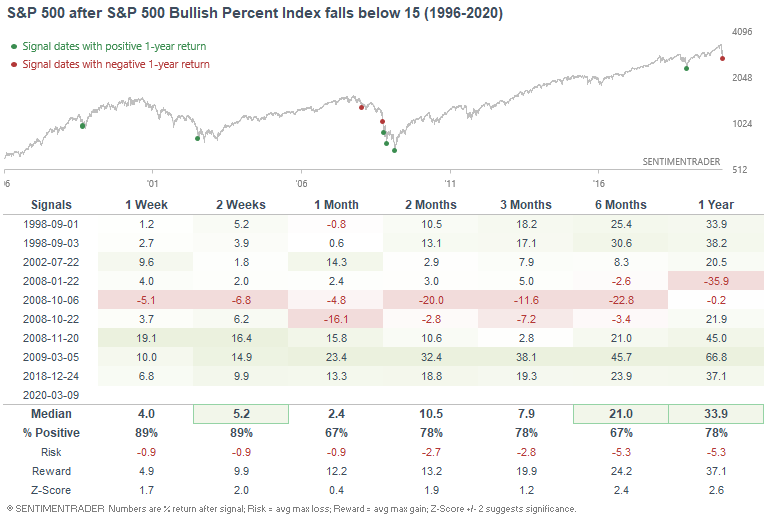
When the Bullish percent Index was this low in the past, the S&P usually bounced over the next few months, with several of those rallies registering large double-digit gains. As usual, the only exceptions occurred during the October 2008 crash:
U.S. Recession
As Bloomberg noted, U.S. recession probabilities are climbing right now. Trying to predict a recession right now is extremely hard, and as my favorite (and most accurate) economist Bill McBride mentioned:
The usual leading indicators are not useful if there is "a pandemic, significant military conflict, disruption of energy supplies for any reason, a major natural disaster (meteor strike, super volcano, etc), and a number of other low probability reasons".
Bill McBride is moving to Recession Watch for the first time in 2006, so the possibility of a recession is certainly something that we need to at least entertain.
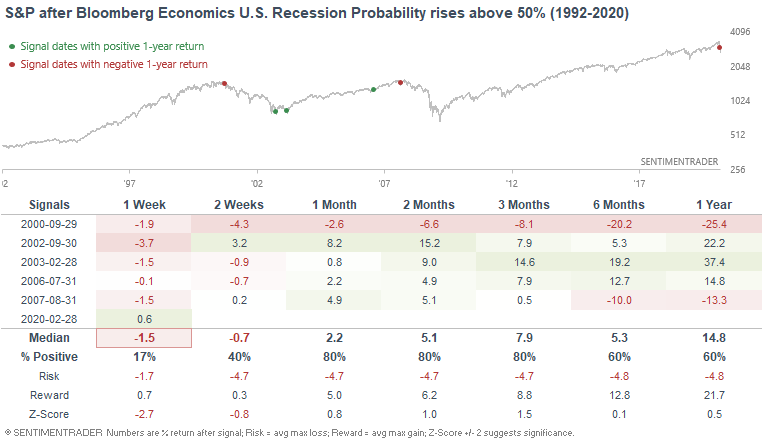
With that being said, here's the Bloomberg Economics Probability of a U.S. Recession:
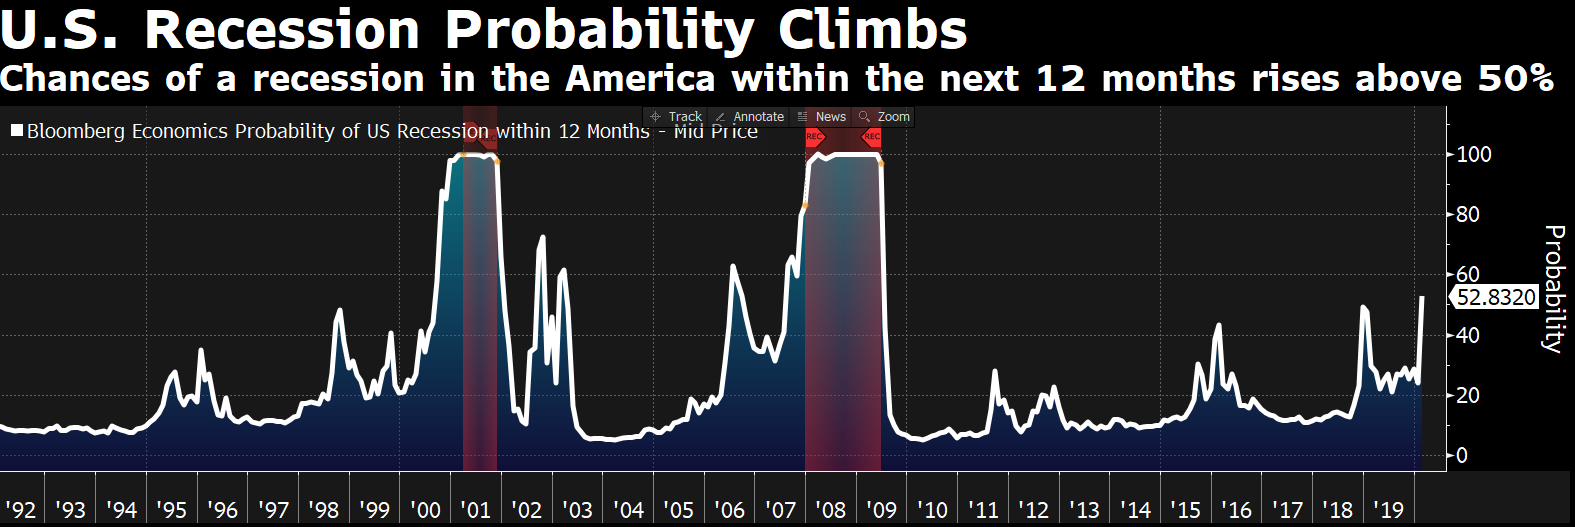
When this figure jumped above 50% in the past, its accuracy as a recession indicator was iffy. It worked very well in 2000 and 2007. But there were also false signals and cases in which this indicator was bearish too early (see July 2006):
I'm usually dismissive of these scares when it comes to the long term impact on equities (remember Ebola?) . But the rate at which cases are increasing outside of China is potentially dangerous to the global economy. If a bear market does occur, the S&P 500 will probably still see a meaningful rally before the market rolls over into a bear market. I'm not saying that this is going to happen, but keep your mind open to all long term possibilities right now and take things day by day.
Historic volatility
The stock market's daily volatility is historic, to say the least. 8 out of the past 12 days have seen the S&P go up or down at least 3%:
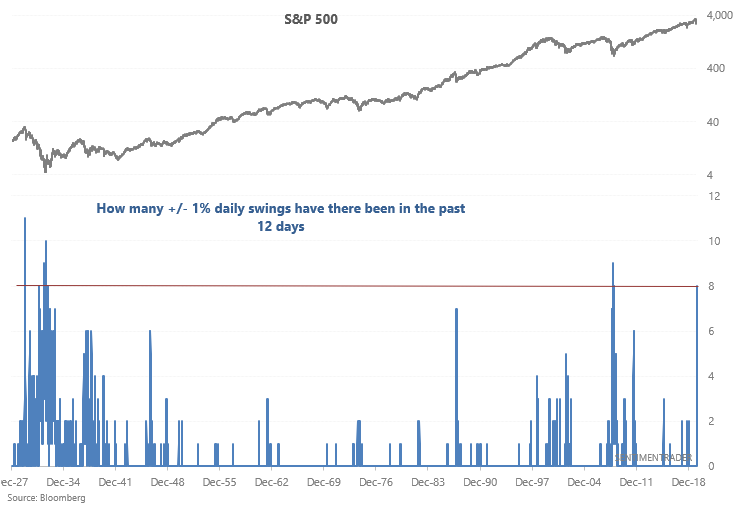
Such volatility has only been matched by the 2008 financial crisis and the 1929-1932 bear market:
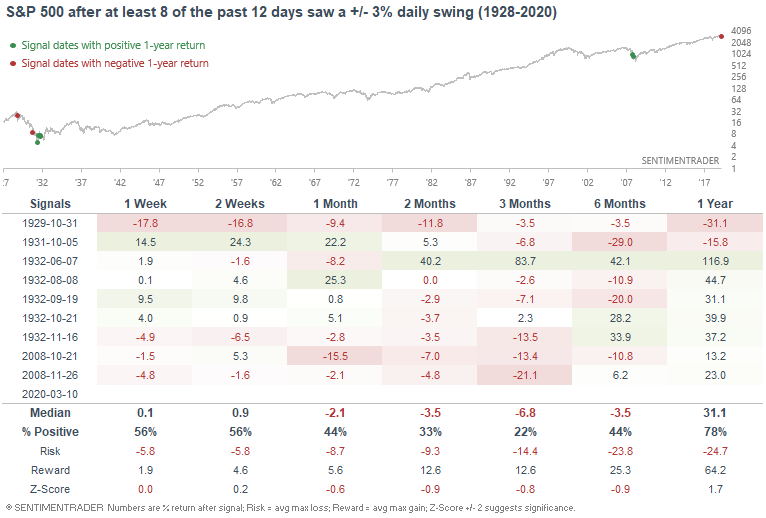
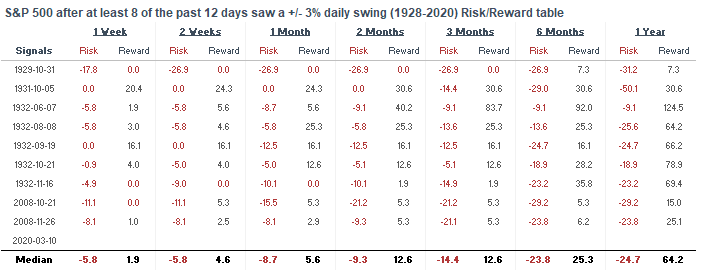
Does this mean that "today is like the 2008 and 1929-1932 bear markets all over again"? Personally, I don't think such comparisons make sense so I wouldn't put too much weight on this stat.
Historic overseas selling
I've written a lot about the U.S. stock market's crash over the past 1-2 weeks, and I'd like to turn my attention to other stock markets around the world.
In Germany, 86% of DAX's members are oversold (14 day RSI < 30):
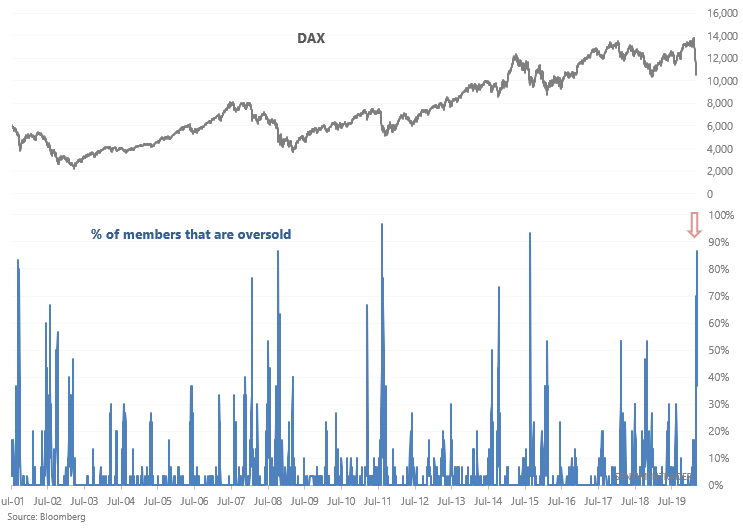
Such extreme selling has only been matched a few other times from 2001-present:
- 9/11
- 2008 financial crisis
- 2011 global stock market crash
- August 2015 global stock market crash
- Now
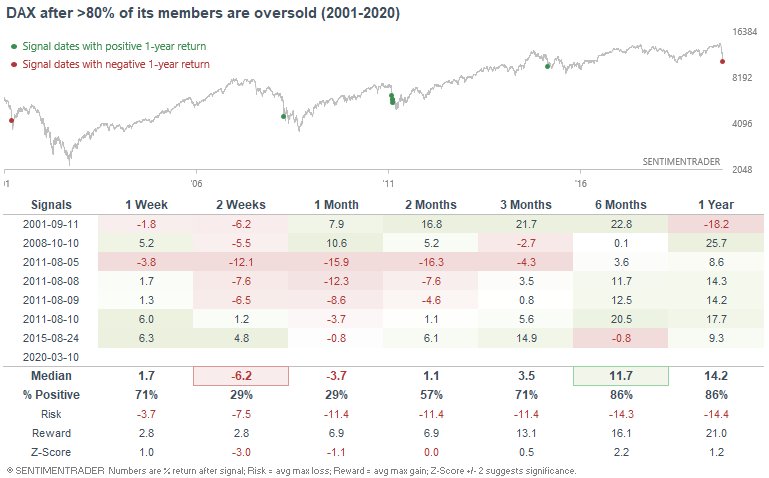
While the DAX could see more short term selling, this was usually followed by a double digit rally sometime over the next 2-6 months.
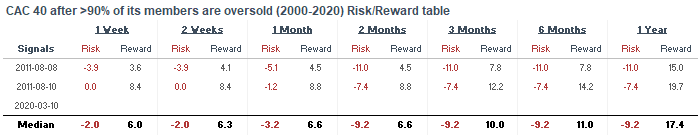
Things are even more extreme in France, where 92% of CAC 40 members are oversold (RSI < 30):
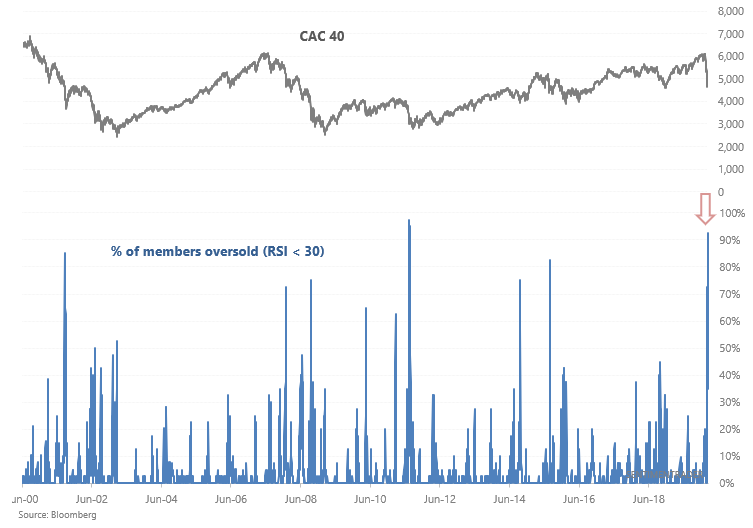
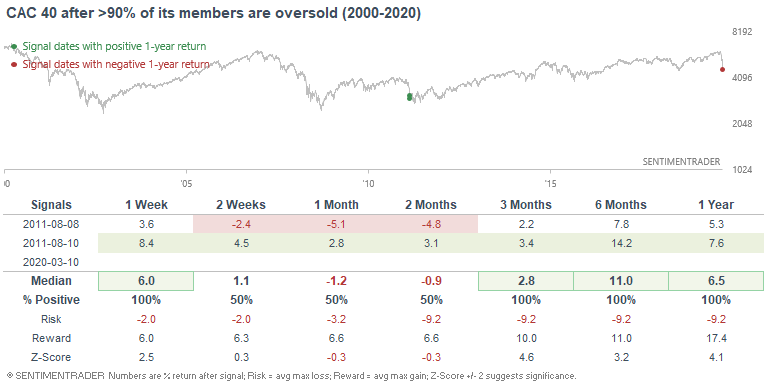
There's only 1 comparable historical case, when the CAC 40 fell a little more (bullish divergence) before bottoming:
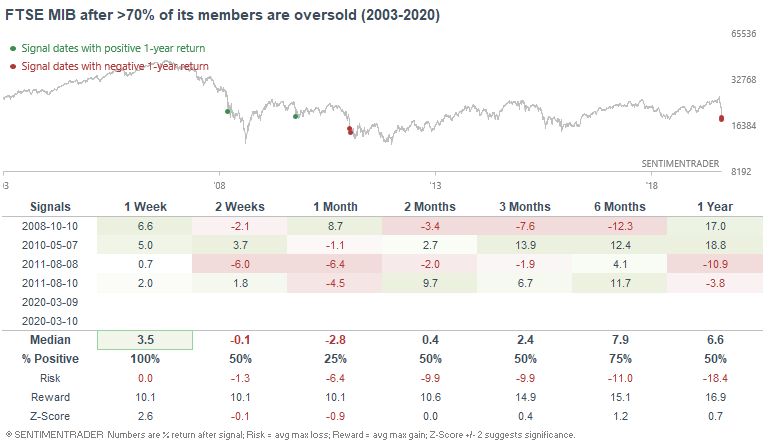
Meanwhile in Italy, a record 95% of FTSE MIB members are oversold:
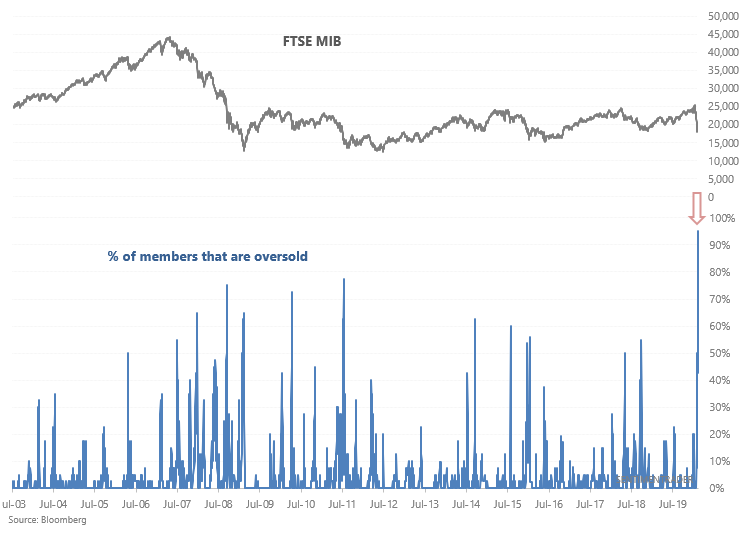
It's hard to imagine a more short term bullish reason for Italian stocks:
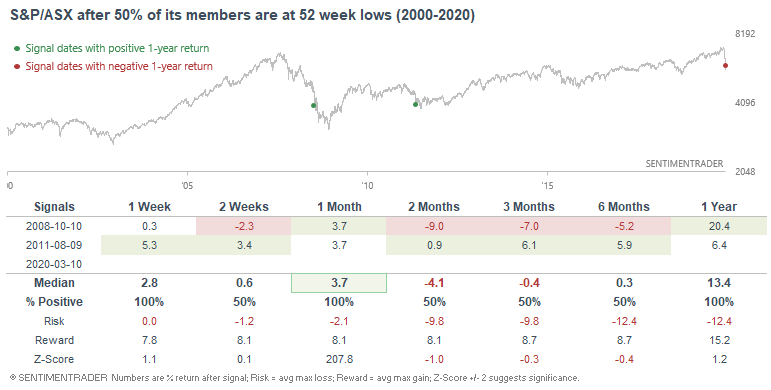
And finally, 50% of Australian equities have hit a 52 week low:
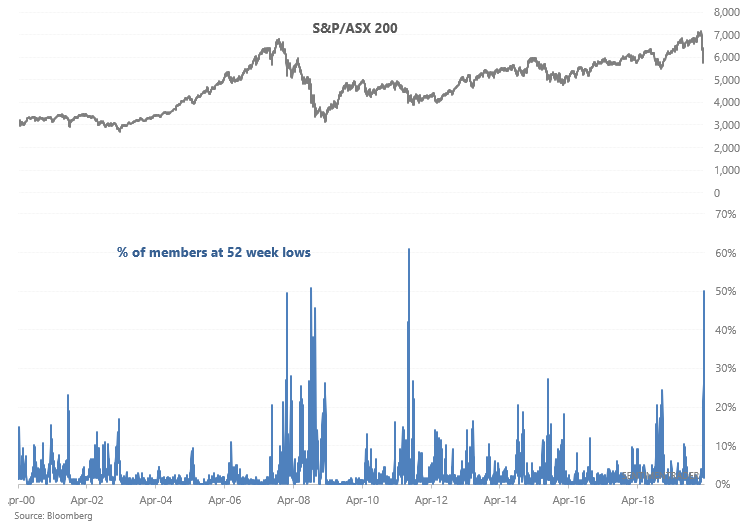
Such widespread selling was only matched twice: once during the 2008 financial crisis and once during the August 2011 global stock market crash. Both cases led to a rally over the next month: