
What I'm looking at - Economic Surprise, low volatility, breadth, McClellan Summation, DAX
The past few days have seen low volatility despite a nonstop stream of things to "worry about". Here's what I'm looking at:
Economic Surprise
Economic data continues to beat analysts' expectations, causing the Citigroup Economic Surprise Index to rise to its highest level since early-2018. This is moreso due to analysts' depressed expectations than due to terrific economic data.
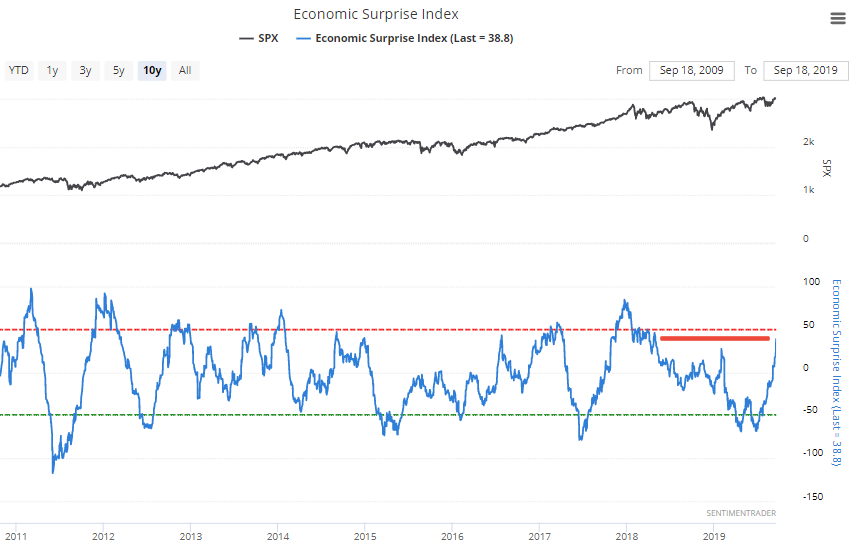
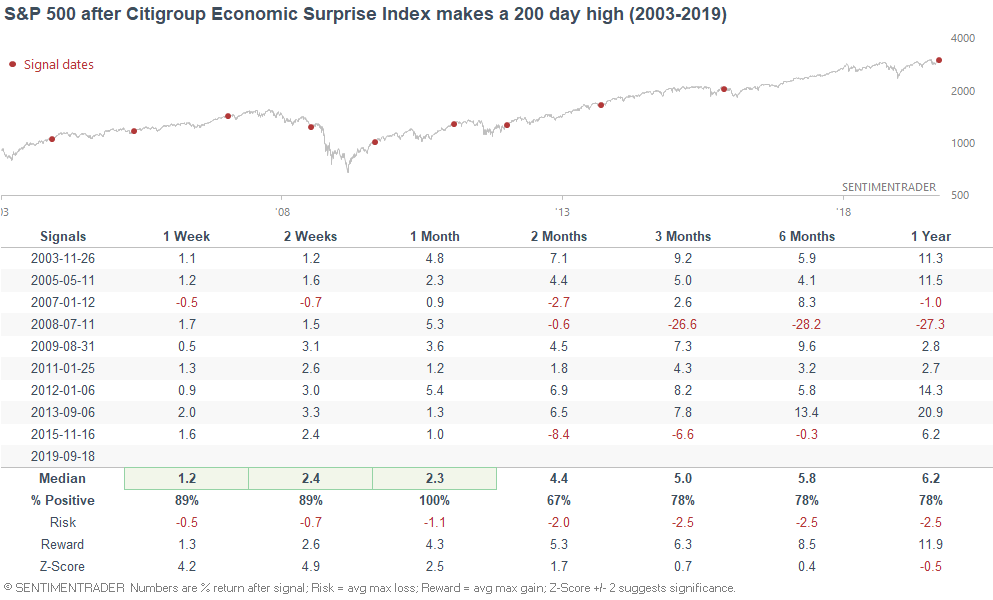
When the Economic Surprise Index rose to its highest level in 200 days in the past, the S&P usually did well over the next month:
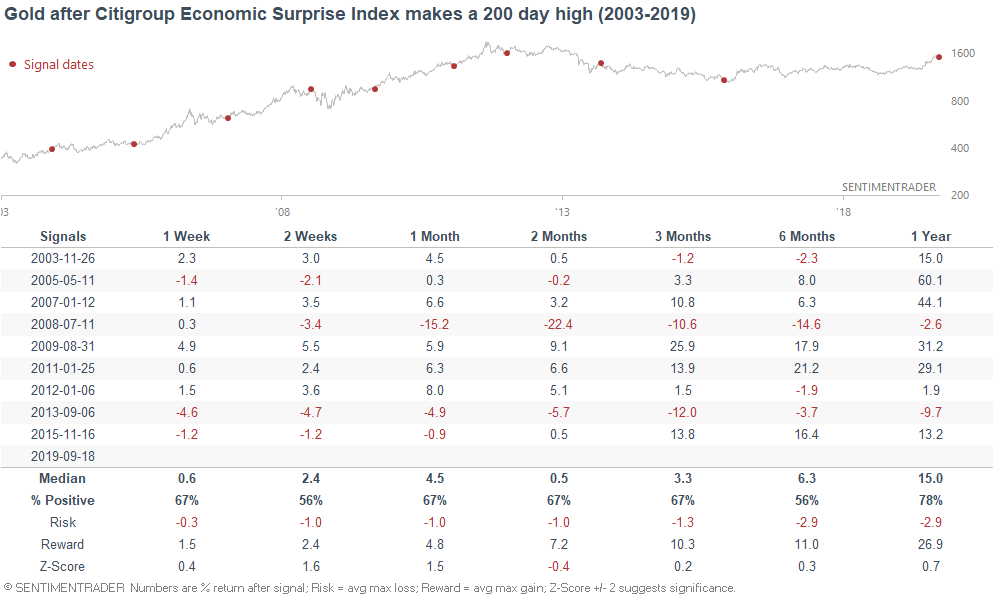
This wasn't quite consistently bullish or bearish for gold...
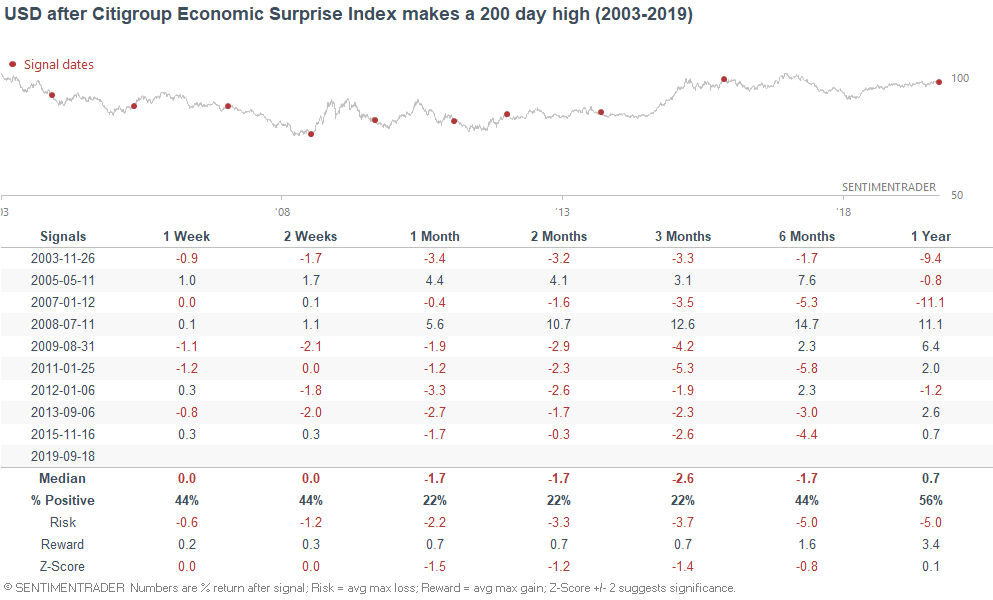
But was mostly bearish for the U.S. Dollar over the next 1-3 months:
Low volatility in September?
When September began, many market watchers noted that the stock market tends to perform poorly in September (seasonality). I said that while this is true, seasonality factors should be of tertiary importance because:
- Seasonality edges are not usually particularly strong.
- Strong seasonality "edges" may occur merely due to chance (in a universe with enough #'s, there are bound to be patterns that exist for no reason other than random chance).
- Seasonality changes throughout the decades.
While September is "supposed" to be volatile, the past 2 weeks have been anything but volatile.
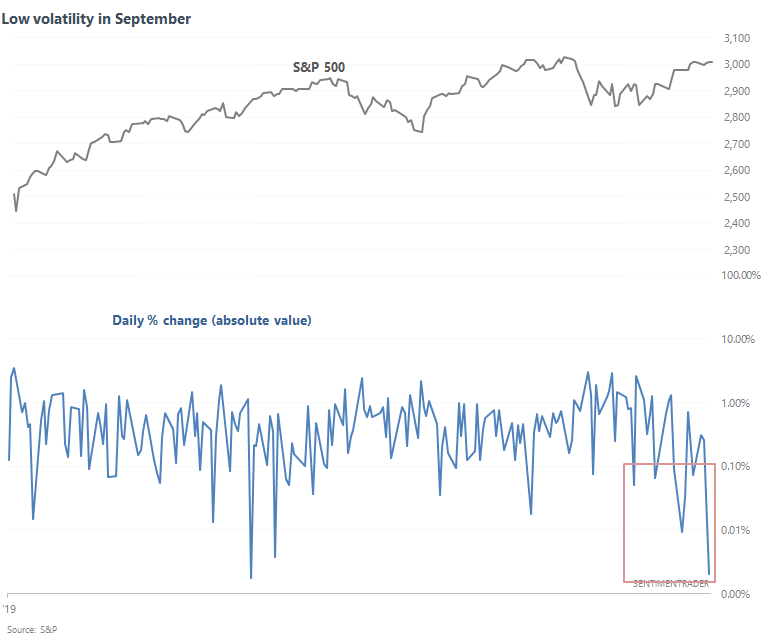
6 of the past 10 days have seen daily swings (absolute value) of less than 0.1% from the previous day's close.
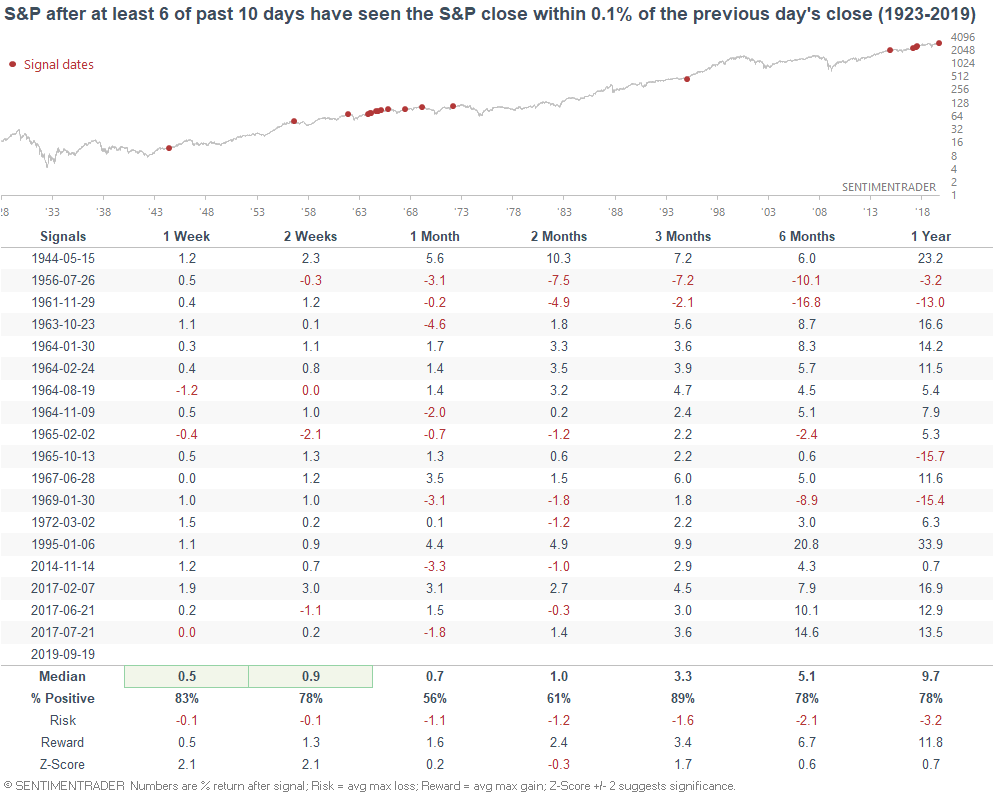
Under a low volatility scenario, the S&P tends to rally over the next 1-2 weeks. What's also interesting is that this didn't happen in September before. Seasonality works until it doesn't.
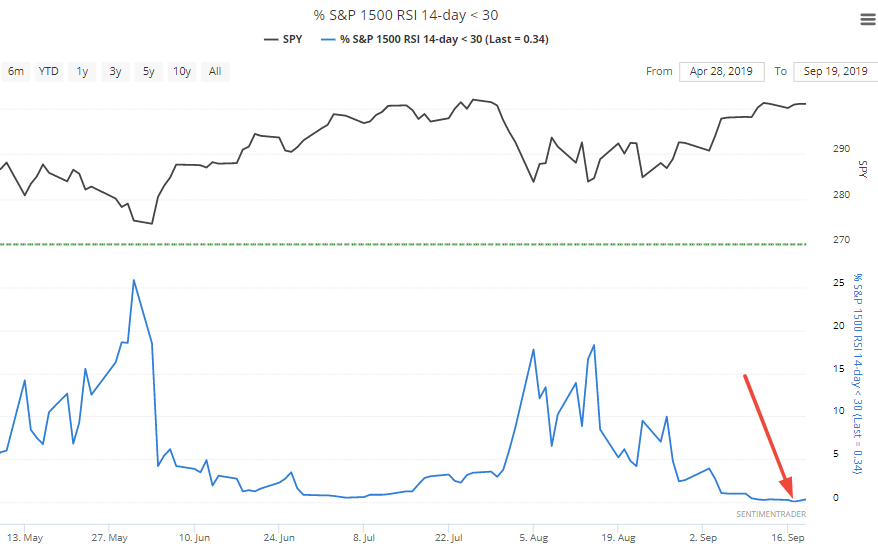
Breadth
With the U.S. stock market near an all-time high, few stocks are trending downwards (i.e. oversold). As of Tuesday, the % of S&P 1500 stocks whose 14 day RSI is below 30 fell below 0.1%
When this happened in the past, the S&P often did well over the next 2 months.
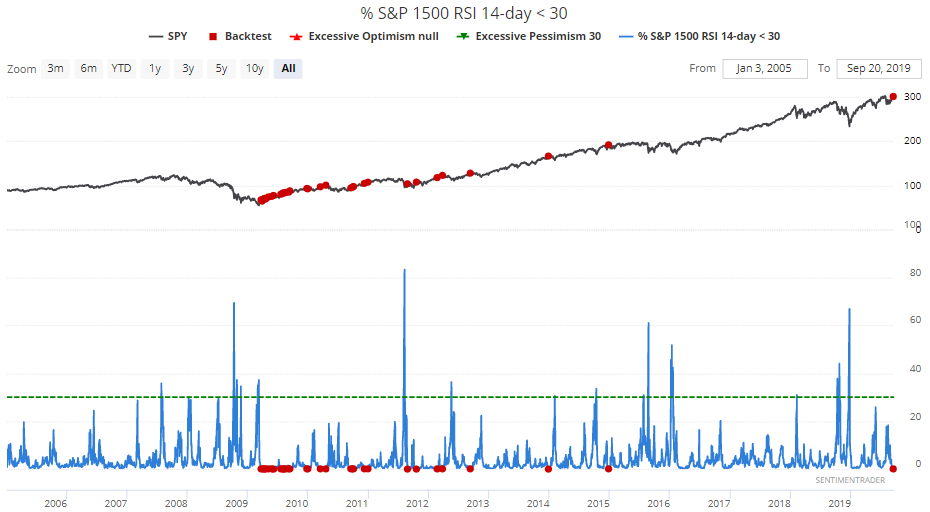
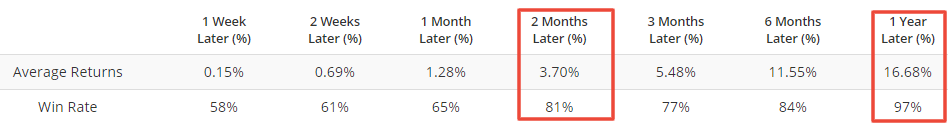
The 1 year forward returns were also exceptionally bullish, but that's because all of the historical cases occurred in this bull market. So I would mostly ignore the 1 year forward returns.
McClellan Summation Index
The McClellan Summation Index - a long term look at the momentum of the market's breadth - has been positive for 169 days. And with the McClellan Summation Index at 760 right now (solidly above zero), this streak is unlikely to end anytime soon.
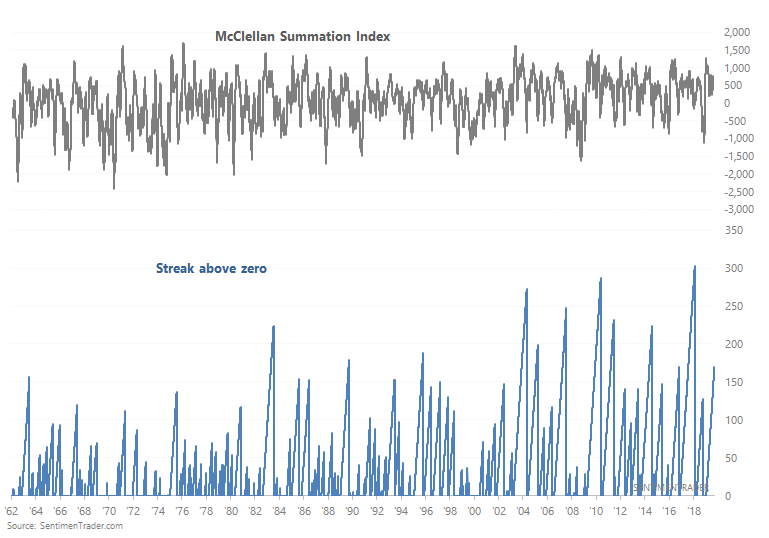
Such long streaks tend to occur when it has been a long time since the stock market made a sustained correction. And that's exactly what we've experienced so far in 2019. Whenever the stock market starts to fall (and the McClellan Summation starts to fall), the stock market quickly reverses higher towards new highs, thereby pushing the McClellan Summation Index up again.
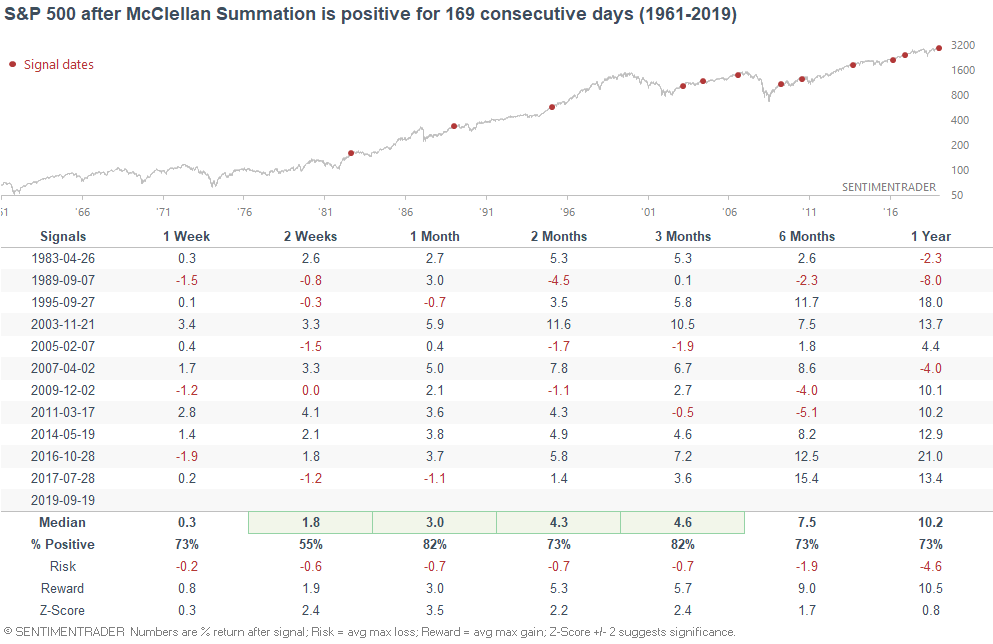
Anyways, these long streaks of positive breadth were mostly bullish for stocks over the next few weeks and months.
DAX
And lastly, DAX's monthly MACD histogram is about to turn positive as long as DAX doesn't fall significantly during the rest of September.
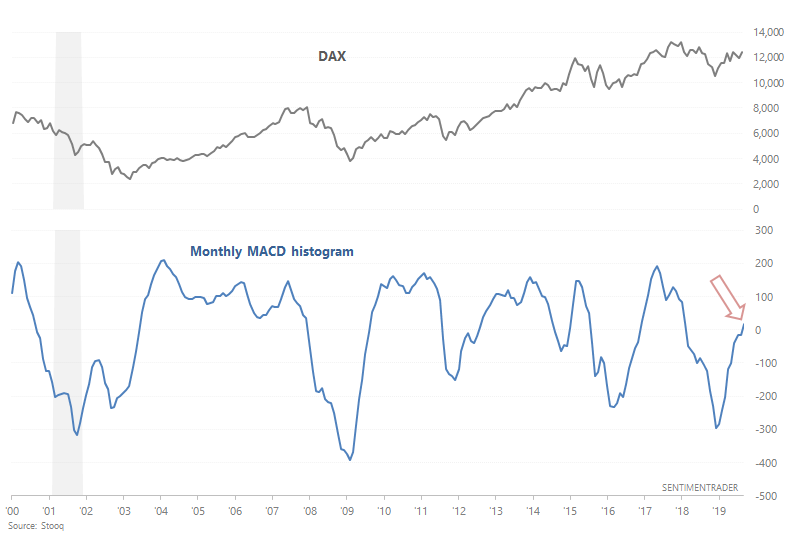
It's commonly believed that MACD crosses (when the histogram crosses above zero) are bullish for the market. And this is mostly true for the S&P 500. But what about for the DAX? The following chart looks at what happened next to the DAX when its monthly MACD histogram turns positive for the first time in 1 year.
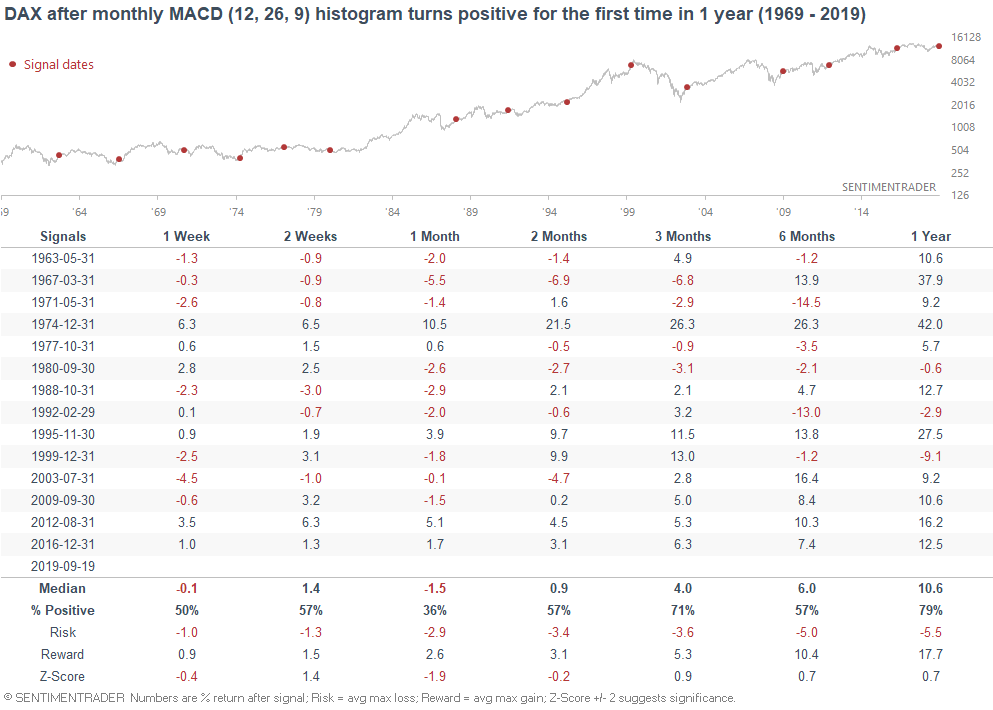
We can see an interesting phenomenon here. This was mostly bullish for the DAX over the next 3 months from the 1980s-present. But before that, it wasn't consistently bullish for the DAX. This is because MACD crosses are essentially trend following indicators. And long term trend following indicators don't work well when the market is swinging sideways for a long period of time, as the German stock market did from the 1960s-1970s. This is why I prefer to combine fundamentals with technicals. The same technical signal under different macro conditions can produce different results.
Conclusion
From my weekend market overview:
- Long term risk:reward doesn’t favor bulls. Valuations are high, but valuations can remain high for years.
- Fundamentals (6-12 months): still bullish because there is no significant U.S. macro deterioration, but this could change IF macro data deteriorates significantly over the next few months
- Technicals (3-6 months): mostly bullish
- Technicals (1-2 months): no clear edge in either direction