What I'm looking at - ex-U.S. stocks, NYSE Up Issues, Economic Surprise, more overseas breadth
Here's what I'm looking at:
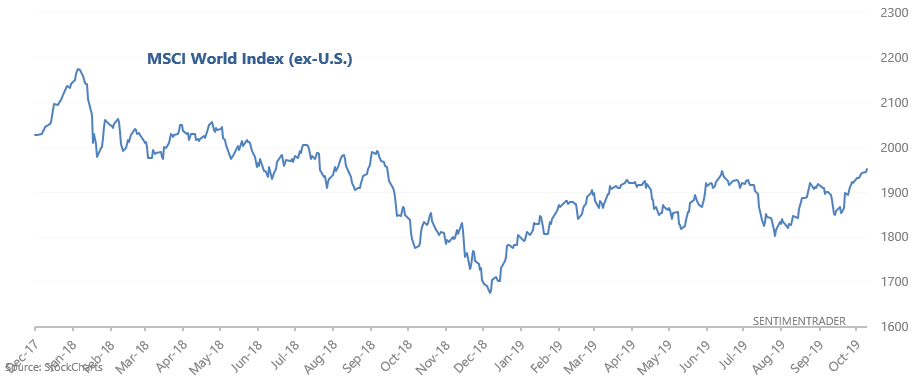
MSCI World Index
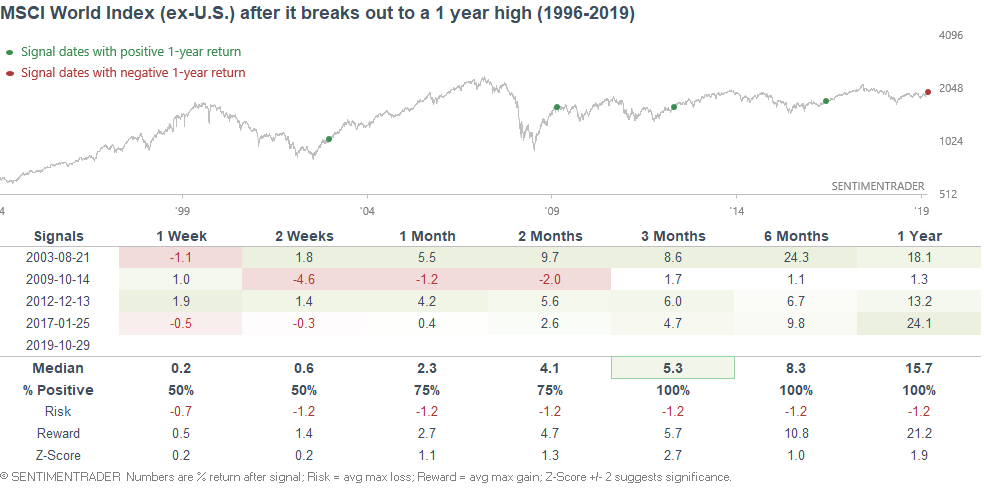
The MSCI World Index (ex-U.S.) broke out to a new 1 year high:
The 4 other times it broke out to a 1 year high for the first time in >1 year, the MSCI World Index surged over the next 6-12 months:
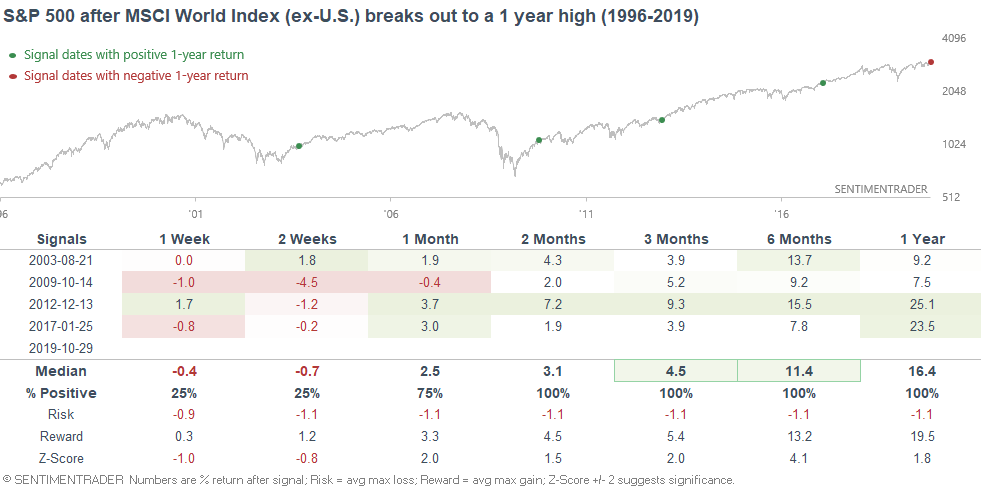
The S&P also surged:
NYSE Up Issues
While the stock market has slowly grinded higher over the past few weeks, daily breadth has been unspectacular. There has yet to be a day in which most issues went up (or a day in which most issues went down). Is this typical for a market that's about to break out?
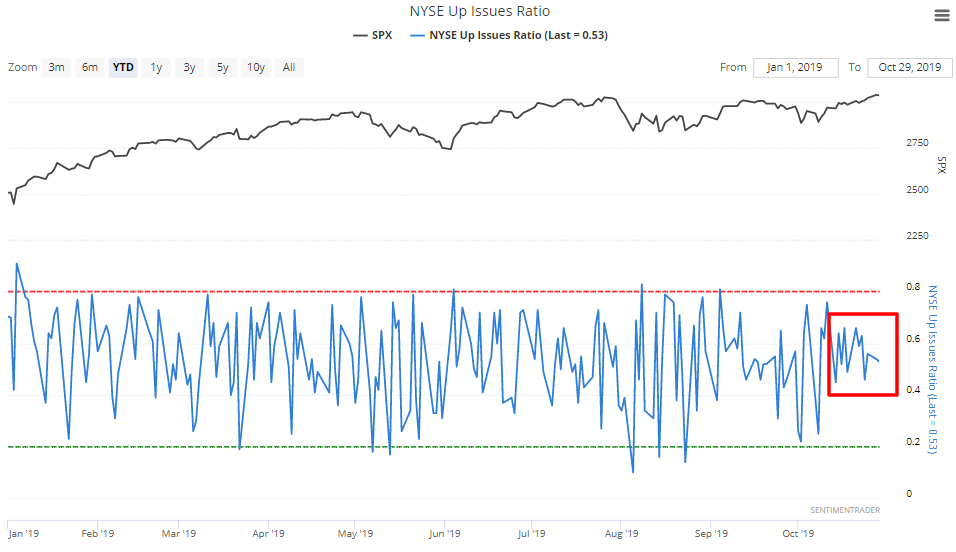
The following table looks at every case in which NYSE Up Issues swung between 0.45 and 0.66 for 12 days. Interestingly enough, almost all of these cases occurred while the S&P was within 1-2% of a 1 year high.
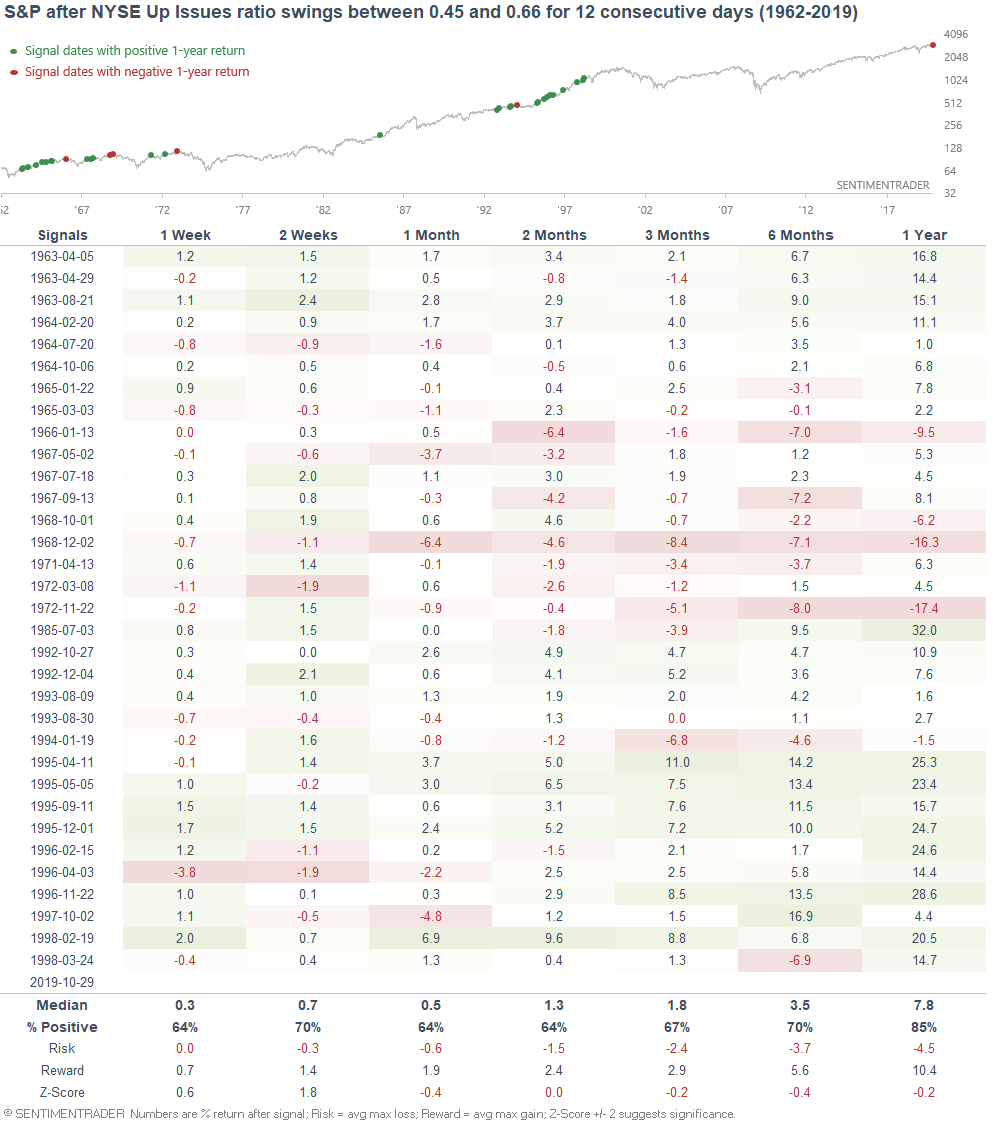
As you can see, the S&P's returns over the next 2 weeks are more bullish than random.
Citigroup Economic Surprise Index
The Citigroup Economic Surprise Index was consistently low from March-August (one of the longest sub-zero streaks), and then finally rose above zero in September. After a brief surge, the Economic Surprise Index is once again on the verge of turning negative.
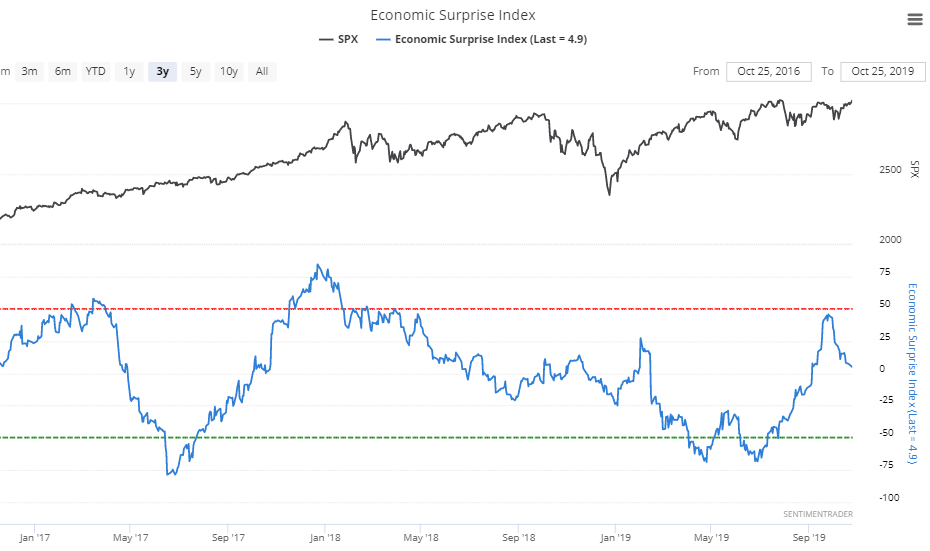
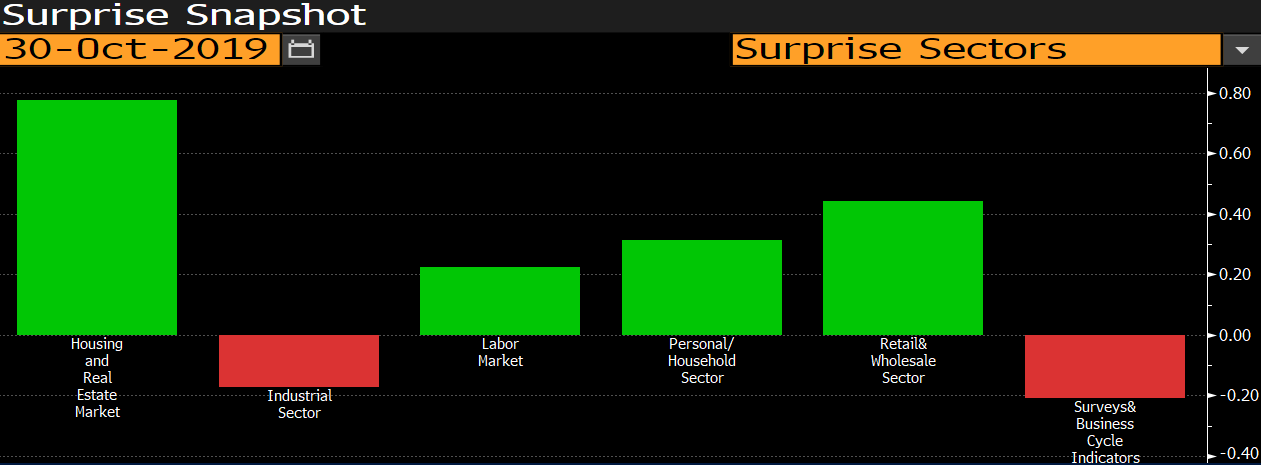
Overall, this has been a rapid roundtrip, with surveys and manufacturing-related data still leading the way down. From Bloomberg:
Is such a rapid drop in the Economic Surprise Index bearish for stocks? The following table looks at every case in which the Economic Surprise Index dropped from more than 40 to less than 2 in under 1 month, while spending less than 2 months above zero.
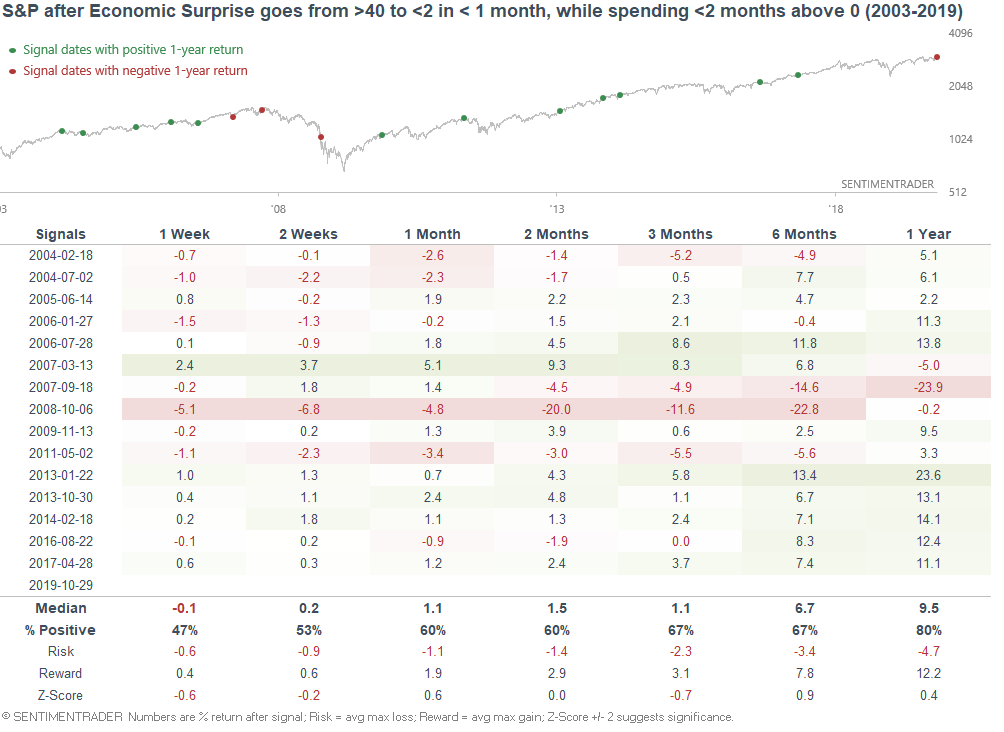
As you can see, this was not a consistently bearish factor for the stock market.
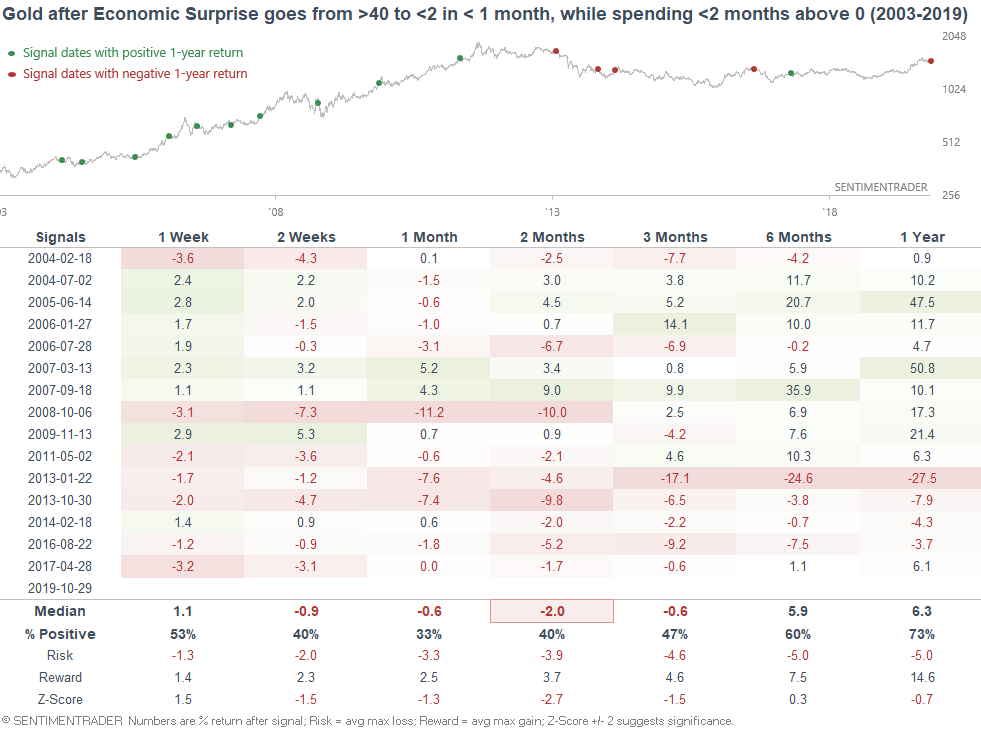
However, it was a bearish factor for gold over the next 1-2 months:
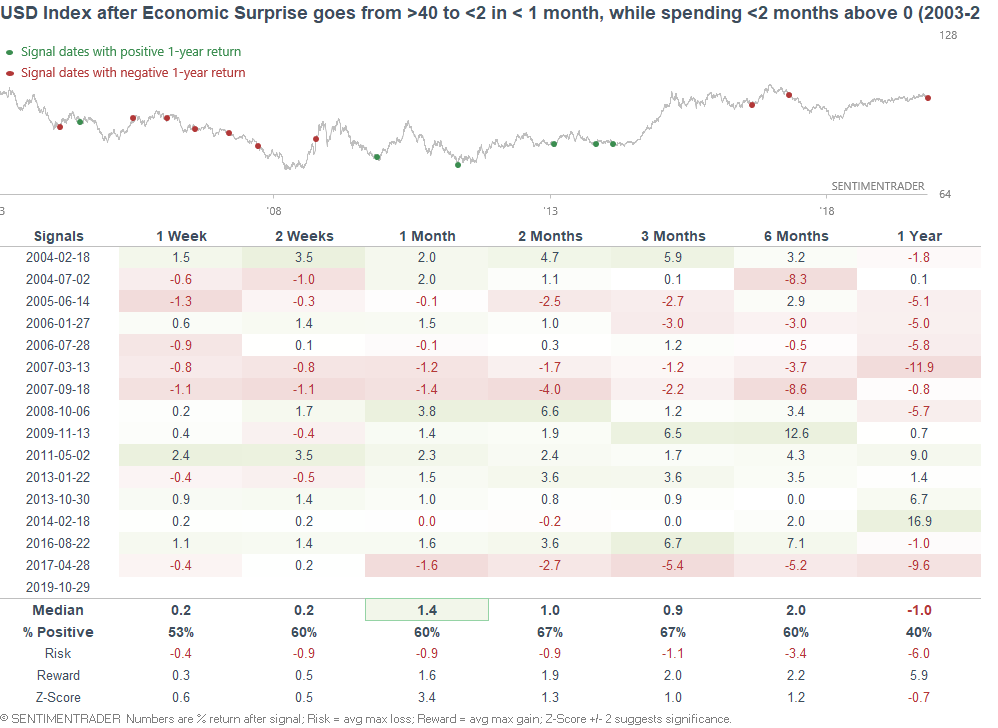
And it was more bullish than random for the USD Index over the next month:
More overseas breadth
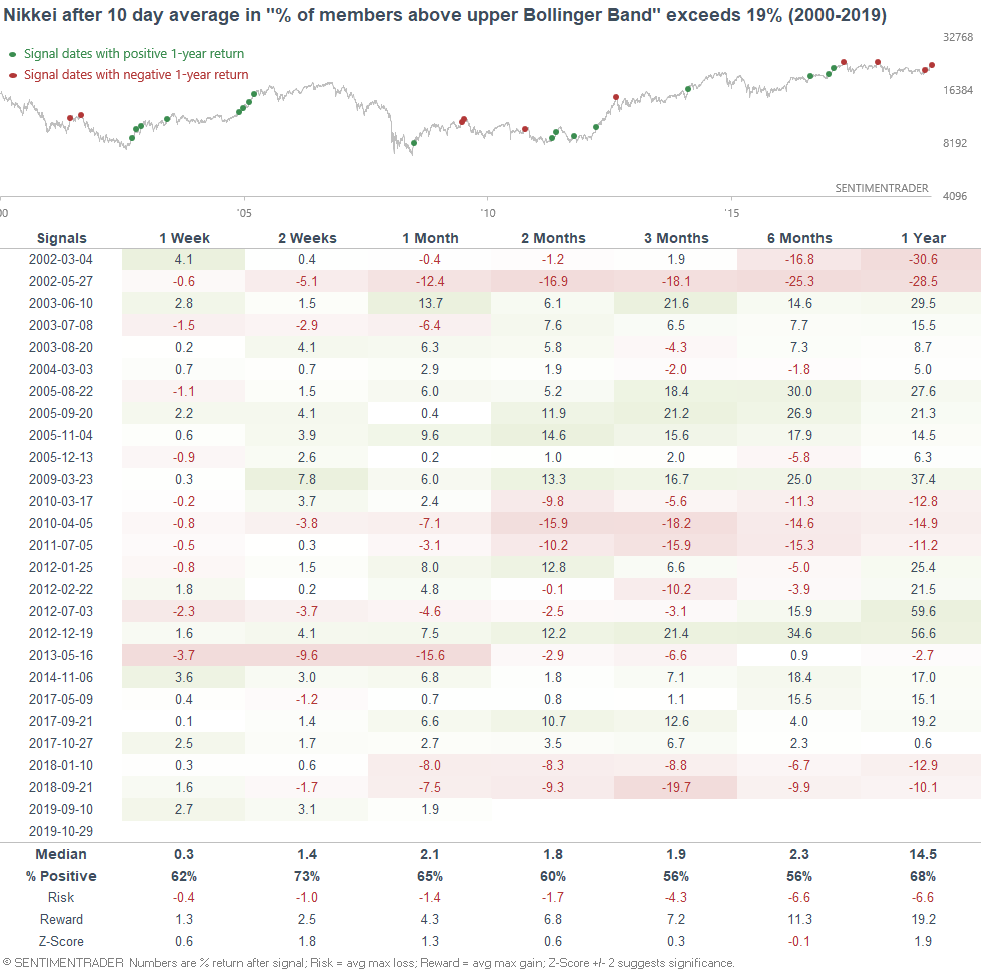
Continuing with our theme of global breakouts, the Nikkei 225 continues to surge, causing the % of members above their upper Bollinger Band to remain consistently high:
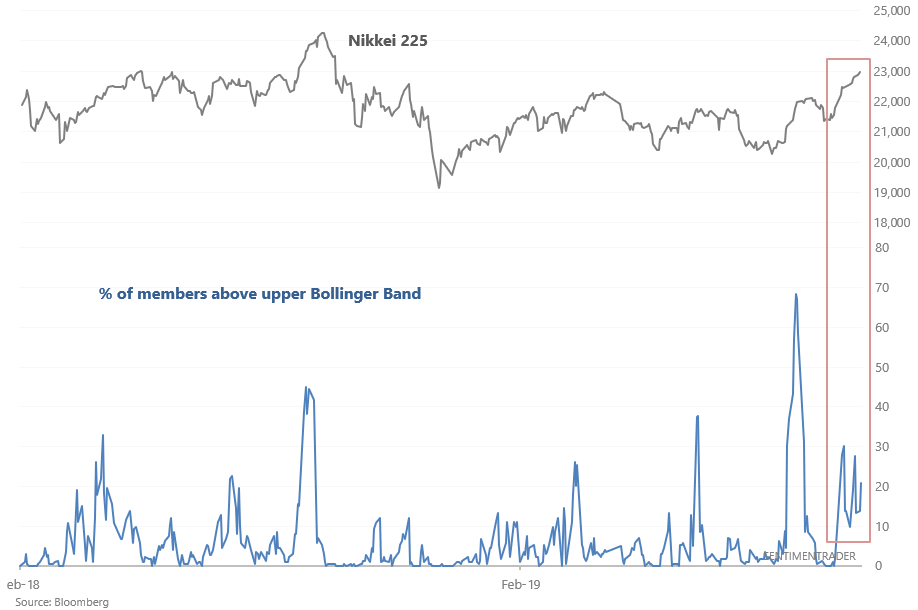
This has pushed the 10 day average of this breadth figure above 19%. When it was this high in the past, the Nikkei typically continued to rally over the next 2 weeks: