
What I'm looking at - Fear/Greed, Down Volume, Arms Index, directionless S&P, HiLo Logic Index
Stocks continue to gyrate on on U.S.-China news. Here's what I'm looking at:
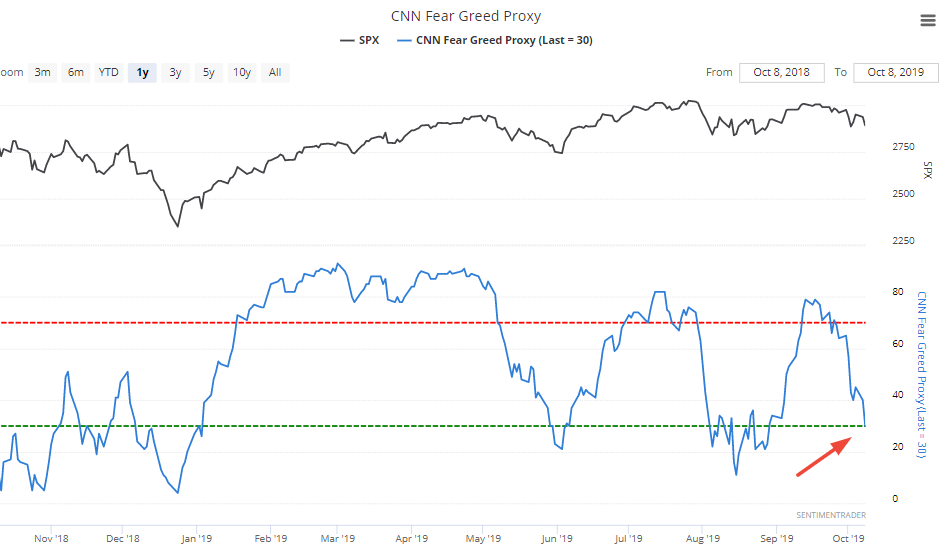
CNN Fear/Greed
With stocks falling right now, our CNN Fear/Greed Proxy has fallen to 30:
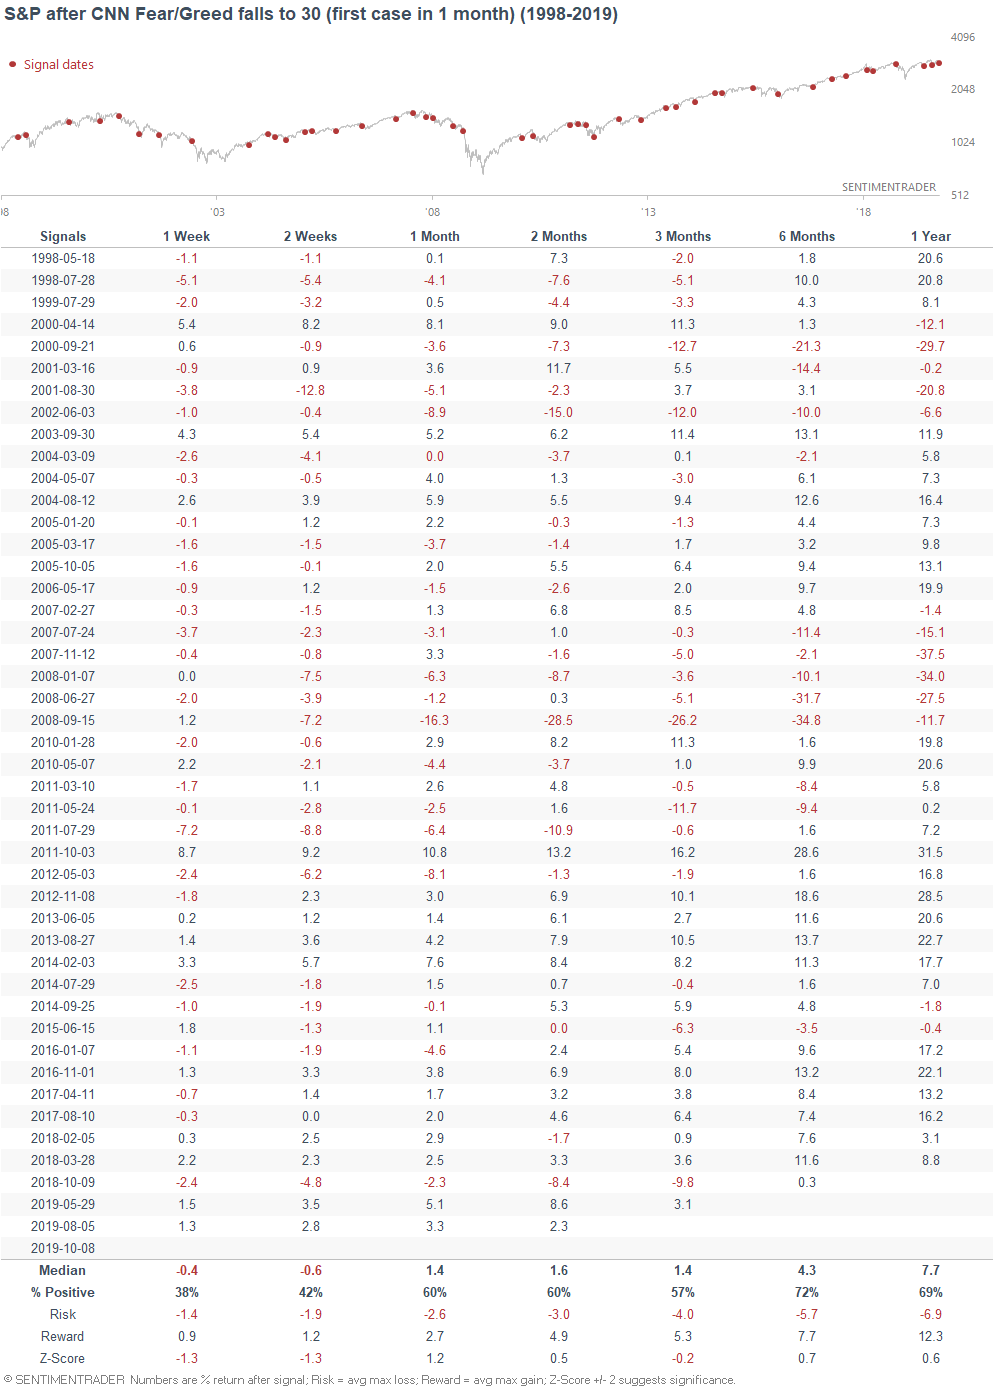
While it's tempting to think of this immediately as a bullish sign for stocks, it isn't. When Fear/Greed first hits 30, the stock market can continue to fall over the next 1-2 weeks, after which it rebounds:
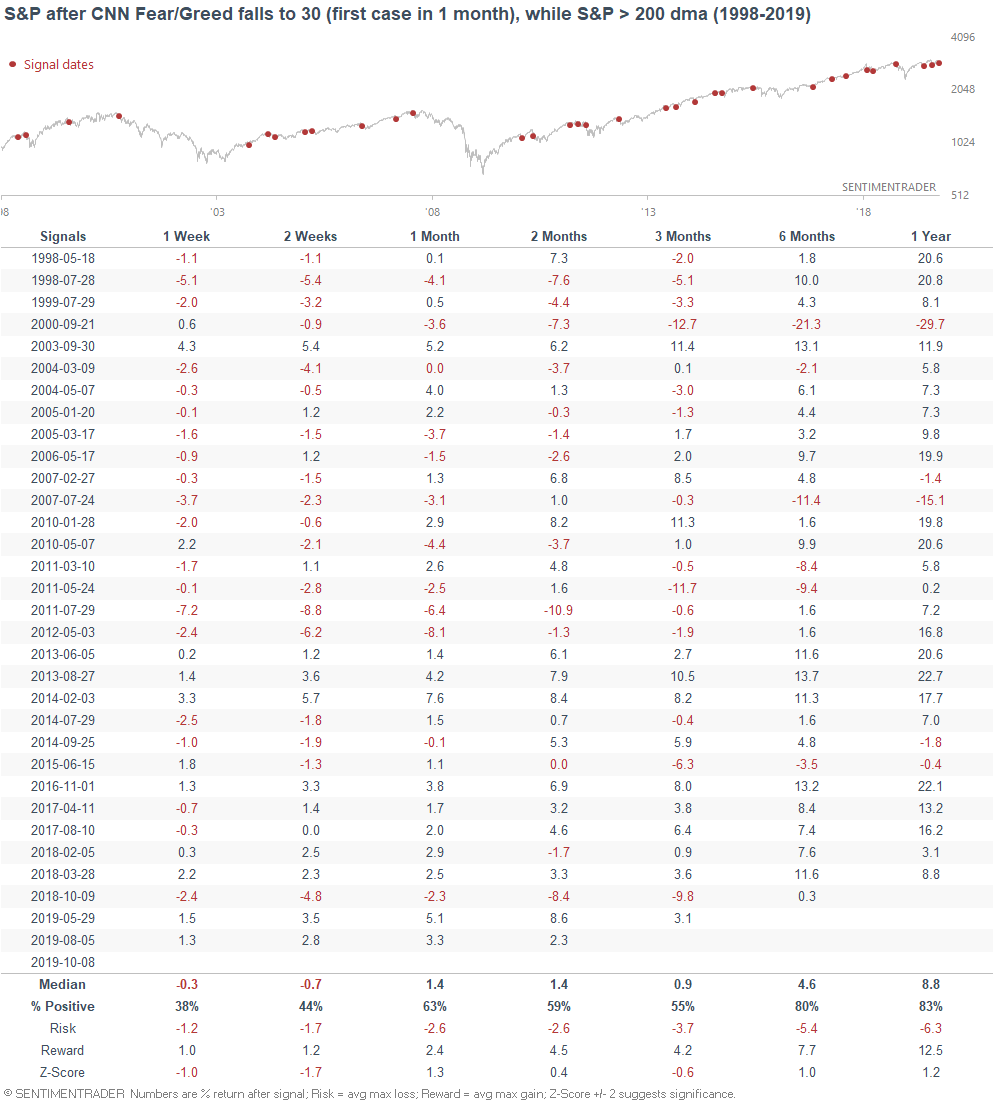
Even if we isolate for cases that occurred while the S&P was above its 200 dma, we get the same results. The S&P tends to fall more first before it can rally:
This is not extreme fear.
Down Volume
As the stock market continues to whipsaw on the latest trade news, 4 of the past 11 days have seen heavy volume in issues that went down:
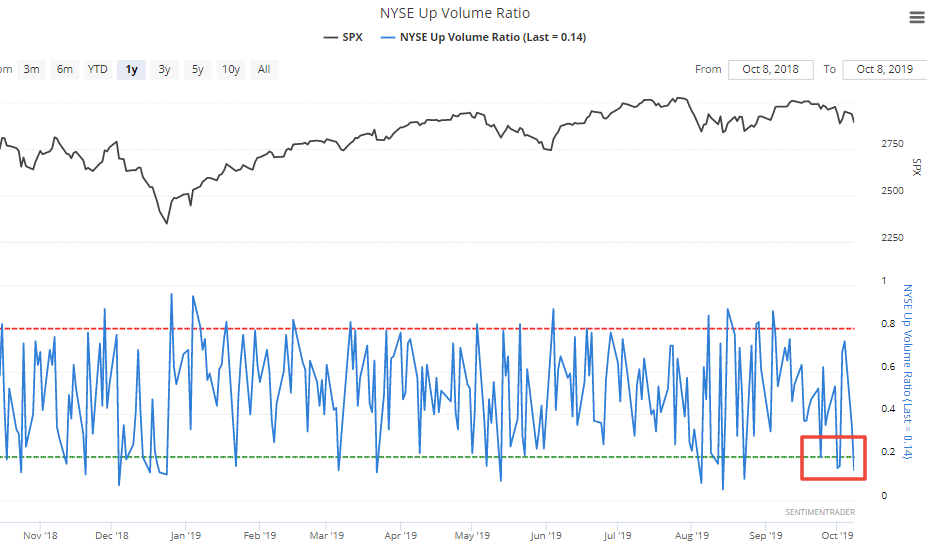
This is quite rare when the S&P is so close to a 1 year high.
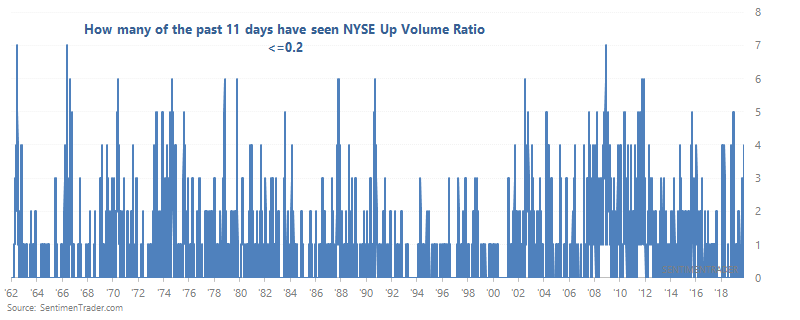
Here's what happened next to the S&P when at least 4 of the past 11 days have saw the NYSE Up Volume Ratio <=0.2, while the S&P is within 5% of a 1 year high:
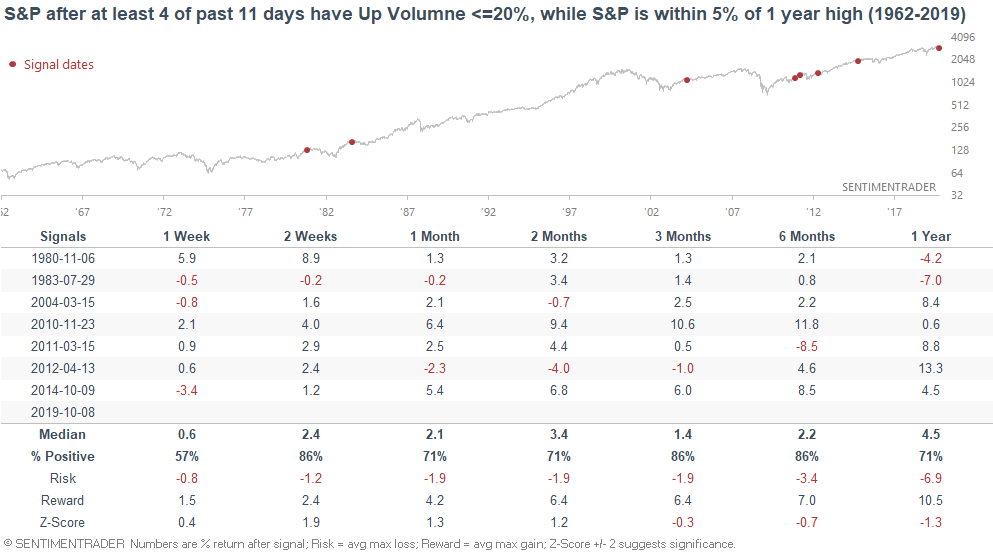
The S&P's 2 week forward returns are mostly bullish. If we relax the study's parameters to look at cases which occurred while the S&P was within 10% of a 1 year high...
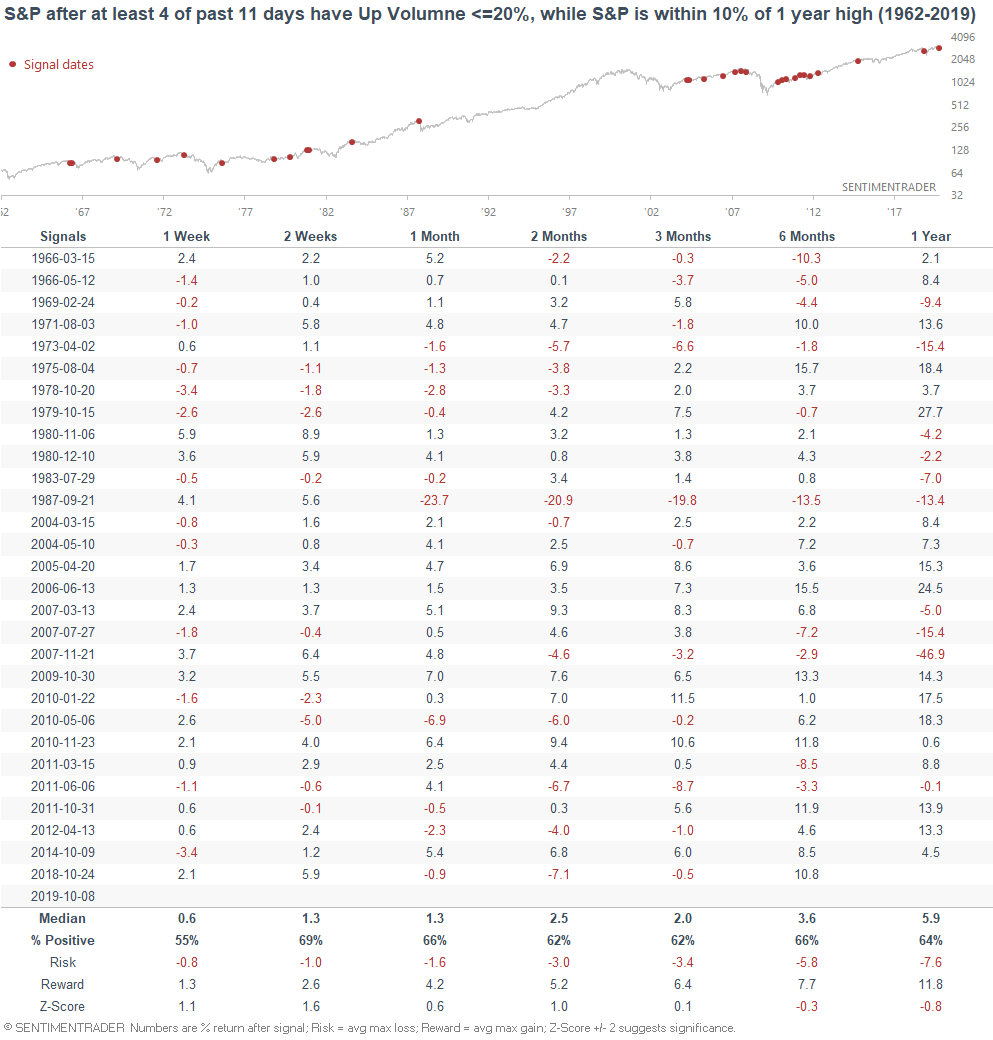
... the S&P's returns over the next 2 weeks are less bullish, but still more bullish than random.
Notice how this stands in direct contrast with the previous stat using CNN's Fear/Greed. This illustrates the key issue with short term trading - the shorter the time frame, the more random the price action. When you add up all the bullish factors + all the bearish factors, it's usually hard to get any clear signal on a 1-2 week time frame.
Arms Index
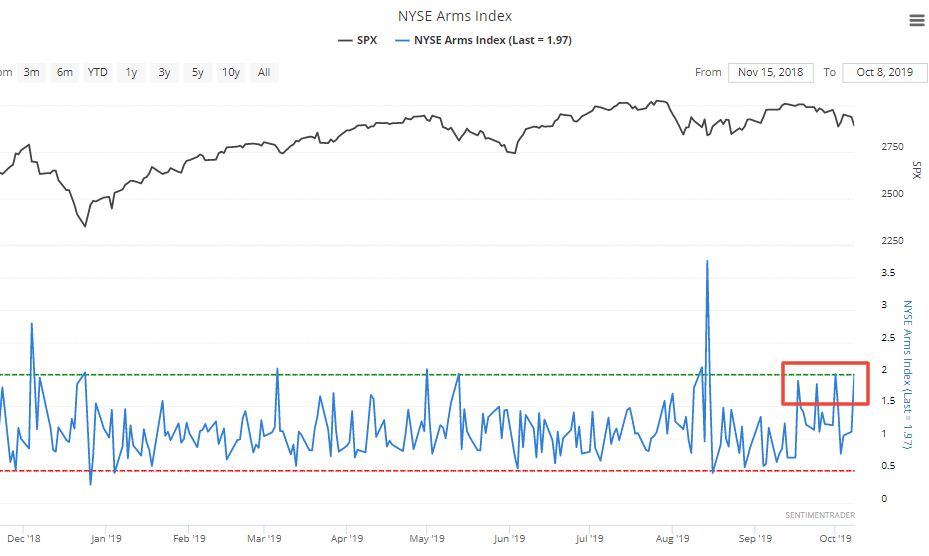
The NYSE Arms Index spiked again yesterday, demonstrating strong selling pressure. This is the 4th spike in the past 16 days.
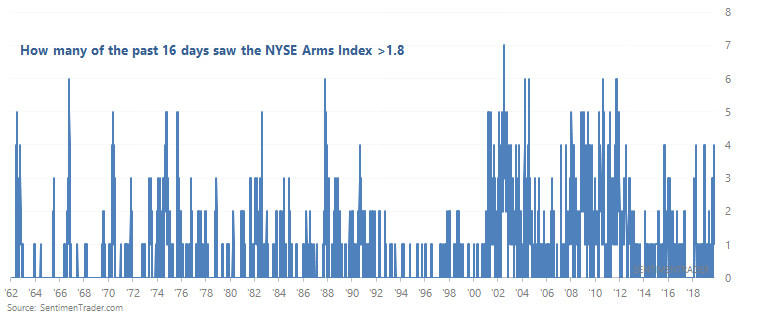
When the Arms Index spiked multiple times in a short span, the S&P's historical returns over the next 2-6 months were more bullish than random:
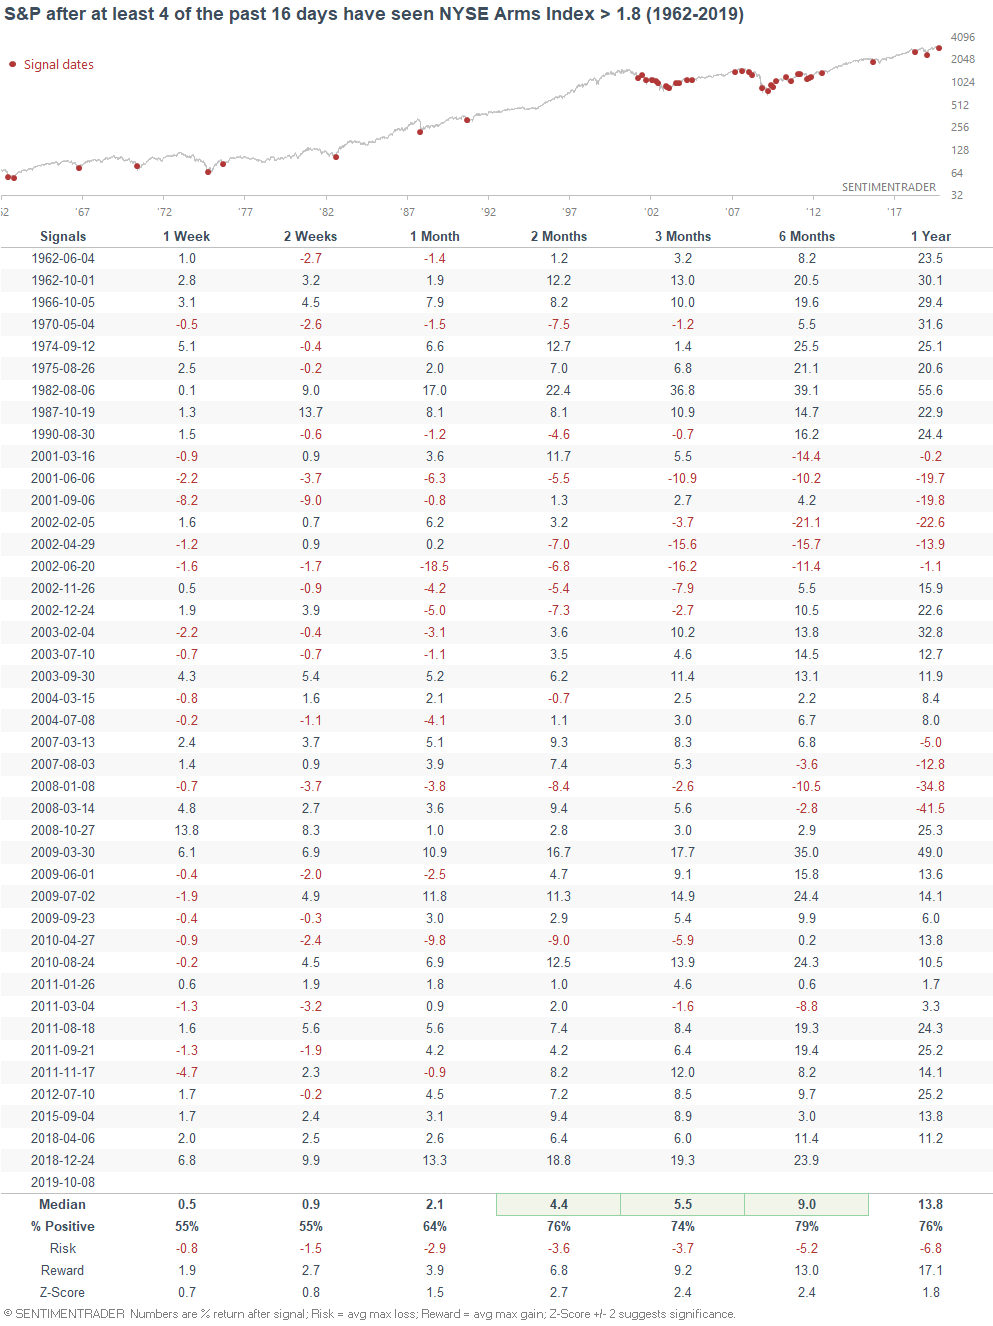
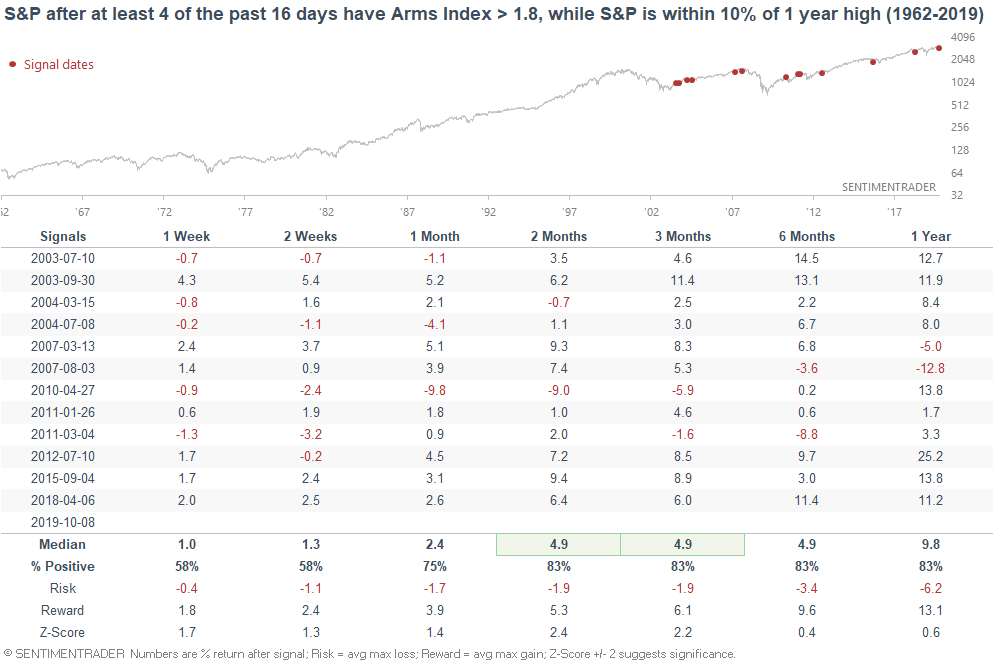
As you can see, most of the bearish cases occurred from 2001-2002 and 2008, when the stock market was in a clear downtrend. If you isolate for the cases that occurred while the S&P was within 10% of a 1 year high, the S&P's forward returns become more bullish:
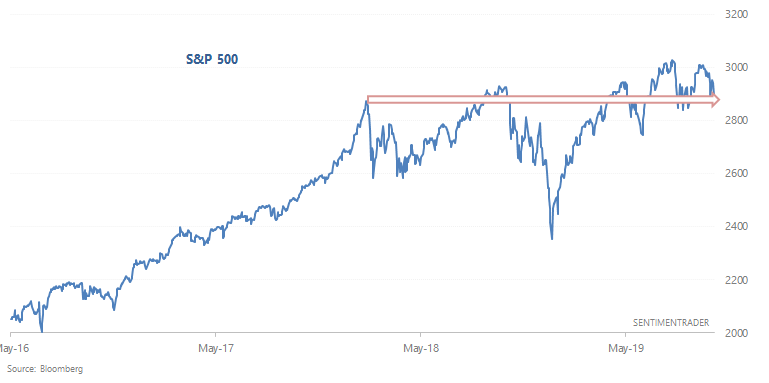
Gone nowhere
As Josh Brown noted on CNBC, the S&P has essentially been flat for the past 1, 2, 6, 12, and 20 months (basically since January 2018).
The longer the market goes sideways, investors and traders bifurcate into 2 groups: those who think that stocks will crash (breakdown from the range), and those who think that stocks will soar (breakout from the range).
If we look at the concept of "no trend" the way Josh Brown describes it, the S&P's forward returns over the next 3-6 months are weak, but after that are more bullish than random:
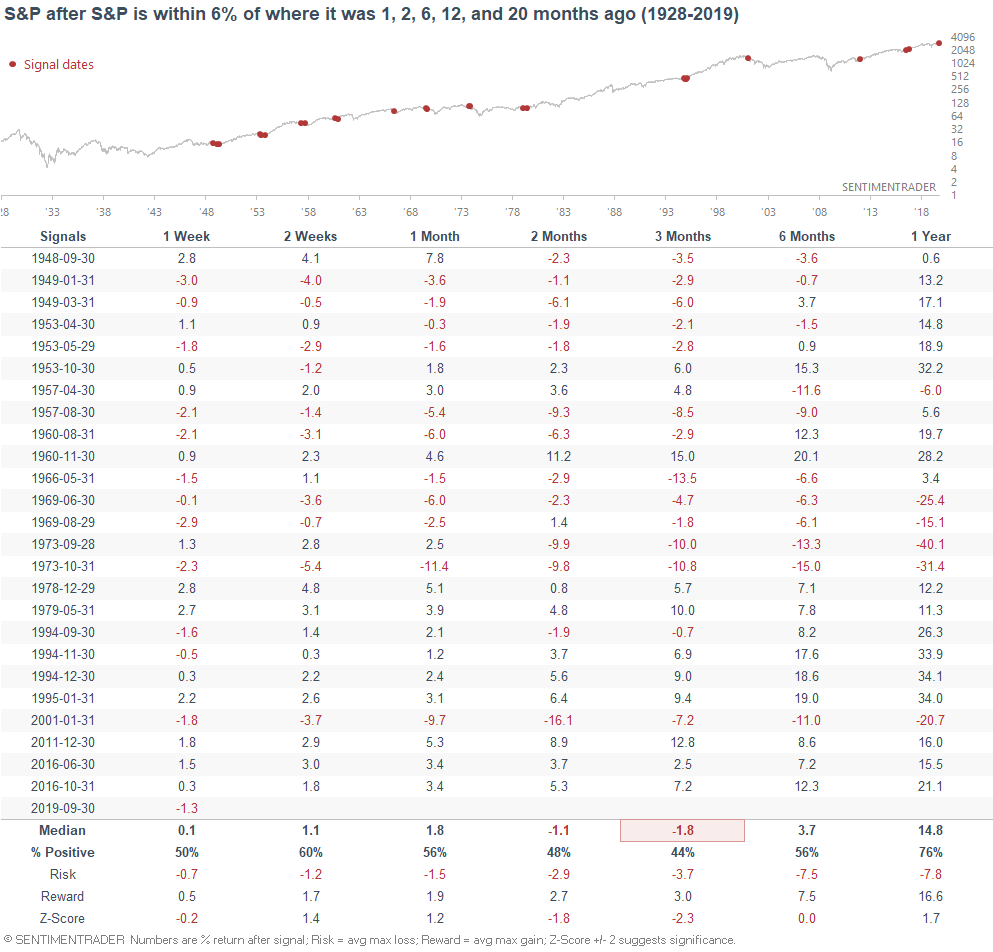
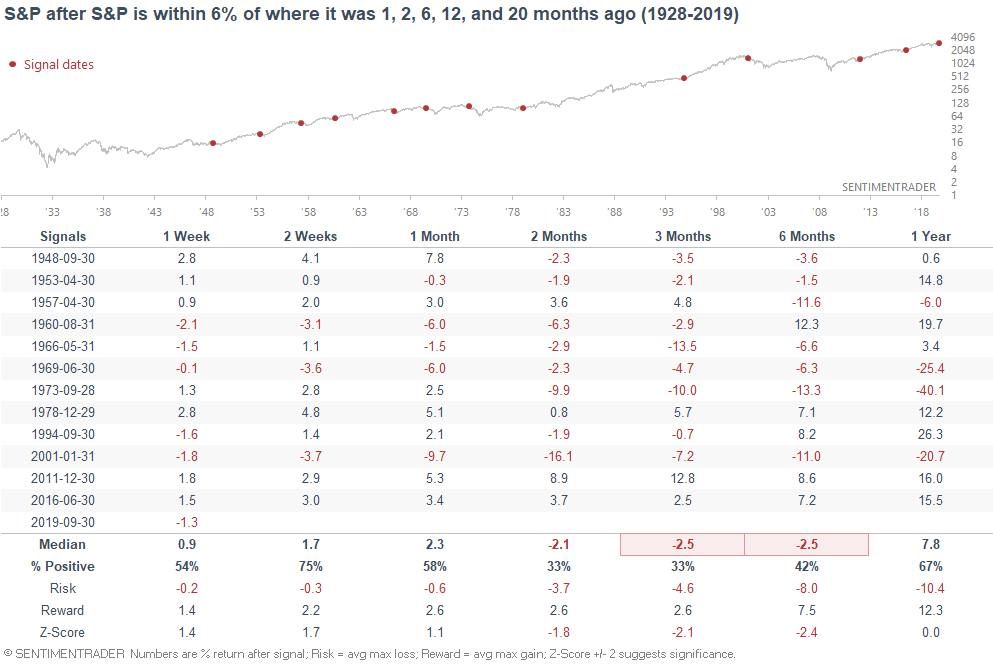
Here's the same table, but eliminating overlapping cases over the past 20 months.
The bottomline is this: it's not clear if the stock market will make a big breakout on the upside after this 1.5+ year range. Expecting today to be "just like 2016" is superficial (just because the S&P "looks like XYZ" in the past, doesn't mean today will be just like XYZ). The stock market's breakout in 2016/2017 was accompanied by a resurgence in global economic growth. So far, we are not seeing that now.
HiLo Logic Index
As more issues start to make new lows, our HiLo Logic Index is rising:
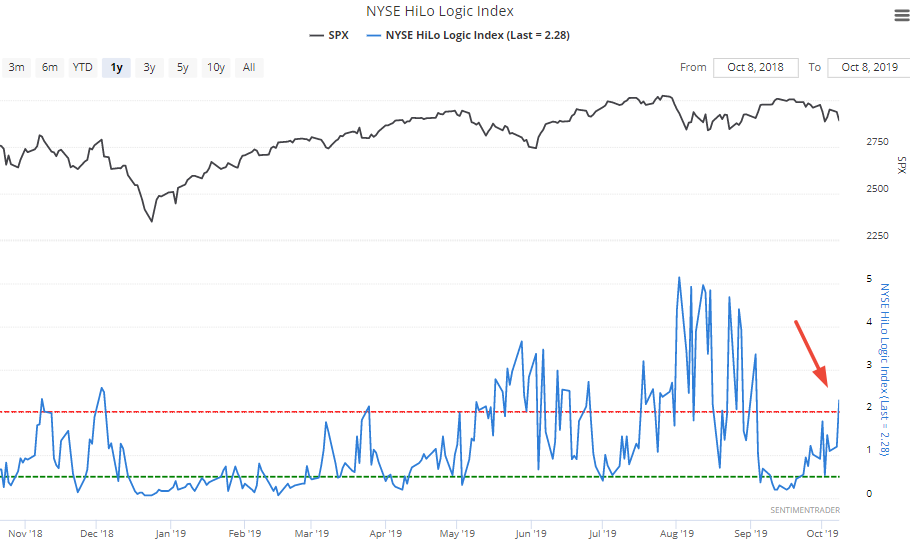
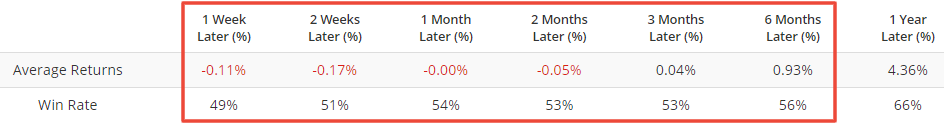
Readings above 2.2 (e.g. right now) aren't necessarily bearish, but are less bullish than random over the next 6 months:
As I explained 2 weeks ago, the best SELL signal when combined with a long term timing model is to wait for the HiLo Logic Index to exceed 3. This hasn't happened yet, but watch out if it does.