
What I'm looking at - financial conditions, stocks vs. bonds & commodities, more on sentiment, soft data, short term breadth
Here's what I'm looking at:
Financial Conditions
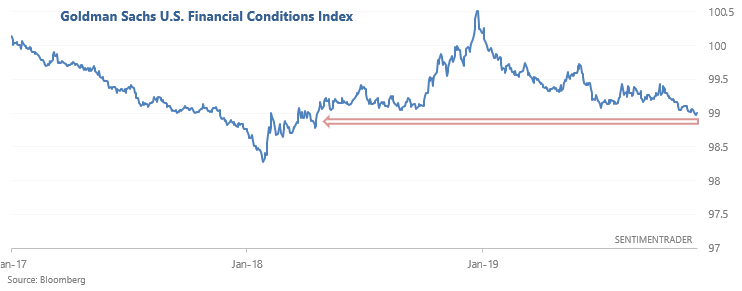
As the WSJ noted, U.S. Financial Conditions continue to ease according to the Goldman Sachs U.S. Financial Conditions Index.
*This index monitors changes in riskless interest rates, exchange rates, credit spreads, and equity prices.
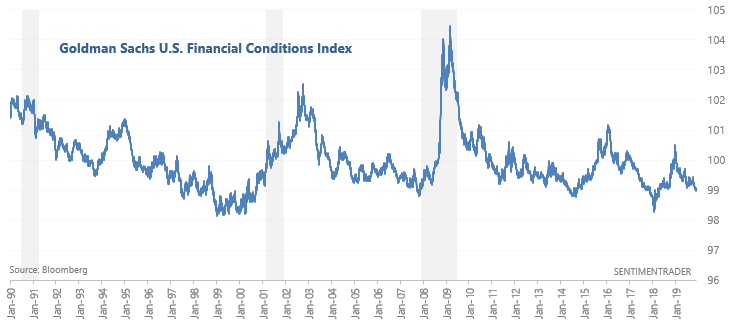
Easing financial conditions are generally bullish for stocks, particularly after coming out of a period of financial turbulence. On the other hand, financial conditions tend to worsen during periods of market stress (e.g. 2018, 2015-2016, 2008-2009, 2000-2002). Here's a longer term look at this chart:
The following able demonstrates what happened next to the S&P 500 when the Goldman Sachs U.S. Financial Conditions Index falls to a 419 day low, as it did last week:
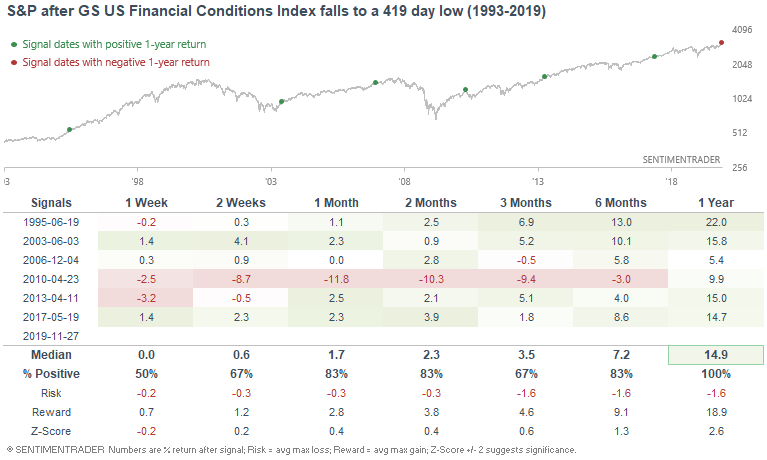
As you can see, the U.S. stock market's returns over the next year are mostly bullish.
Stock/Bond ratio
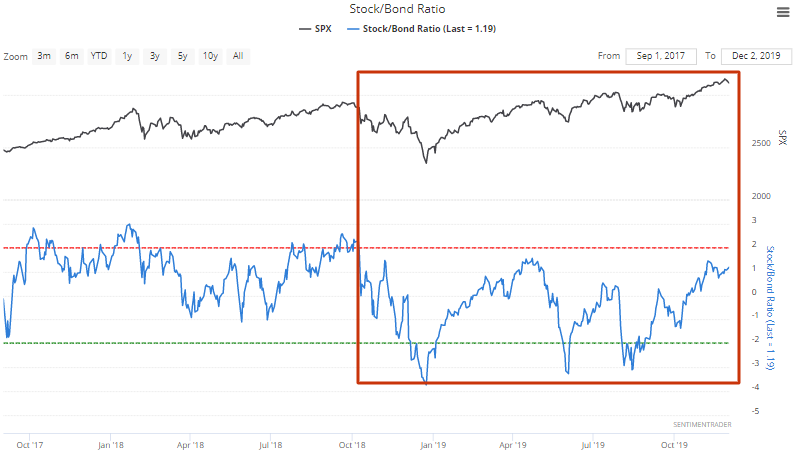
I've been working on combining sentiment indicators into various models, and one of the best indicators to add is the Stock/Bond Ratio. Incorporating the Stock/Bond ratio adds a significant amount of alpha to my models, and often increases the Sharpe ratio significantly.
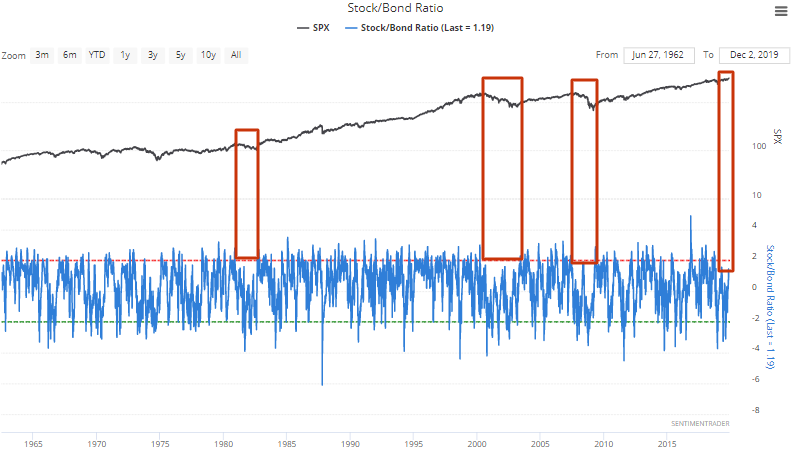
My SELL signal for the Stock/Bond ratio is 2.5 (i.e. sell stocks when this ratio reaches 2.5). But while many other sentiment indicators here at SentimenTrader have been bearish recently, the Stock/Bond ratio has not triggered a sell signal this year. While stocks have risen significantly this year, they have not rallied "too much" relative to bonds, which have also surged this year.
Taking a quick long term glance at this ratio, it's clear that long periods in which the Stock/Bond Ratio doesn't exceed 2 often occur during or near recessions. This is to be expected, since stocks often perform poorly relative to bonds during recessions.
The following table demonstrates every case in which the Stock/Bond ratio remained below 2 for a long period of time. Once again, you can see that many of these dates occurred during or near recessions. The bullish signals typically came after a year of financial stress (2016, 2012).
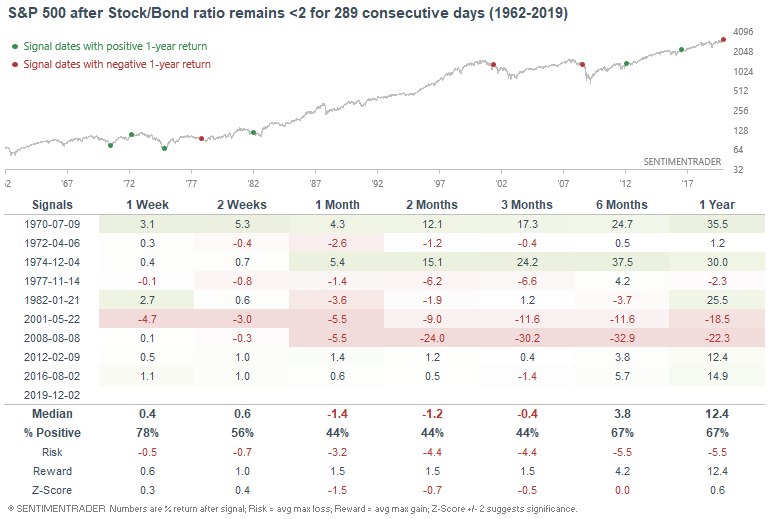
Using this ratio to compare today vs. 2008 makes no sense. The stock/bond ratio was consistently low in 2008 because stocks performed poorly and bonds rallied. The opposite is true today for stocks. The stock/bond ratio is relatively low because bonds have rallied significantly along with stocks.
The following table isolates for cases in which the Stock/Bond ratio remained relatively low for a long period of time, while the S&P rallied over the past year:
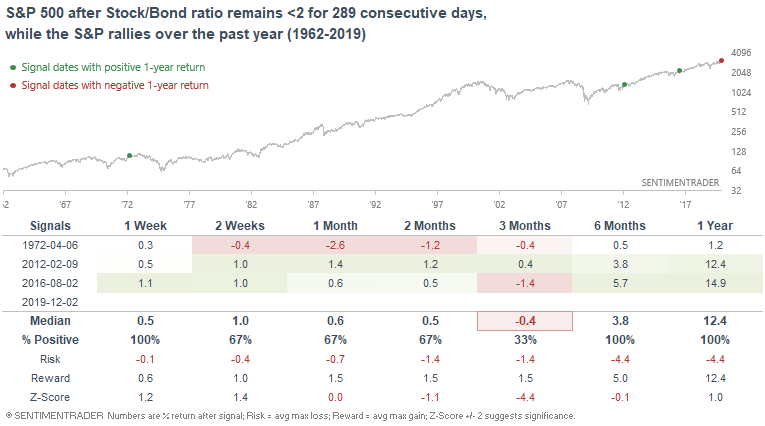
The 2012 and 2016 cases have one thing in common:
- Stocks fell in 2011 and 2015-early 2016 while bonds rallied.
- After stocks bottomed and rallied, bonds continued to rally. This caused the stock/bond ratio to remain excessively low despite a big rally in stocks.
Point is, don't overly rely on 1 single indicator. That indicator may fail to give you a proper warning sign in the future due to the way the indicator is constructed. The Stock/Bond ratio is very useful, but it should be paired with other sentiment indicators in a model.
More on sentiment
We've looked at sentiment in multiple ways recently, mostly with the conclusion that sentiment is extremely high, which is bearish for stocks on a 1-3 month forward time frame.
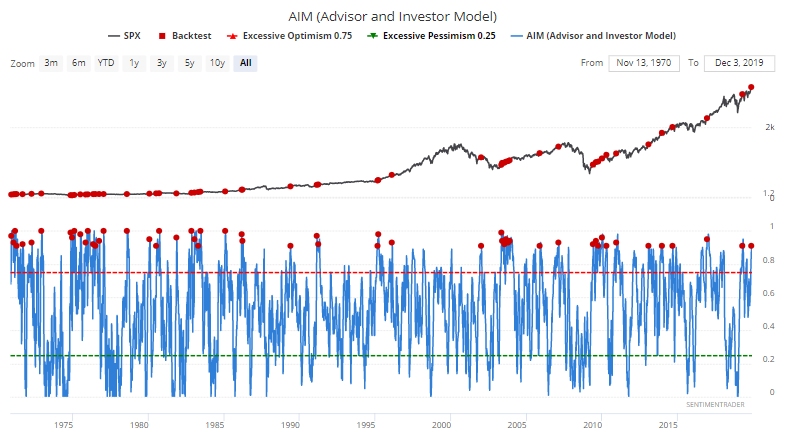
The Advisor & Investor Model - an aggregate of sentiment readings from other advisor and investor surveys - is at the highest level since late-April 2019, just before stocks fell.
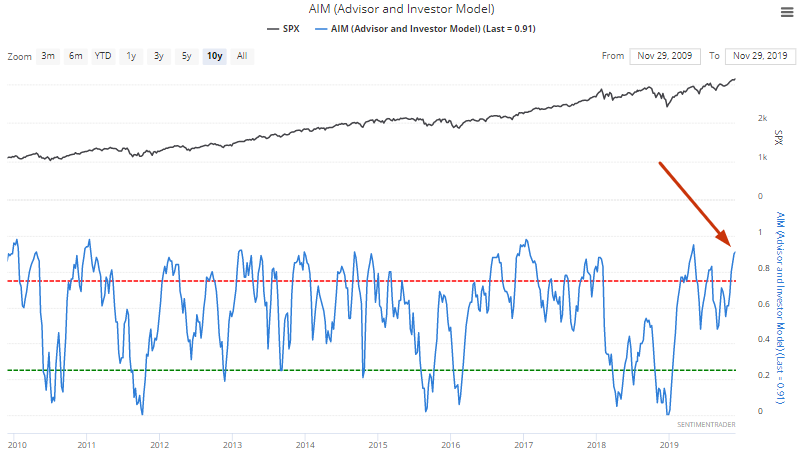
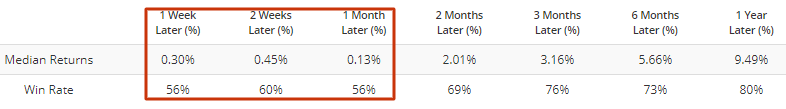
When this happened in the past (excluding overlaps over the past month to look for unique signals), the S&P's returns over the next month were worse than random.
Softs vs. Hard Surprises
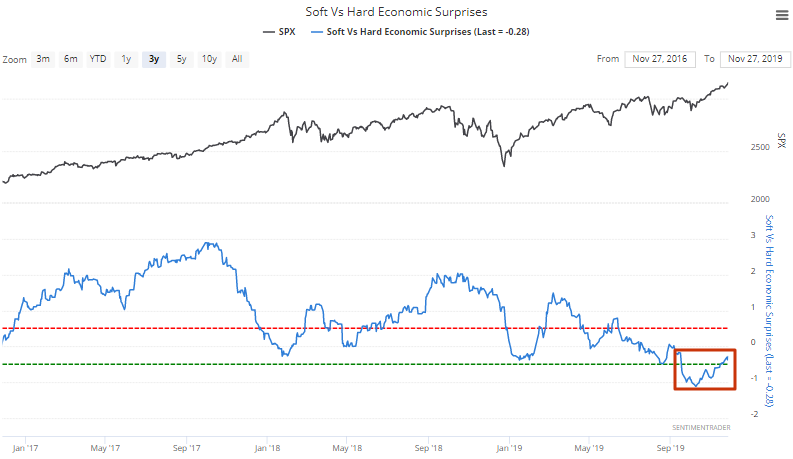
Over the past few months I've noted that while U.S. economic data has not been doing too well relative to expectations, soft data (e.g. manufacturing and trade war related surveys) has been worse than hard data. Now that talks are progressing, soft data is starting to improve a little.
This has pushed soft vs. hard data above -0.3 for the first time in 40 days, which is quite a long streak:
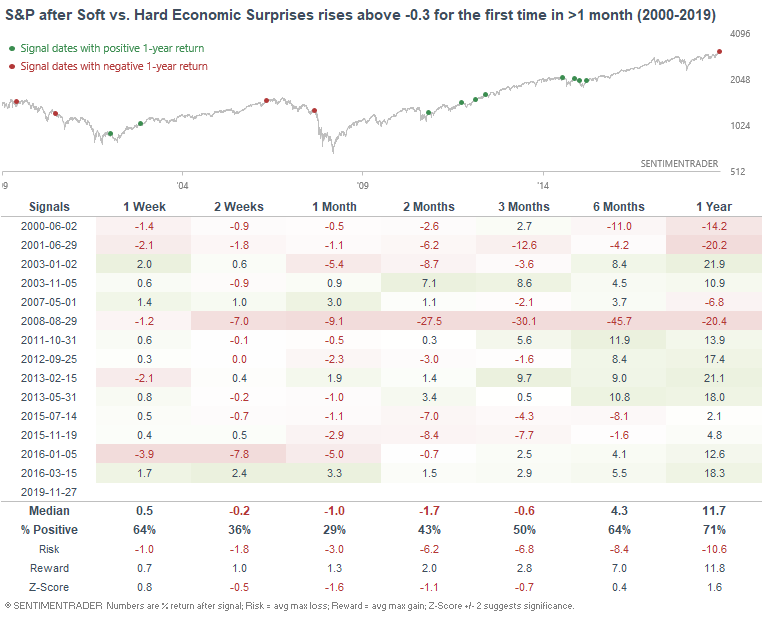
While it's easy to assume that this improvement is a good sign for stocks, that hasn't typically been the case, especially in the short term. When this happened in the past, the S&P was often weak over the next month:
Stocks vs. commodities
While stocks have rallied significantly this year, commodities as a sector have languished.
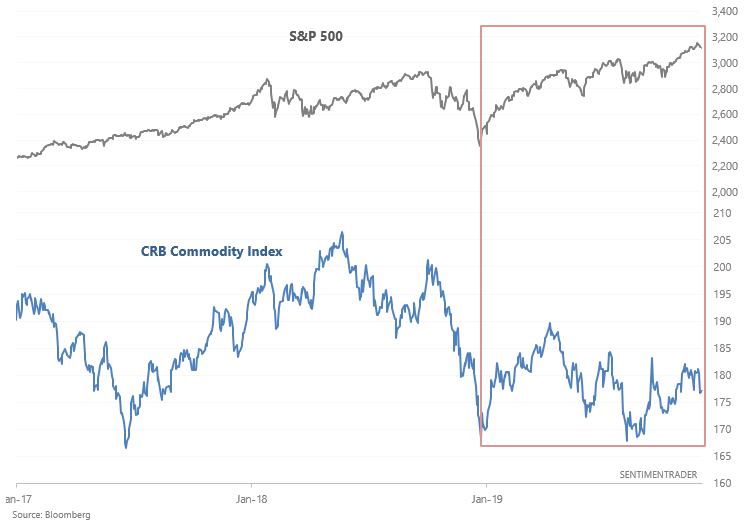
This has caused stocks to remain in a persistent uptrend relative to commodities:
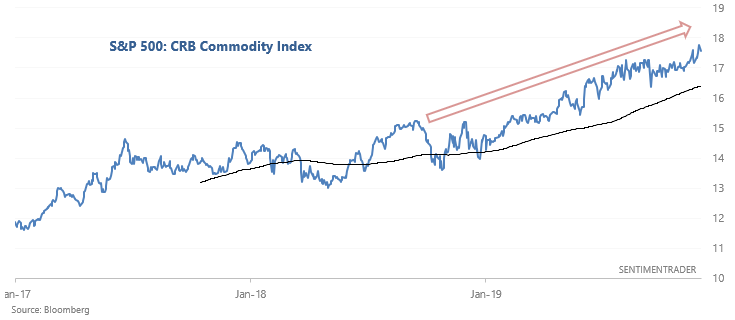
Whenever stocks rally "too much" relative to commodities, traders (particularly ones who tend to lean bearish) start to think that stocks should underperform relative to commodities. But this typically isn't the case.
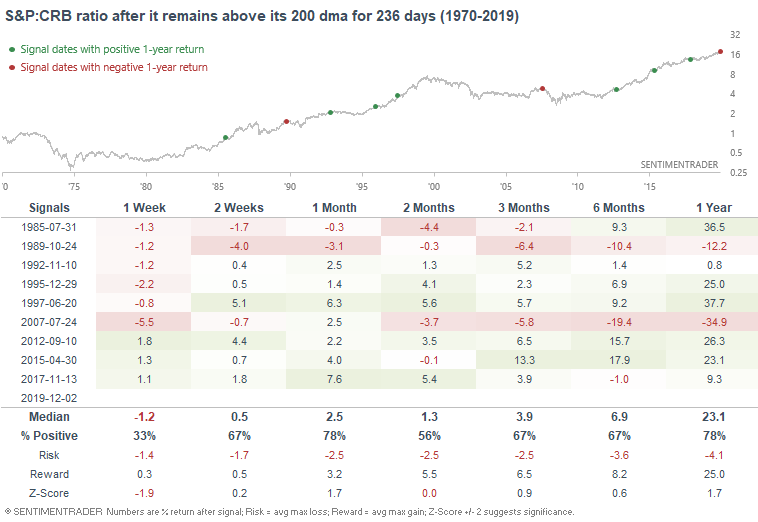
When the S&P:CRB ratio is in an uptrend for a long time, it typically stays in that uptrend over the next year. The 2 cases in which commodities outperformed were 1989 and 2007, when the U.S. economy was slipping into a recession while inflation galloped. This seems like an unlikely scenario today given that the world is grappling with low inflation, not high inflation.
Short term breadth & momentum
After a strong uptrend since early-October, the stock market's short term trend is starting to roll over. The S&P 500's 10 day moving average is falling, and 61% of S&P 500 issues are below their 10 dma:
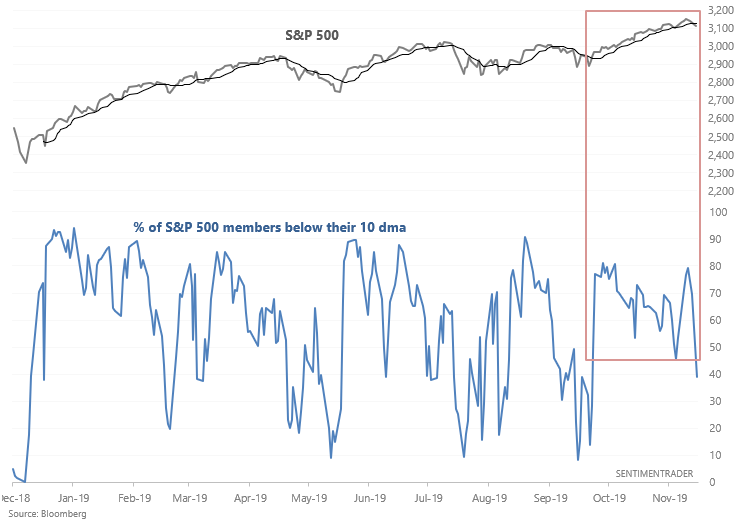
When strong short term uptrends end, the stock market usually keeps on rallying in the short term and over the next year. Momentum is hard to beat:
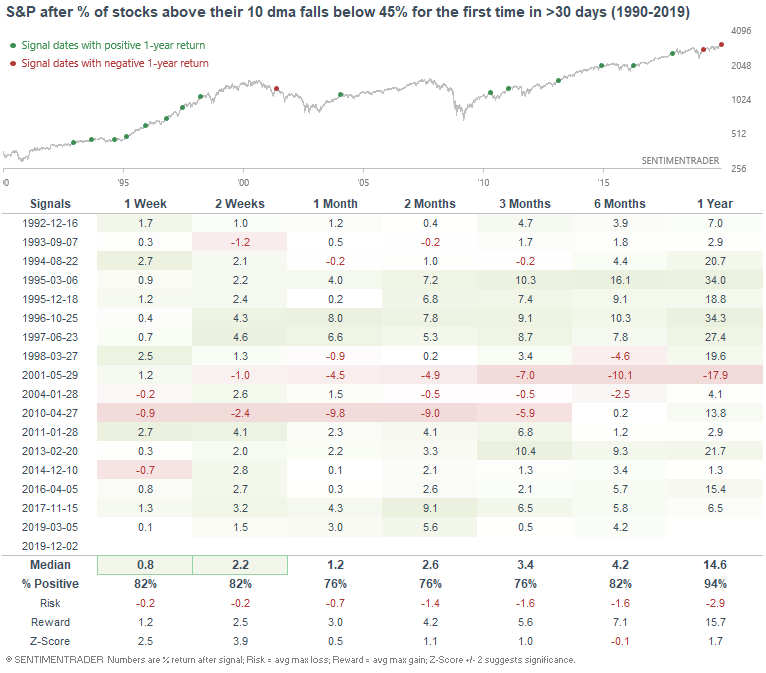
This suggests that while the stock market may struggle over the next 1-3 months, perhaps it won't be a significant pullback/correction.