
What I'm looking at - GS Bear Market, Consumers, Rydex, Earnings, Seasonality
The U.S. stock market remains close to an all-time high. Here's what I'm looking at.
Bear Market Probability Model
Goldman Sachs has a "Bear Market Probability Model" that uses 5 fundamental inputs - the U.S. Unemployment Rate, ISM Manufacturing Index, Yield Curve, Inflation Rate, and P/E Ratio. The model is constructed by looking at each input as a percentile against its historical readings. The higher the Bear Market Probability Model, the closer the economy is to "as good as it gets". Theoretically, this should imply that a recession/bear market will begin soon.
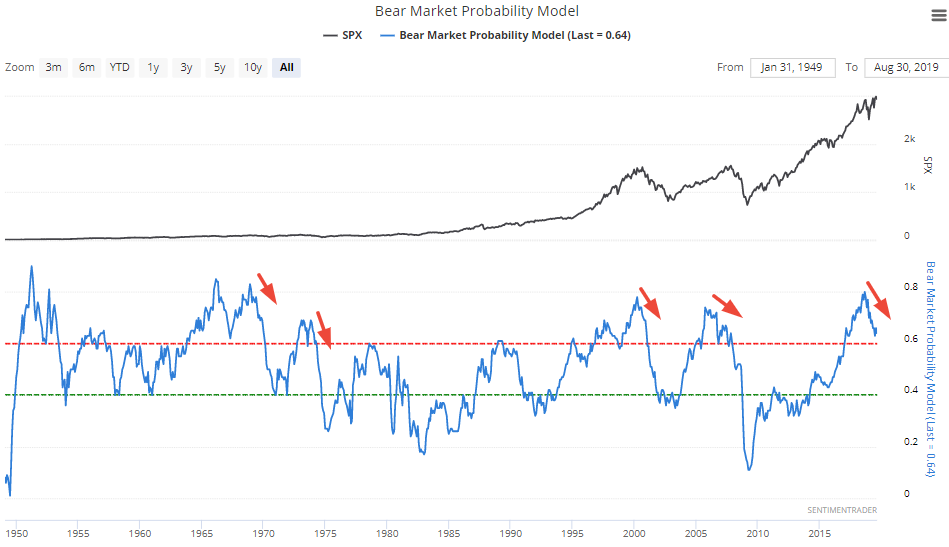
The problem with high Bear Market Probability readings is that they can stay high for years before a bear market/recession begins. A more timely signal is when the Bear Market Probability Model starts to fall significantly (trend downwards) from a high.
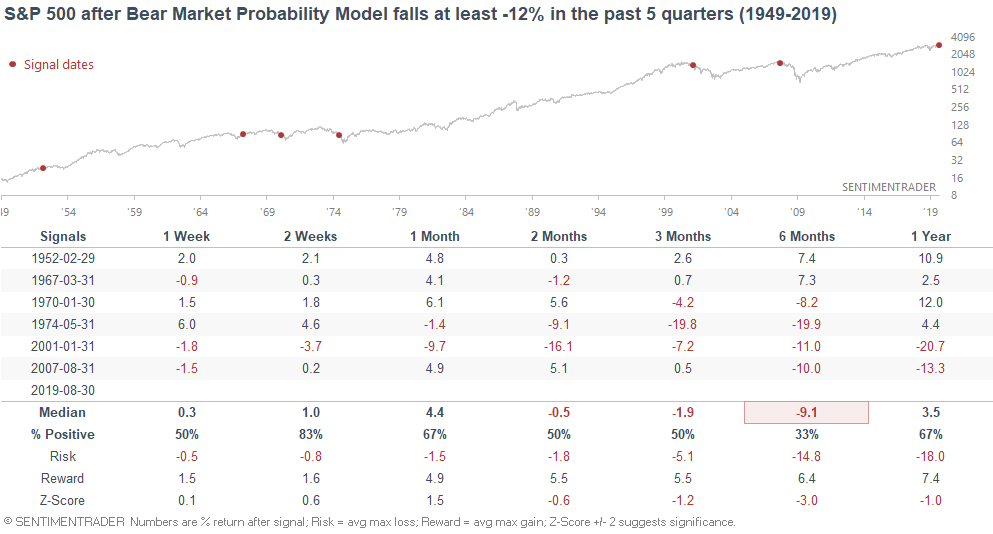
The Bear Market Probability Model has fallen more than -12% over the past 5 quarters (15 months). In the past, this wasn't a great long term sign for the stock market.
- The last 4 signals came within the worst bear markets from 1950-present
- 1966-1967 saw an economic slowdown that was averted by increased Vietnam war spending
- 1952 was followed by a recession 1.5 years later
Consumers
I came across an interesting tweet that compares the University of Michigan's Consumer Confidence vs. the Conference Board's Consumer Confidence.
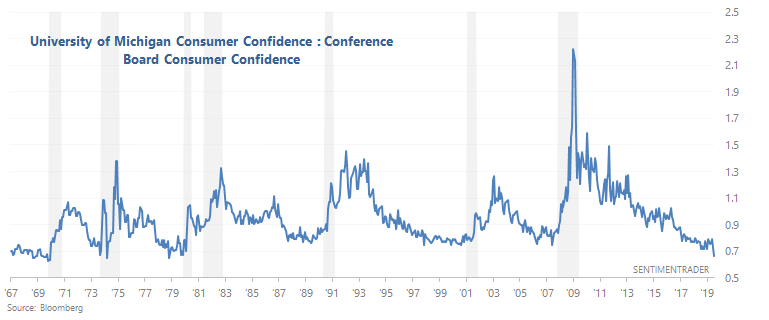
What's interesting about this ratio is that its trend looks similar to the Unemployment Rate. I.e. the ratio becomes very low towards the end of an economic expansion, and increases during a recession. Anil explained why this occurs:
- The University of Michigan essentially asks people about their personal finances.
- The Conference Board asks people about how they think the U.S. economy.
Towards the end of an economic expansion, many people realize that the economy is hot, but don't believe that their personal finances are getting significantly better. Or as Anil put it, "family finances deteriorate faster", which is why the University of Michigan's Consumer Confidence is more of a leading indicator that the Conference Board's Consumer Confidence.
Regardless, here's what happened next to the S&P 500 when this ratio bottomed in each economic expansion.
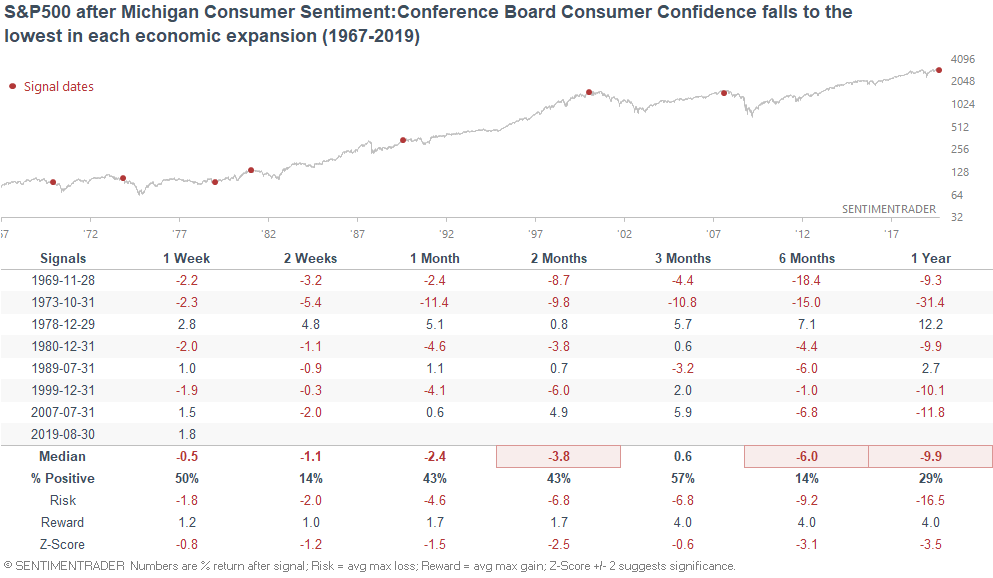
We don't know if the latest reading was the bottom for this economic expansion without 20/20 hindsight. So for now, all we can say is that this demonstrates the late-cycle nature of this bull market and economic expansion.
Rydex Bearish Flow
Traders are still pouring money into bearish Rydex funds. Our Rydex Bearish Flow indicator remains high (above 0.25).
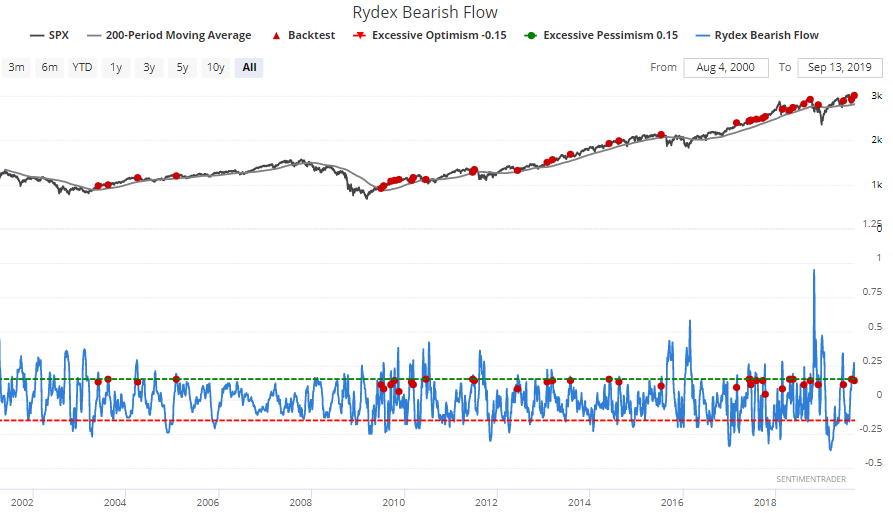
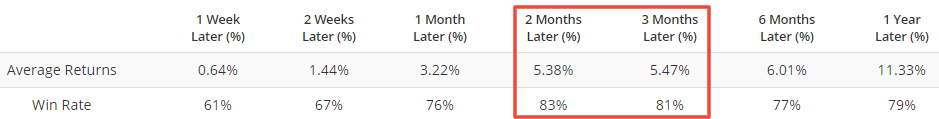
Readings above 0.25 in the past were mostly bullish for the S&P 500 over the next 2-3 months.
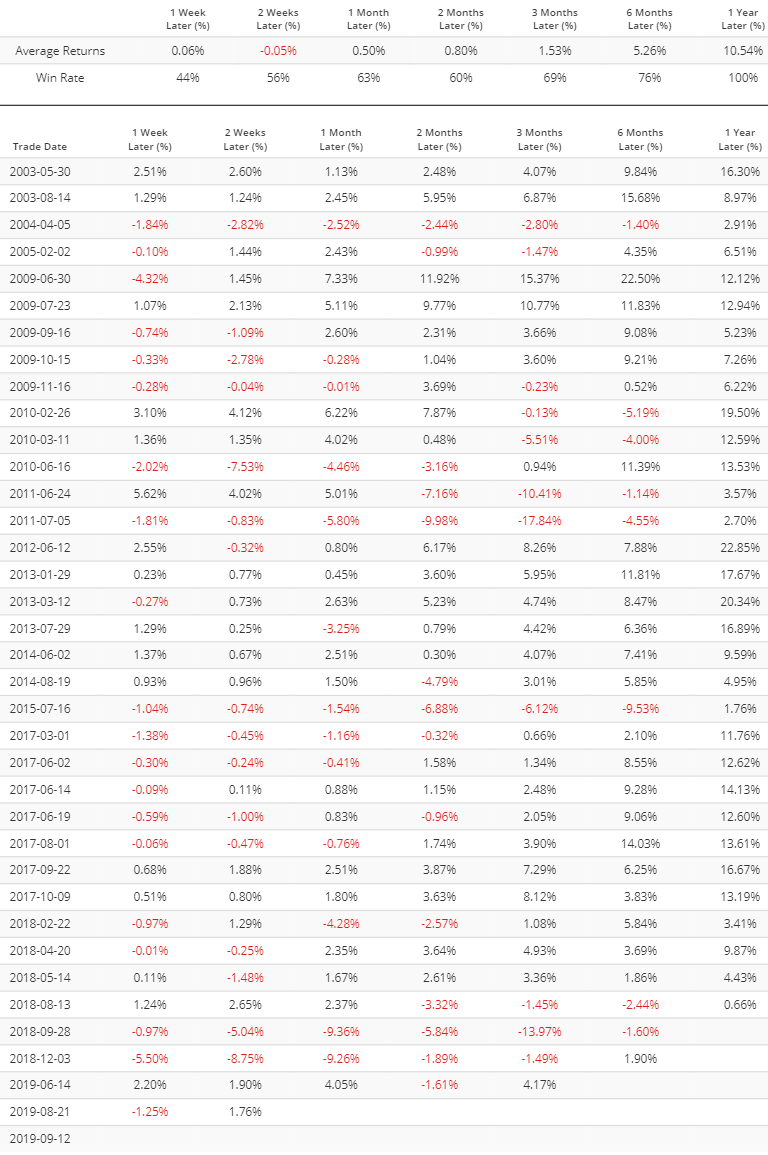
Many of these historical cases are overlaps. But if we look at the first case in 1 month, we can see the same thing. Mostly bullish over the next 2 months. The single big failure came in October 2018, when stocks crashed over the next 2 months.
Earnings
While the S&P has rallied over the past 200 days, Bloomberg's estimates for 12 month forward earnings have barely gone up.
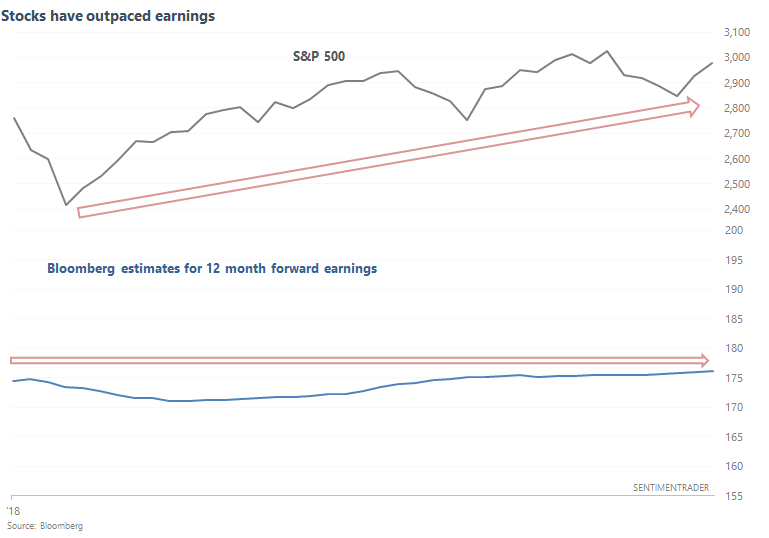
Some market watchers may consider this divergence to be of concern, but that's not what history suggests. The following table looks at what happens next to the S&P if the S&P rallies more than 10% over the past 40 weeks (approximately 200 days), while earnings estimates increase less than 1%.
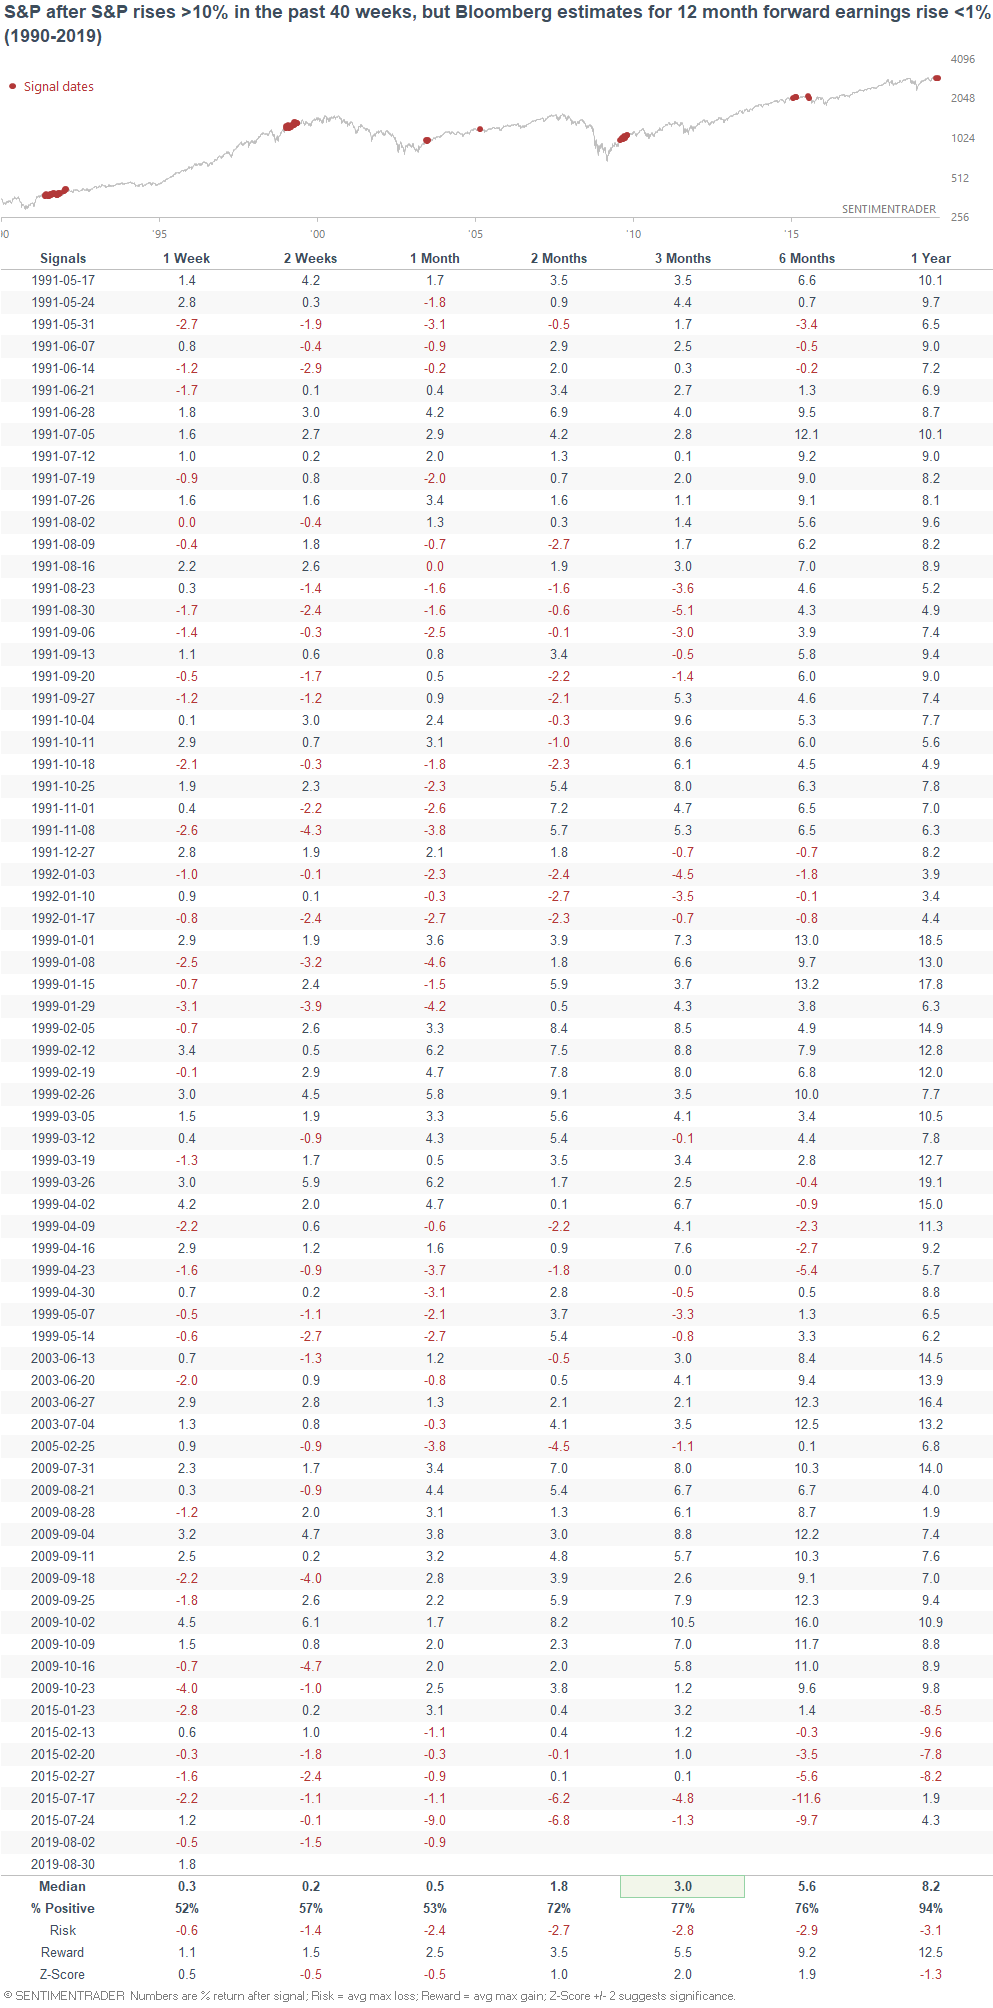
This usually wasn't bearish for stocks over the next year. The 1 exception was in 2015 during the earnings recession that coincided with 2 big drops in the stock market (mid-2015 and early-2016).
Seasonality
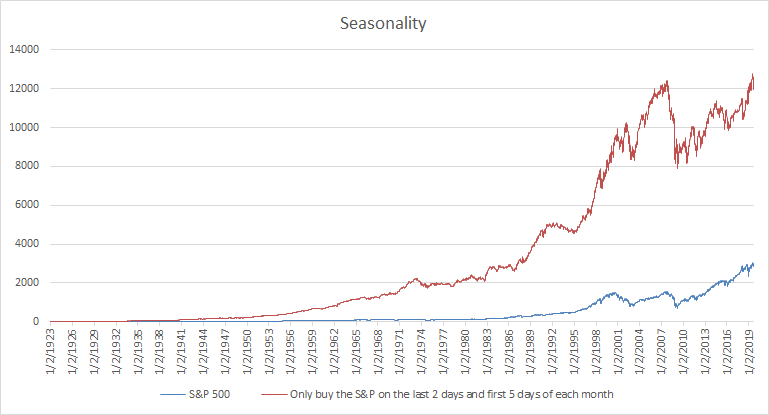
And lastly, here are my thoughts on seasonality. As Jason noted, the media has been all over "bearish September seasonality". I'm not a big fan of seasonality in general because it doesn't give a strong edge, and when it does give a strong edge the reason is never very convincing (i.e. a statistical fluke). There are a lot of purely random patterns, and trying to explain each of these patterns with a smart-sounding rationale works great with 20/20 hindsight but doesn't help traders in real time. Random patterns come and go. For example, here's what happens when you buy and hold the S&P 500 only during the first 5 and last 2 days of each month.
Here is the same chart on a log scale:
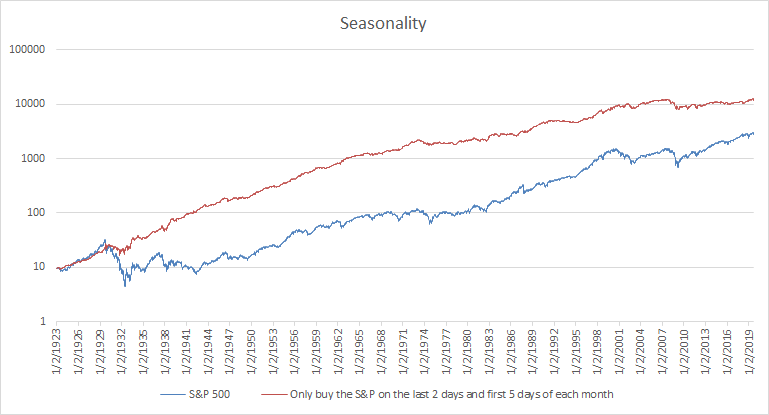
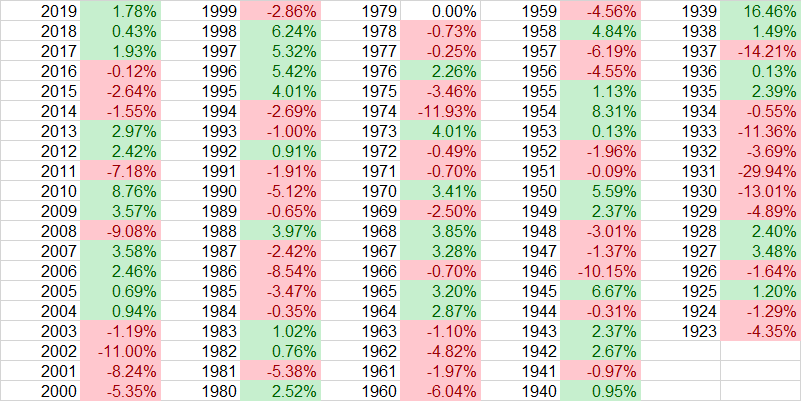
This seasonality worked great until 2000. Since then, this seasonal pattern has flopped. This is why I consider seasonality to be of tertiary importance. Anyways, here's every single September from 1923-present for the S&P 500. Negative months are in red, positive months are in green.
*Returns are based on the S&P 500 non-total return index, excluding dividends.
Seasonality isn't great right now for bulls, but it is hardly a be-all and end-all. Remember, correlation is not causation.