What I'm looking at - Intermediate Term Optix, New Home Sales, small caps breadth, large caps breadth, gold volatility
Here's what I'm looking at:
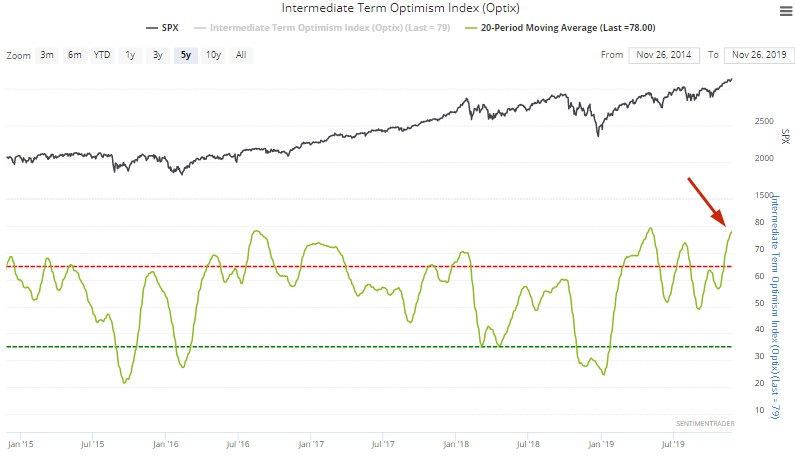
Intermediate Term Optimism Index
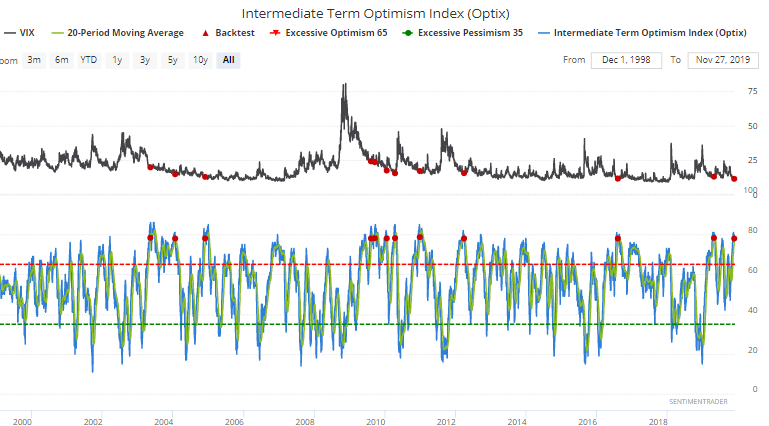
With the stock market pushing higher relentlessly, sentiment remains elevated. The Intermediate Term Optimism Index's 20 day average has risen to 78, one of the highest levels in years. The last time this happened was in April, just before stocks pulled back.
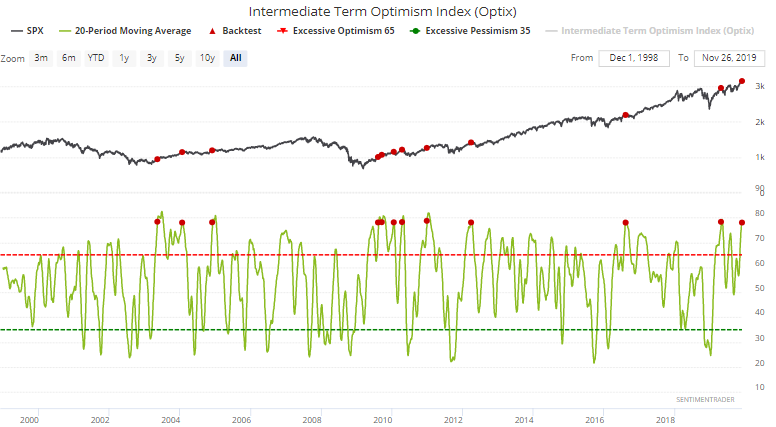
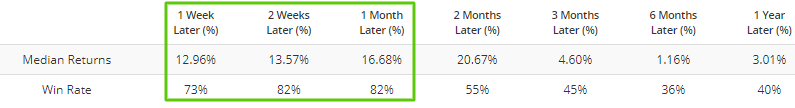
When this happened in the past, the S&P 500's returns over the next few weeks were poor. In addition, returns over the next year were mostly bullish, as extremely high sentiment is a hallmark of very strong trends. Due to the momentum effect, the stock market's trends tend to weaken before major peaks:
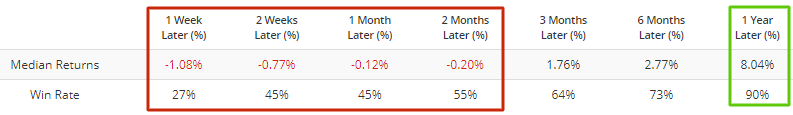
Meanwhile, this usually led to gains for VIX over the next few weeks:
New Home Sales
Housing continues to improve, which is a good sign for the U.S. economy. After a slump in 2018, New Home Sales continues to trend higher this year, pushing its year-over-year % change to 31%.
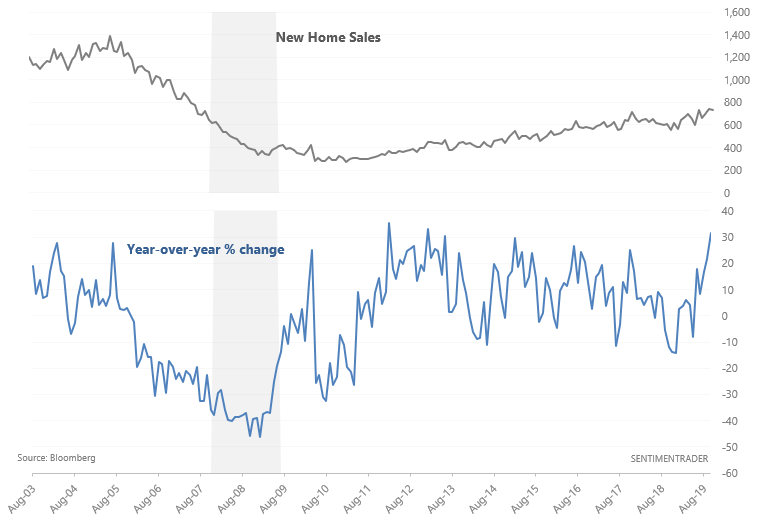
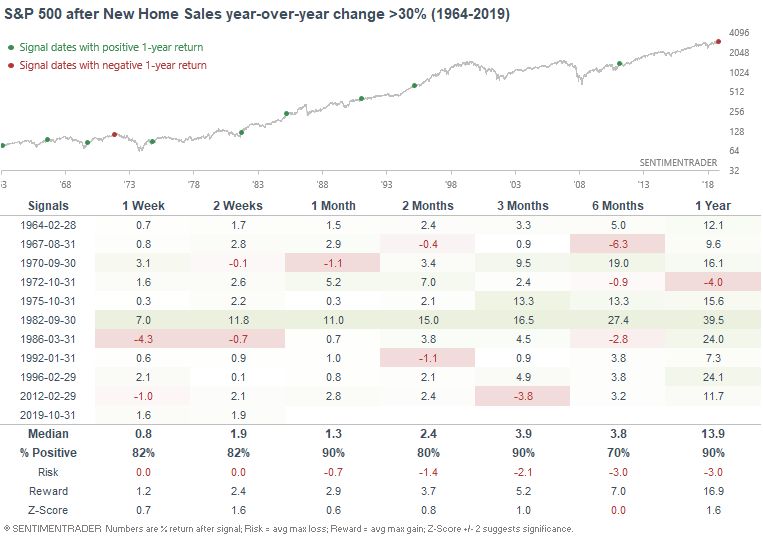
Since the economy and stock market tend to move in the same direction in the long run, this has typically been a good sign for U.S. equities over the next year. The one exception was 1972, when the stock market peaked before U.S. macro started to deteriorate. However, the worst section of the 1973-1974 bear market (October 1973-September 1974) occurred AFTER U.S. macro had deteriorated:
Small caps new high breadth
As I mentioned yesterday, small caps have broken out to a 1 year high. Accompanying this breakout is an increase in small cap issues that are making new 52 week highs:
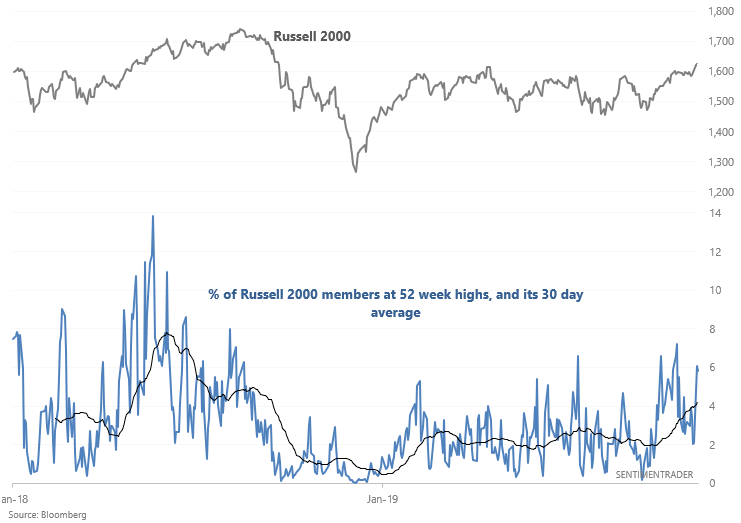
Here's a longer term look at this breadth chart:
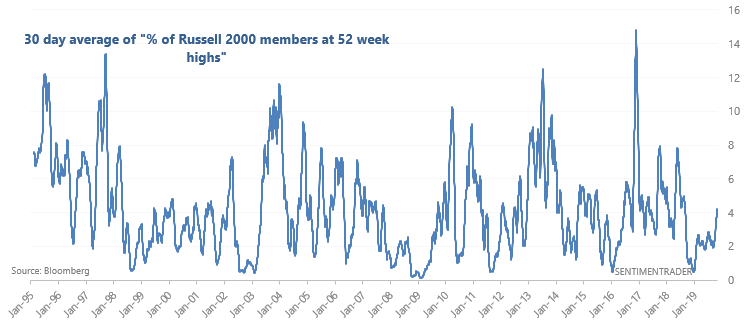
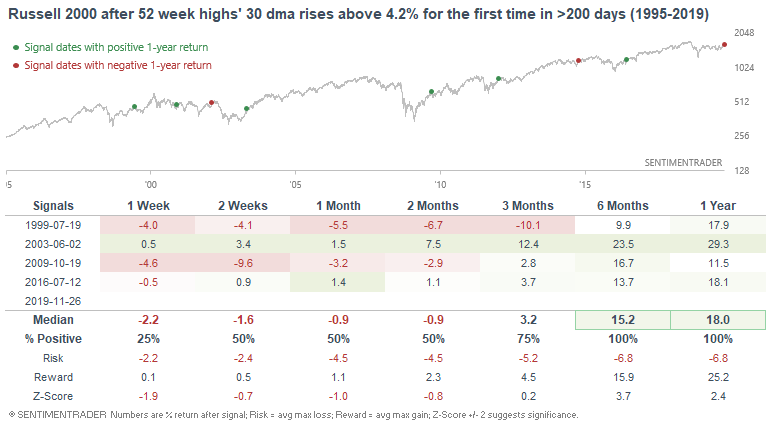
When the 30 day average of "% of Russell members at 52 week highs" rose above 4.2% for the first time in >200 days, the Russell typically surged over the next 6-12 months, even if it faced short term weakness:
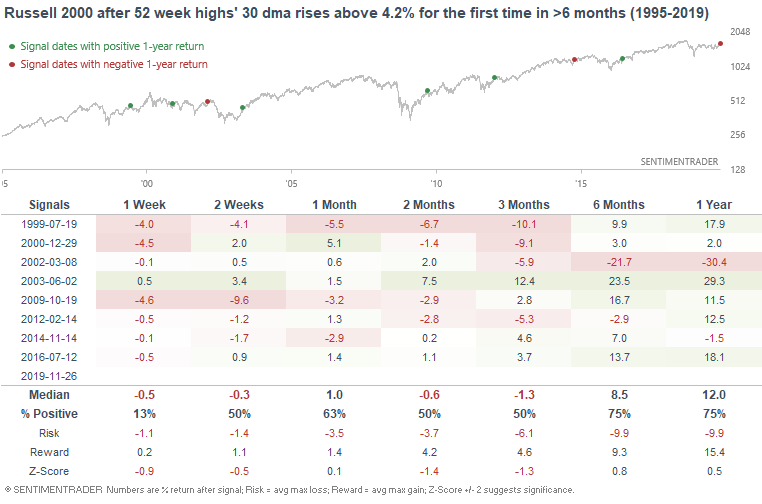
If we loosen the parameters to increase the sample size, the Russell 2000's returns over the next week are still worse than random:
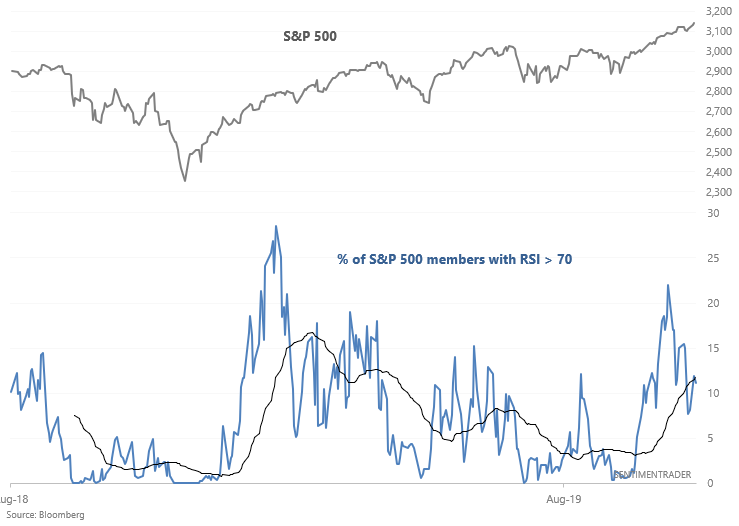
S&P 500 breadth
With the overall stock market rallying, more of the S&P 500's members are overbought vs. what has occurred over the past few months. This has pushed the 30 day average in the "% of S&P members with RSI > 70" above 11.8%:
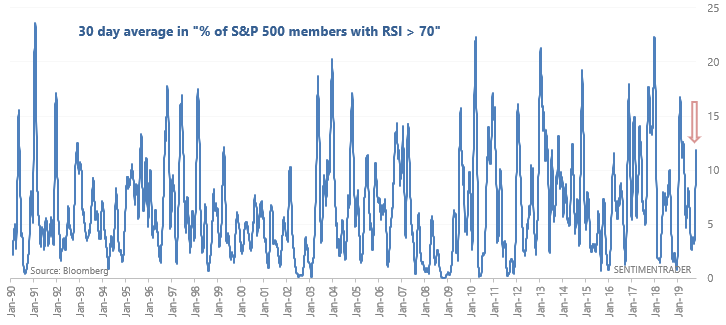
Here's a longer term look at this chart:
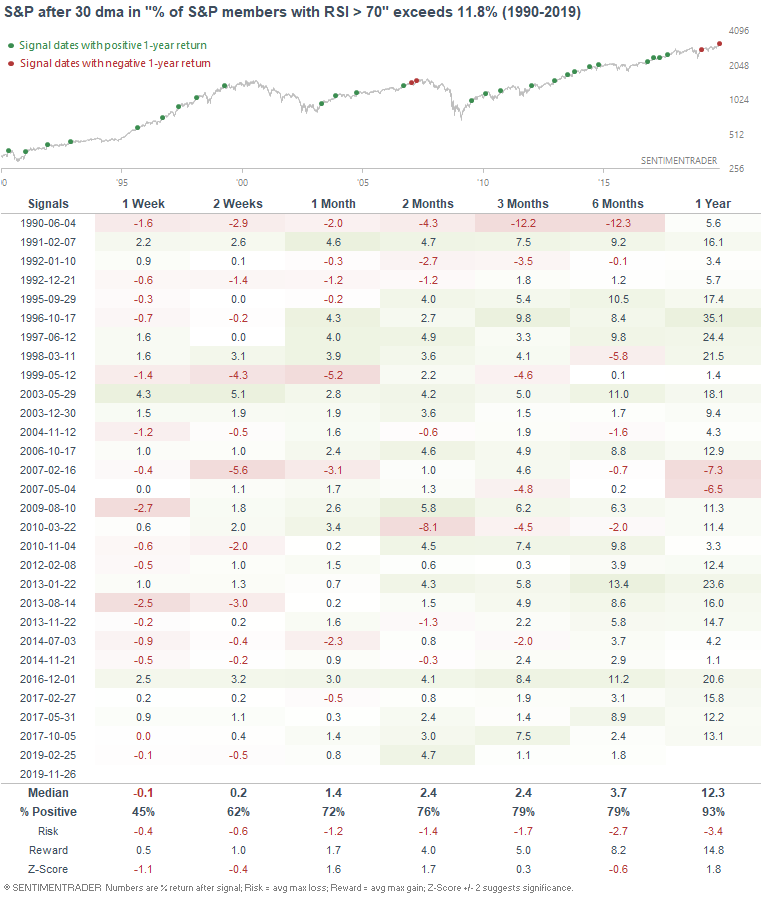
When this happened in the past, the S&P 500 sometimes faced short term weakness (due to too many issues being overbought), but its returns over the next year were mostly bullish:
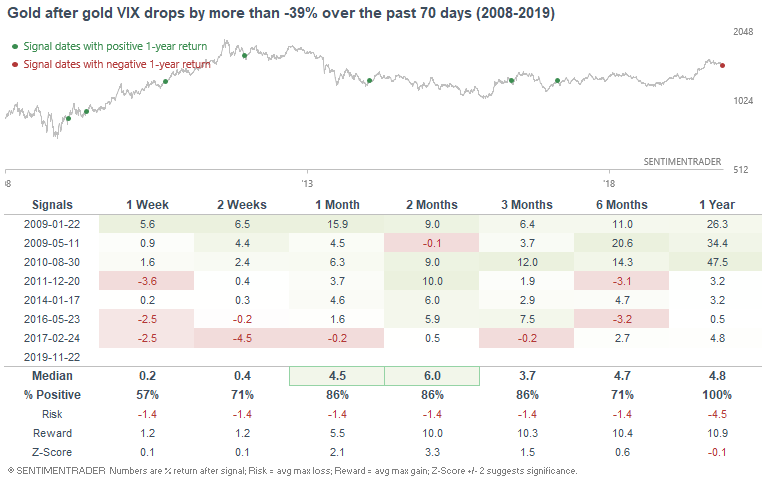
Gold's VIX
After a spike earlier this year, gold has been trending sideways/downwards, and its volatility has subsided.
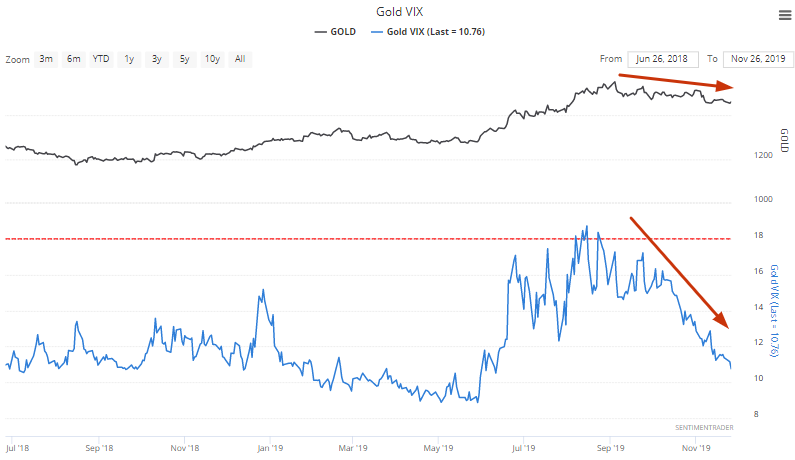
Here's a longer term look at this chart:
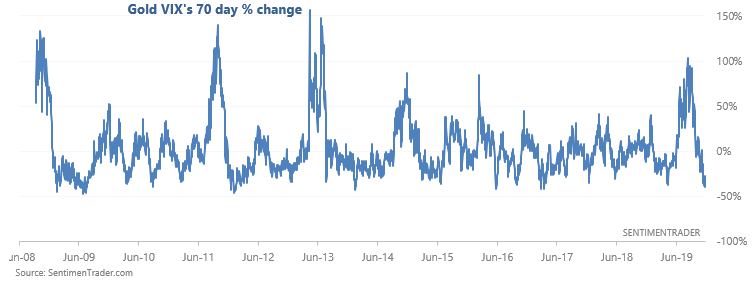
When gold's volatility fell significantly over a 70 day period, it often rallied over the next 1-2 months. Considering the recent risk-on and risk-off relationship between stocks and gold, it would not be surprising if a pullback in stocks was accompanied by a rebound in gold: