What I'm looking at - MACD sell signal, Business Climate Indicator, VIX, different surprise indices, gold's 4Q rally
As stocks continue to bounce around near all-time highs, here's what I'm looking at:
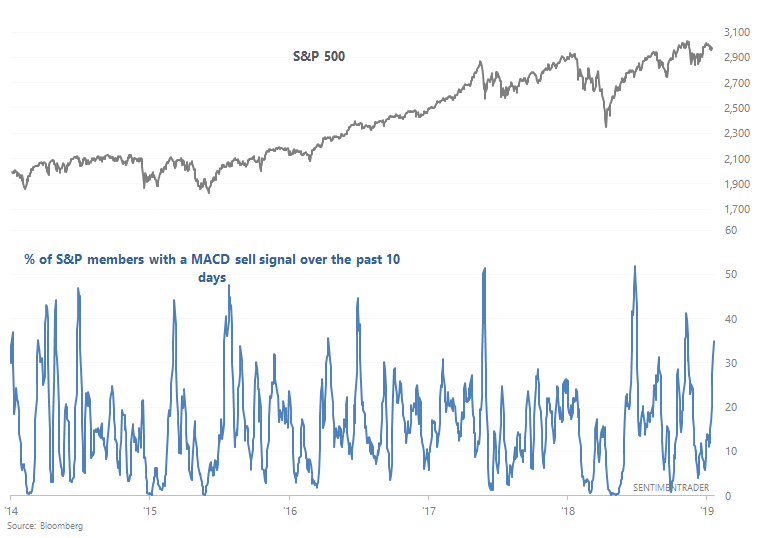
MACD sell signal
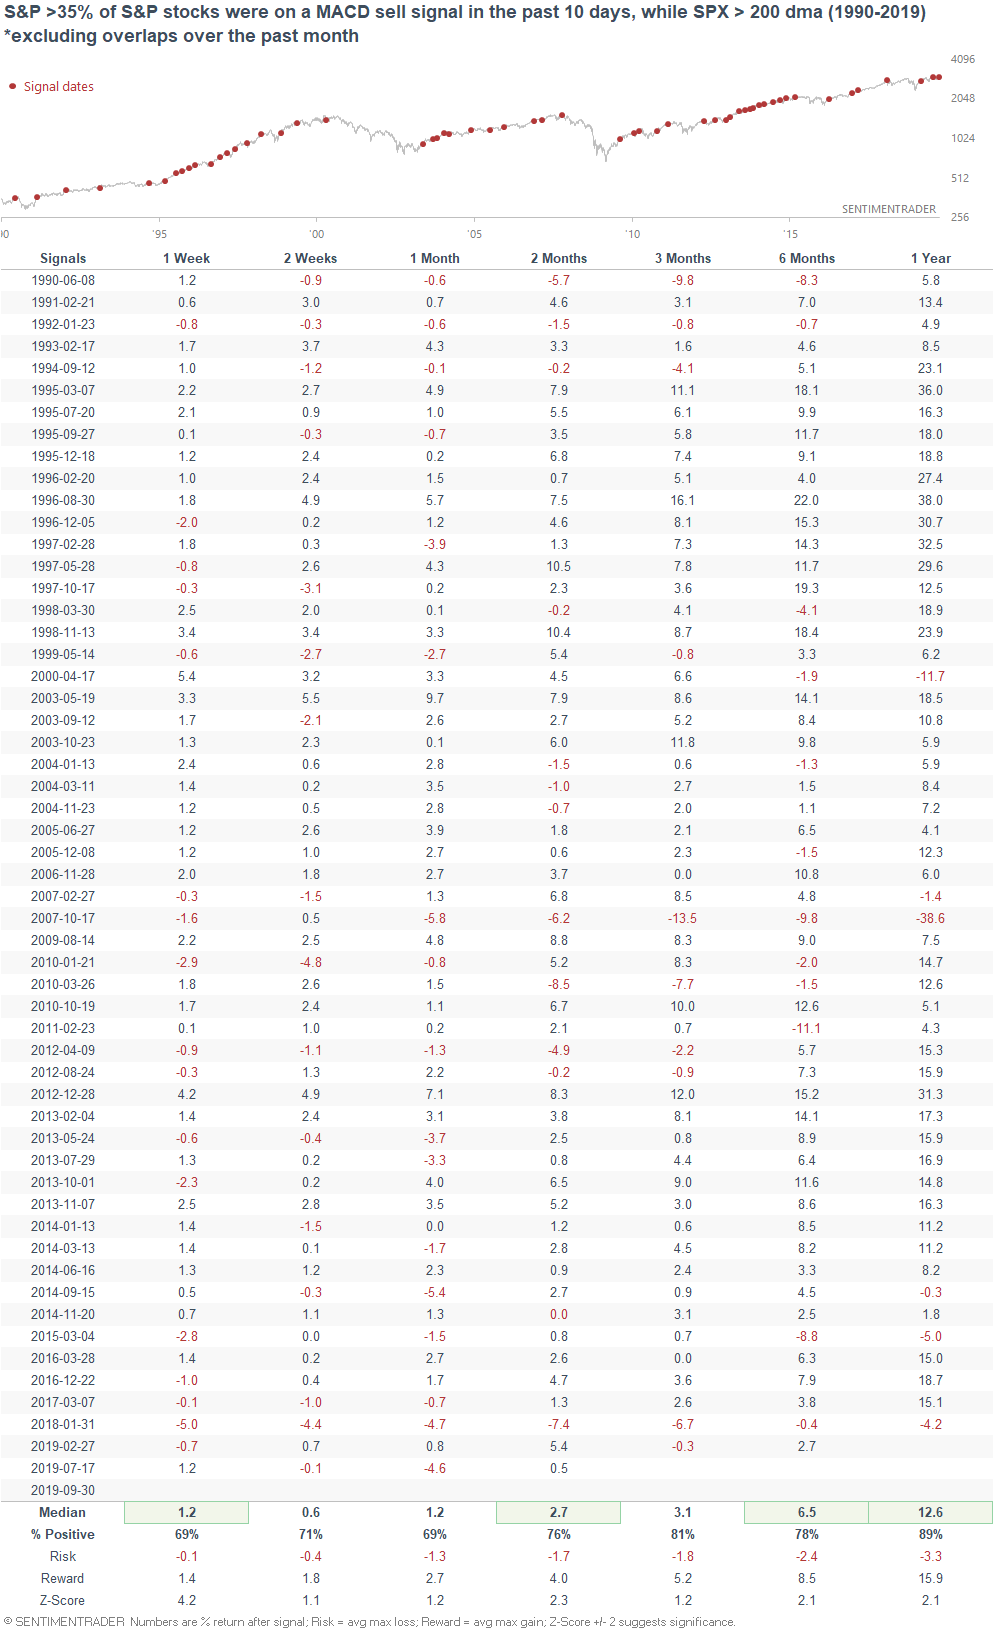
With the U.S. stock market slowly trending downwards over the past week, more than 35% of S&P members have seen a MACD sell signal over the past 10 days:
When this happened while the S&P was above its 200 day moving average, the S&P's returns over the next 2-3 months were more bullish than average.
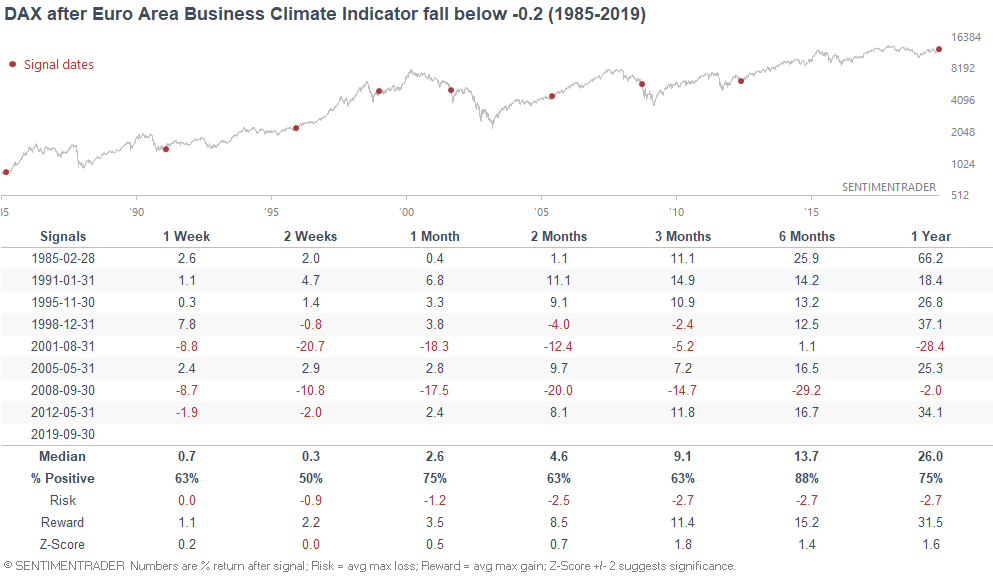
Euro Area Business Climate Indicator
As the WSJ reports, the Euro Area Business Climate Indicator continues to fall. This composite indicator looks at manufacturing in the Euro area, which is weak right now.
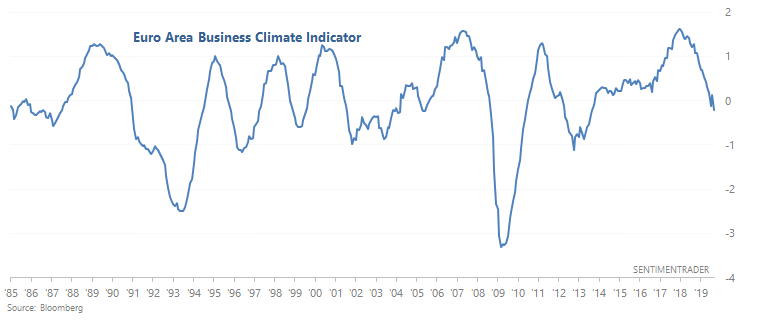
While this may seem scary ("Euro Area Business Climate Indicator at a 6 year low"), it wasn't consistently terrible for DAX (German stock market). It did happen during the midst of the 2000-2002 and 2007-2009 bear markets, but there were also plenty of false bearish signals.
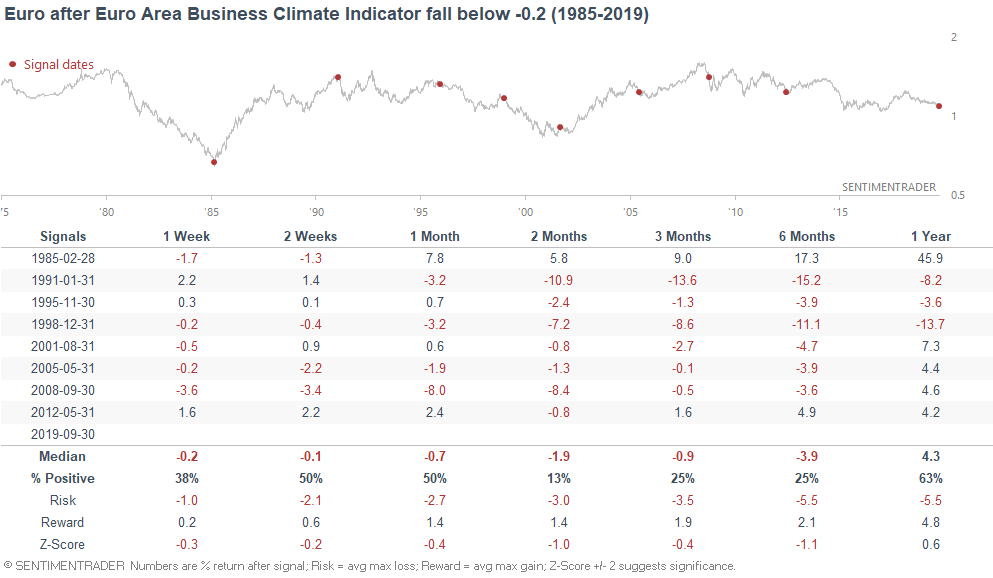
Interestingly enough, this wasn't great for the Euro over the next 2 months:
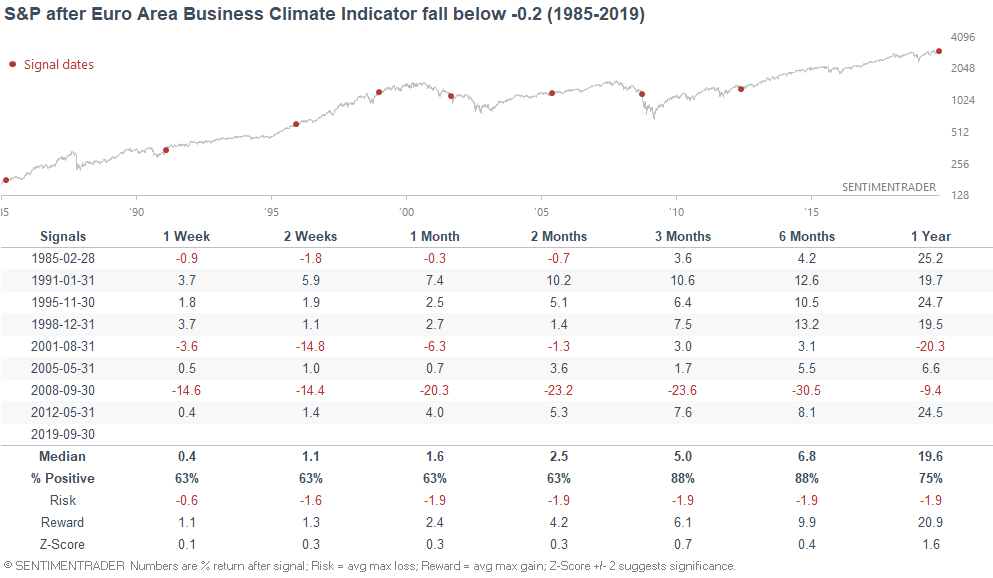
And neither was this consistently bearish for the S&P 500. It did happen during the 2001 and 2008 recessions, but there were also plenty of other false bearish signals:
Volatility
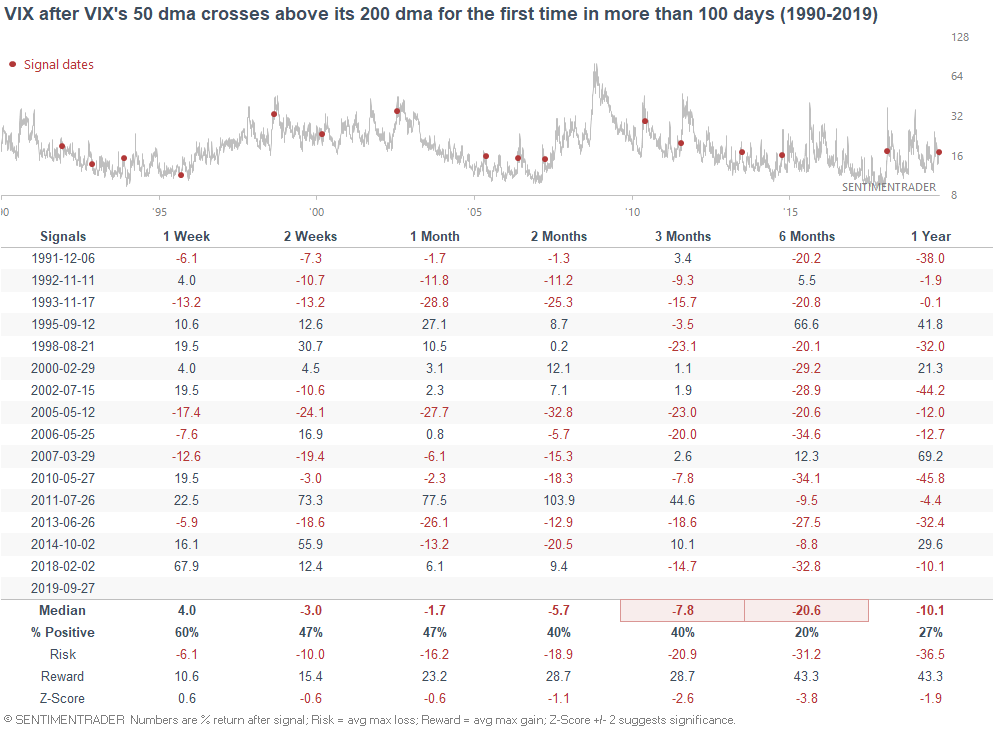
VIX's 50 dma has crossed above its 200 dma for the first time in 135 days as the stock market's year-to-date rally loses steam.
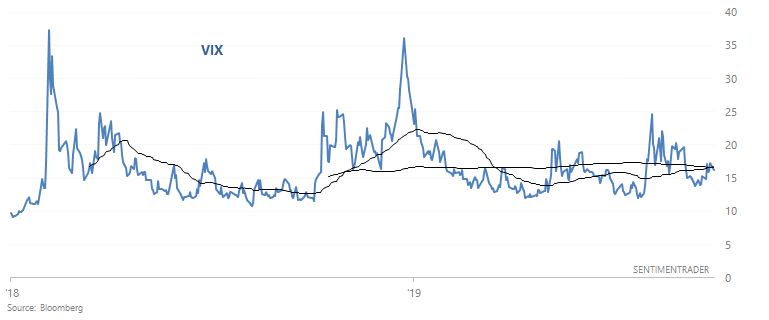
When VIX made a golden cross for the first time in a long time, its forward returns over the next 3-6 months were worse than random...
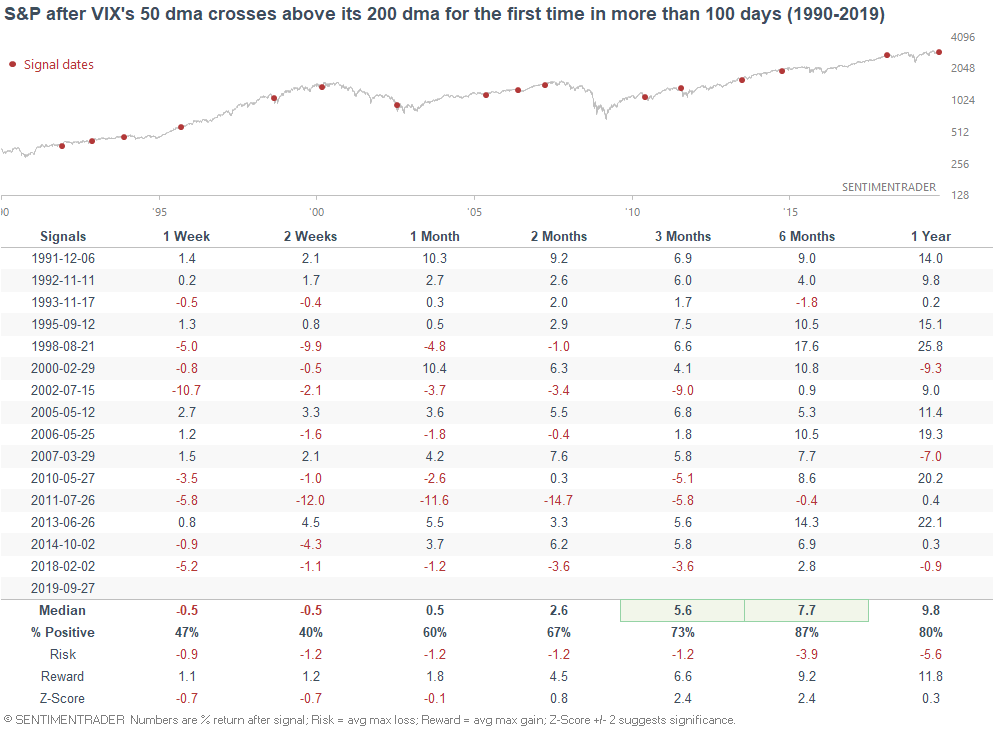
...and the S&P's 3-6 month forward returns were more bullish than random. Even the 2 worse failures - 2000 and 2007 - saw the S&P rally over the next 1-6 months before crashing.
This doesn't mean that stocks can't fall in October and VIX can't spike. From 1990-present, VIX has risen an average of 4.63% in October (seasonality). Remember, seasonality factors are of tertiary importance.
Different surprise indices
Michael Kantrowitz pointed out that while the Citigroup Economic Surprise Index has surged recently, Bloomberg's leading indicator Surprise Index is still lagging.
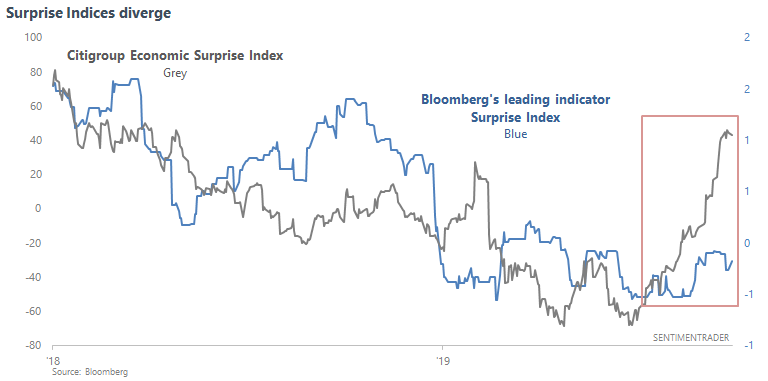
The general train of thought is that this is bearish for stocks, because the Citigroup Economic Surprise Index includes more lagging data whereas Bloomberg's Surprise Index includes more leading data. To test this theory, we can look at all the cases in which Citigroup's surprise index rallied more than +110 over the past 3 months, while Bloomberg's surprise index rallied less than +0.5
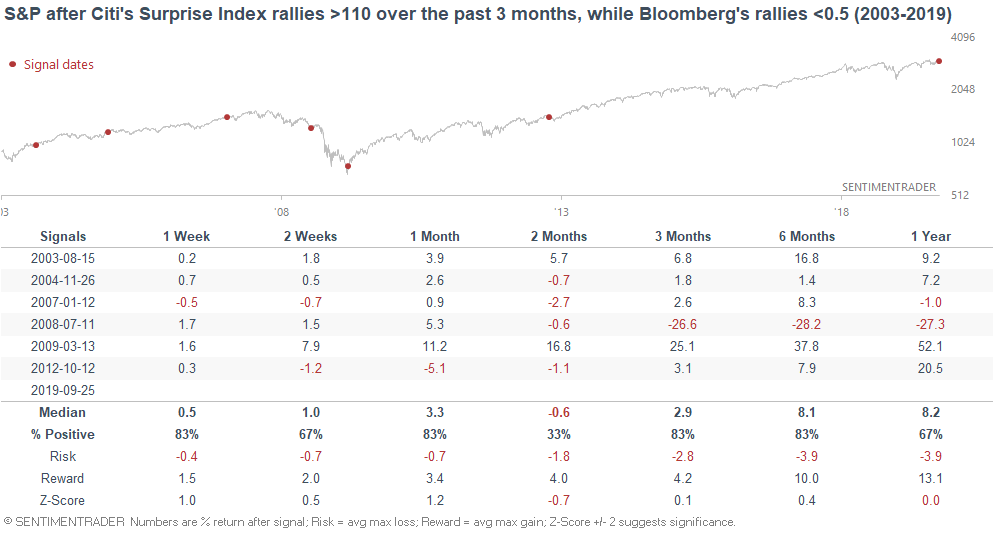
The sample size is small, and while there was a bearish bias over the next 2 months, this wasn't a consistent long term reason to worry.
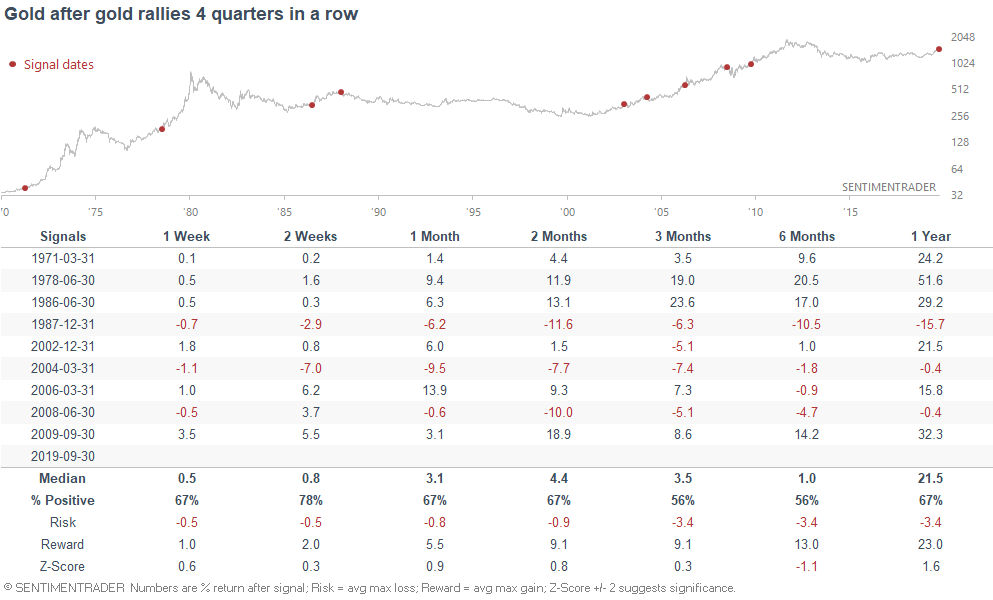
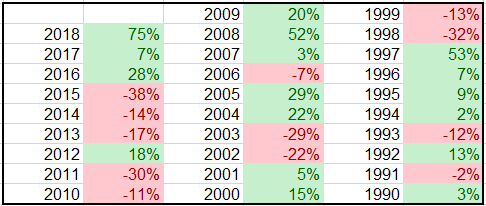
Gold
And lastly, gold has rallied 4 quarters in a row. The last time this happened was during the great bull move of 2009-2011. Overall, this tends to happen in a long term bull market for gold.