
What I'm looking at - manufacturing weakness, housing recovery?, Dumb Money, CNN Fear & Greed, Risk Appetite
Markets remain volatile amid a flood of "RECESSION" headlines. I'll publish a comprehensive market overview that combines fundamentals with technicals this weekend. But for now, here are a few things I'm looking at.
Manufacturing weakness
While the media is screaming "RECESSION INCOMING", not all parts of the economy are weak. There are pockets of weakness, which are usually centered around:
- The yield curve
- Manufacturing
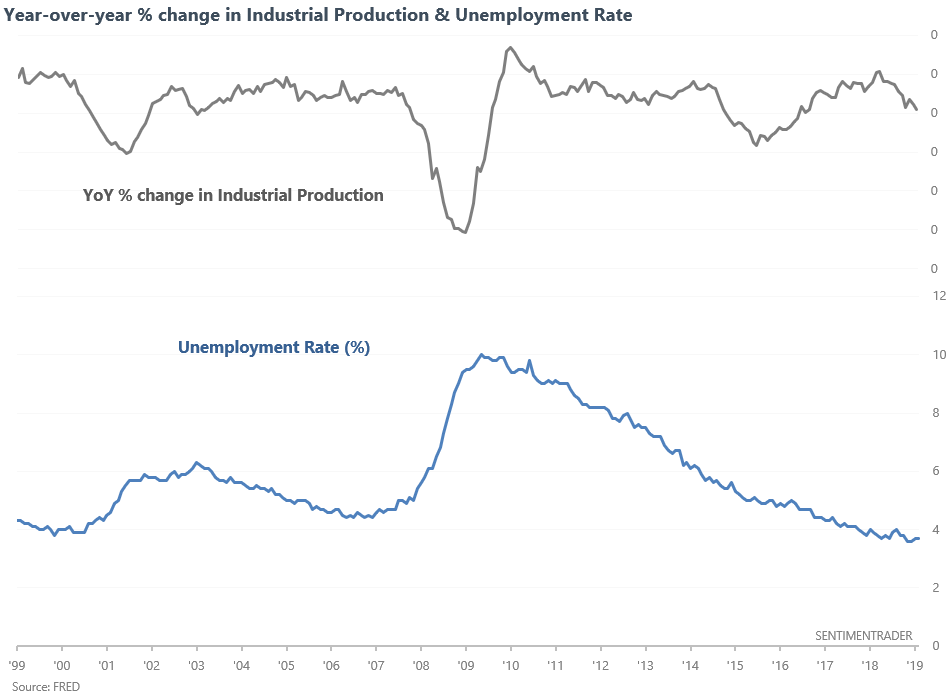
Let's look at manufacturing. Industrial Production's year-over-year change has fallen below 0.5%. On its own, this isn't worrisome. Industrial Production and manufacturing have plenty of false bearish signals. But when things go awry later in the economic expansion cycle (e.g. when Unemployment is under 5%), there's a bigger chance that "this is the real one".
Here's what happened next to the S&P when Industrial Production fell below 0.5%, while late-cycle in the economic expansion (Unemployment <5%).
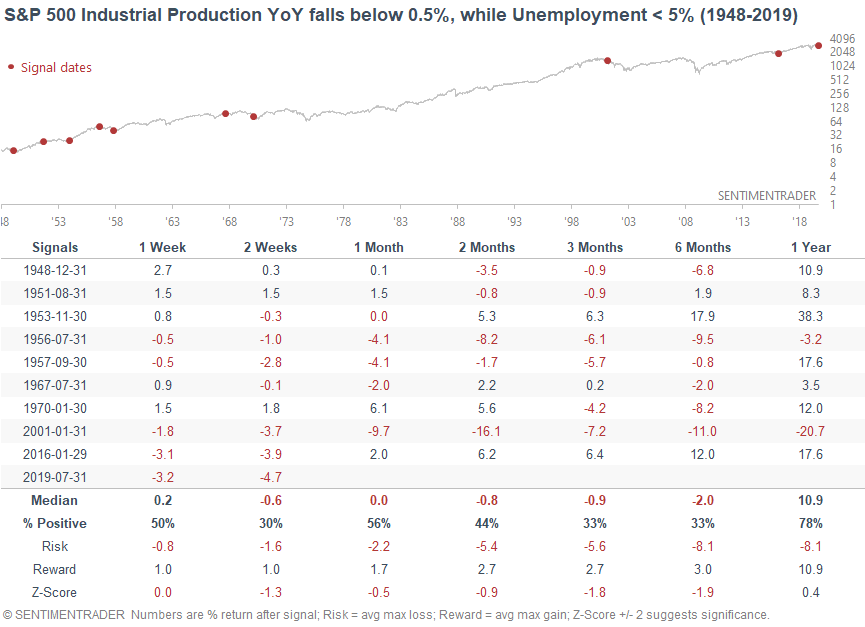
As you would expect, the S&P's returns over the next 3-6 months are more bearish than random. This indicator isn't meant for predicting the short term. As with most economic indicators, this is more useful when looking at a 6+ month time frame.
Weak manufacturing is a long term bearish factor for the stock market. However, I don't think this is a particularly important factor. Since the 1970s, manufacturing has not been a consistent leading indicator for the U.S. economy or stock market because the U.S. economy no longer relies on manufacturing. Not all economic indicators are of equal value, and an indicator's importance is related to the nature of its economy. For example, manufacturing indicators are much more important for the German and Chinese economies than the U.S. economy.
Housing recovery?
Housing is a key leading indicator for the U.S. economy. Since the economy and stock market move in the same direction in the long term, housing is also a useful long term leading indicator for the stock market. Housing deteriorated in the 2nd half of 2018, which (from a fundamental perspective) supported the Q4 2018 selloff.
But while many at the time thought that the bull market and economic recovery were done for, Bill McBride from Calculated Risk said that he wasn't even on recession watch. Based on his understanding, he said that the housing expansion would last into 2021 or 2022. Which would make this economic expansion by far the longest on record. This was (and still is) a rather contrarian point of view, because most market participants expected a recession to start in 2019 or 2020.
I highly respect Bill, and perhaps he will be right (his track record is also impressive). The NAHB Housing Market Index seems to be pulling out of a slump.
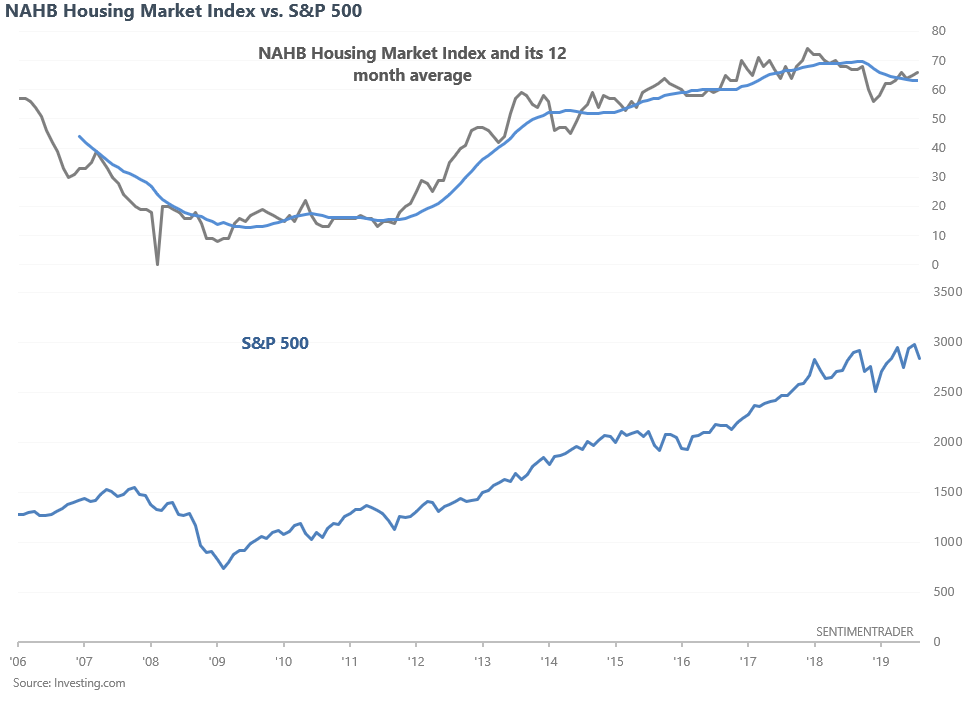
*Individual economic data points don't mean much, since individual readings have a lot of statistical noise. To properly understand economic data, it's better to look at the data's TREND. This can be done by taking a multi-month moving average of the data, or examining if the data is above or below a multi-month moving average.
The NAHB Index has now been above its 12 month average for 4 months in a row, after a slump in 2018.
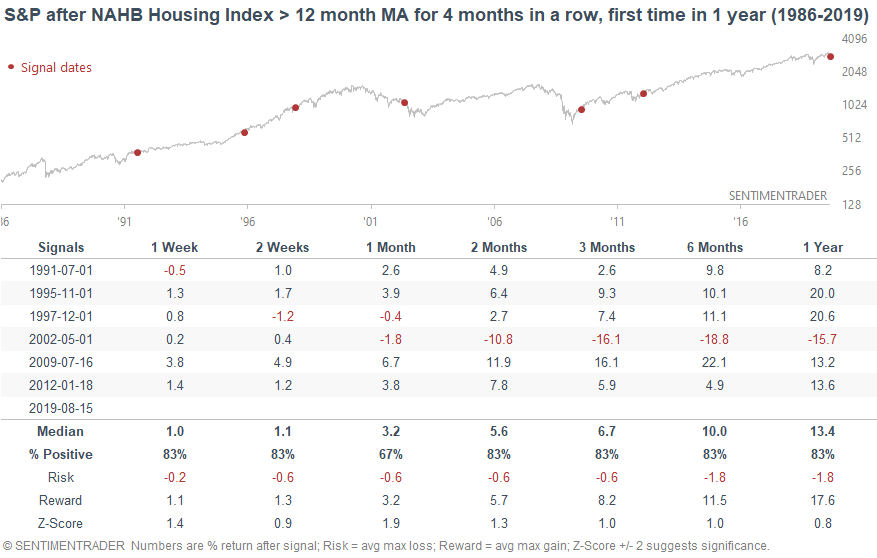
As you can see, this tends to happen near long term economic bottoms, or after false recession alarms:
- 2012, 2009, 2002, and 1991 occurred after recessions (2009-2012 saw a long bottom in housing)
- 1995 and 1997 saw false recession alarms (e.g. economic data was weak in the 2nd half of 1995)
I wouldn't consider housing to be a positive factor for the economy and stocks just yet. Wait for Housing Starts, Building Permits, and New Home Sales.
Dumb Money
Our Dumb Money Confidence index has fallen to the lowest level since January.
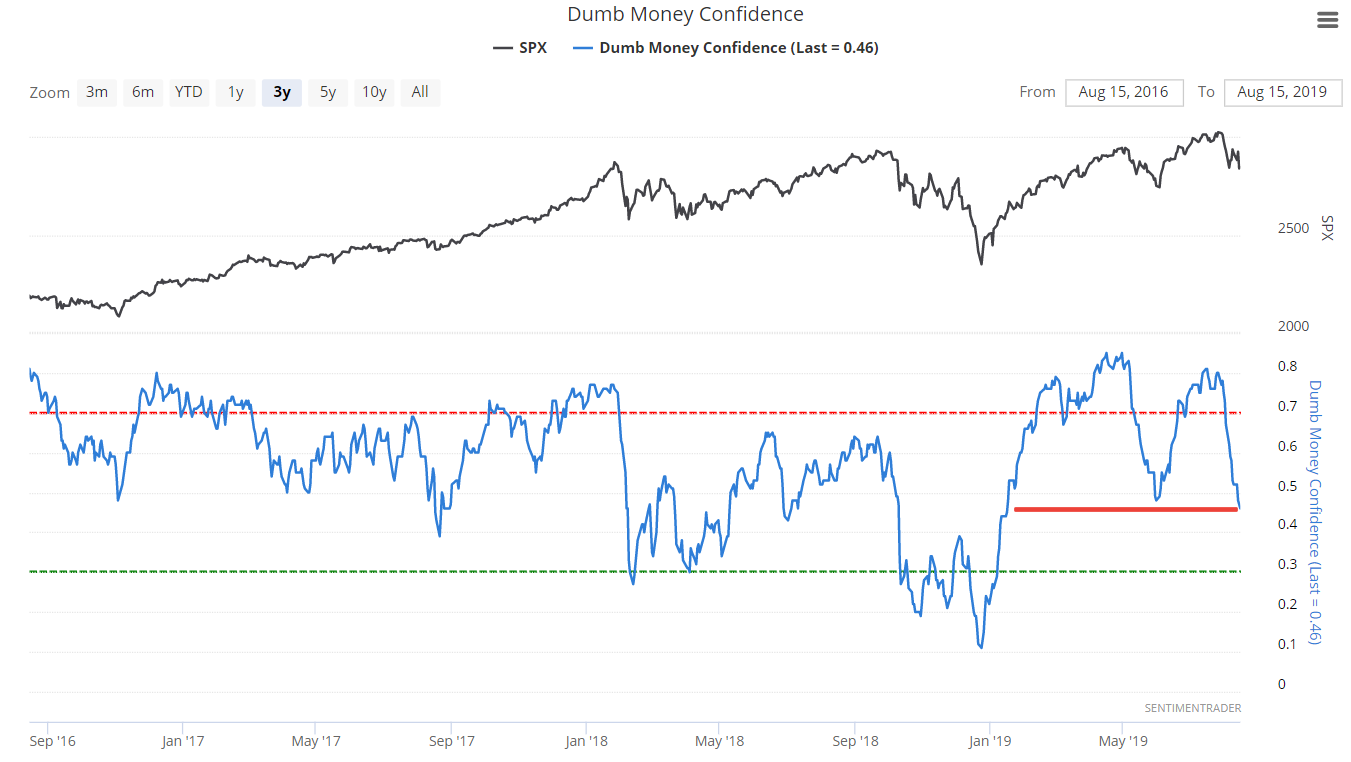
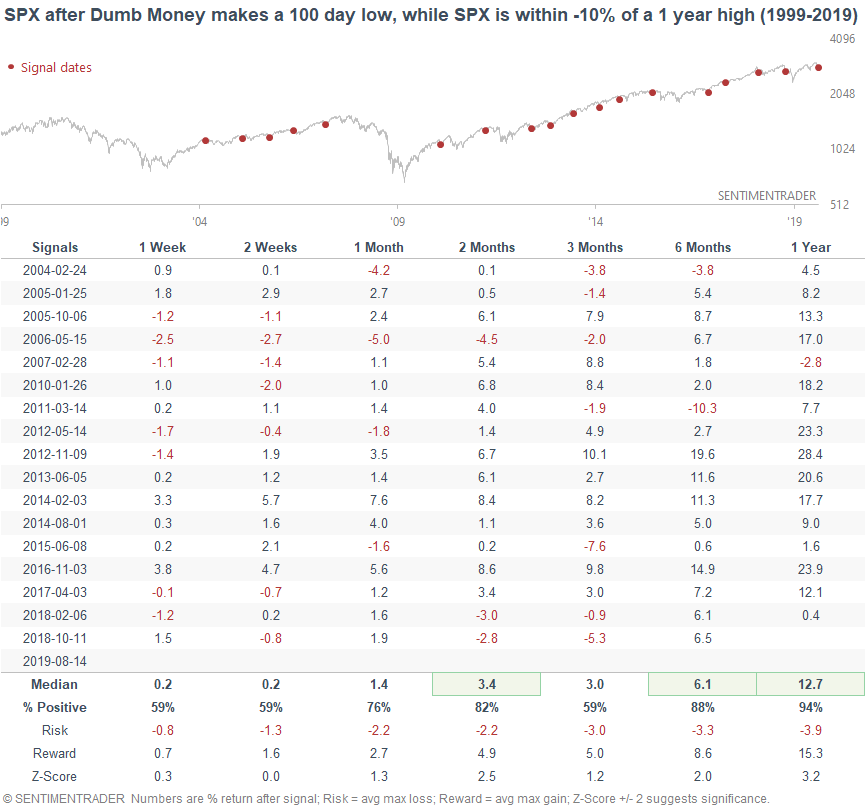
When this happened while the S&P was within 10% of a 1 year high, the S&P's 2 month forward returns were mostly bullish.
CNN Fear & Greed
As one would expect, sentiment is falling because the stock market is in a short term downtrend. CNN Fear & Greed, a popular sentiment indicator, continues to fall. Our proxy for this indicator has now fallen below 15
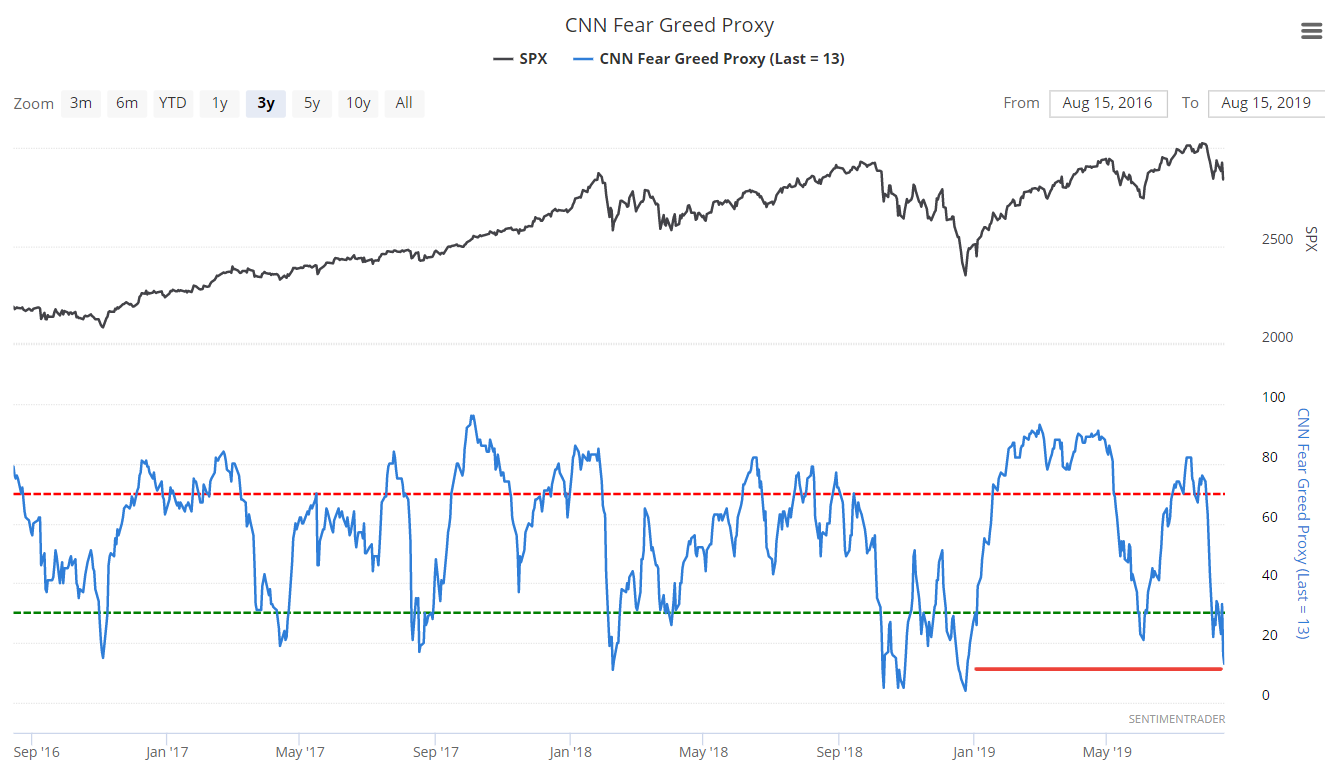
When this happened while the S&P was above its 200 day moving average (e.g. now), the S&P rallied 85% of the time 3 months later.
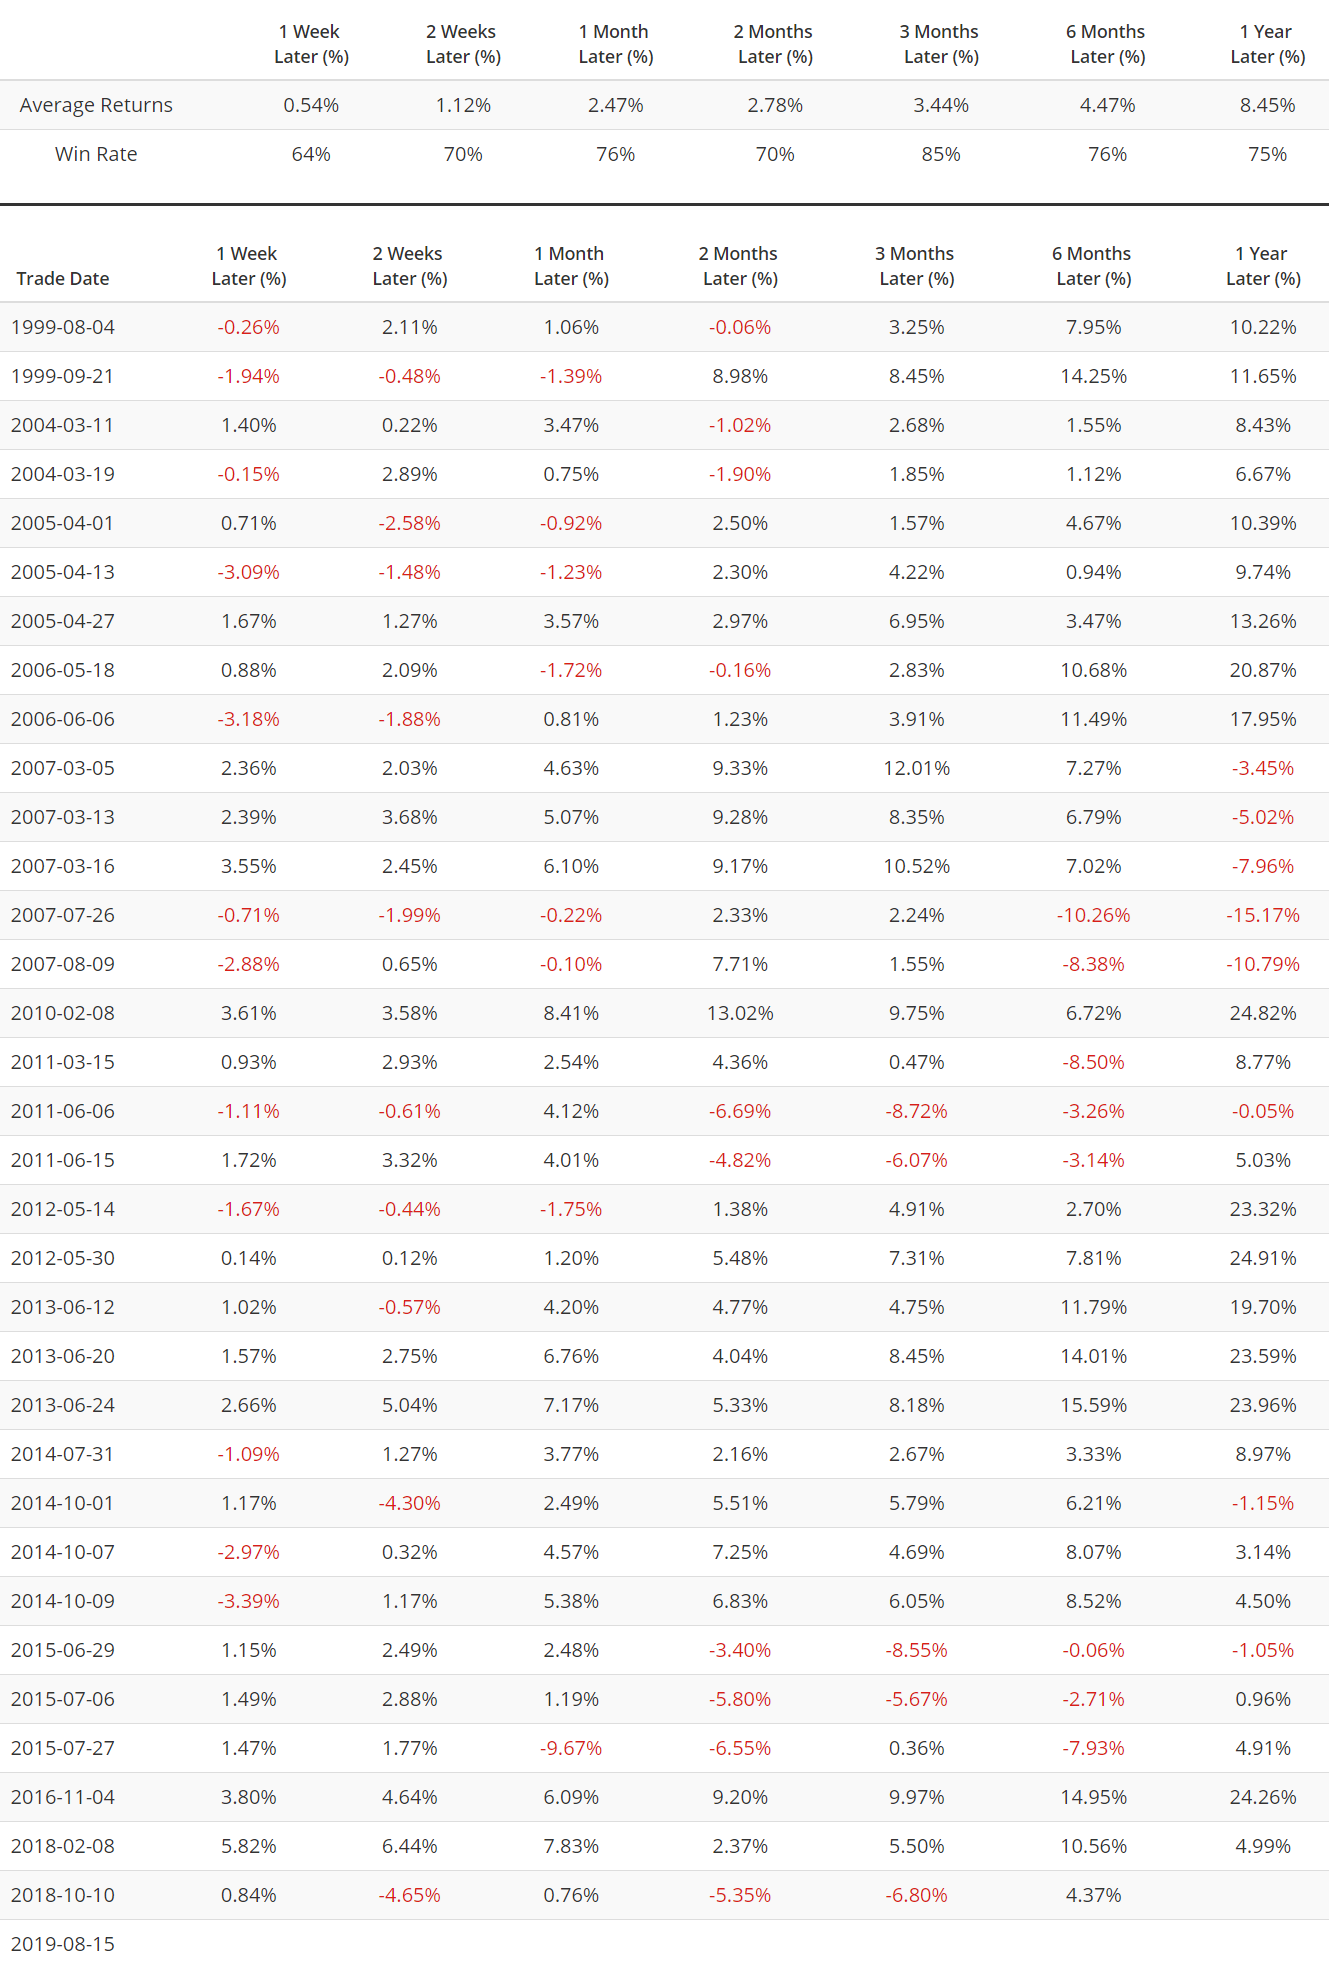
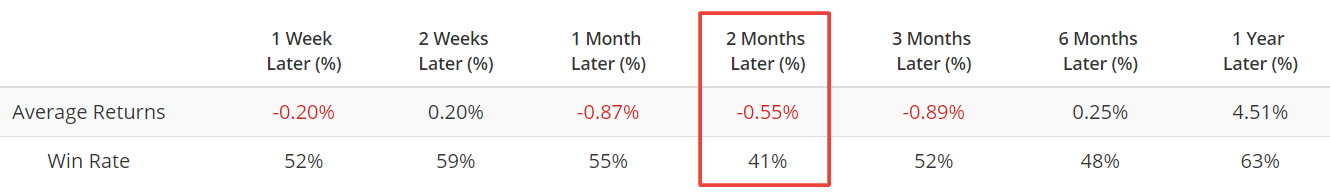
As is the case with most sentiment indicators, WHEN a signal occurs does matter. The same signal (Fear & Greed fell below 15) while the S&P is BELOW its 200 dma is somewhat bearish over the next 2 months.
Risk Appetite
And lastly, risk appetite remains low. Our Risk Appetite Index combines the Citigroup Macro Risk Index, Westpac Risk Aversion Index, and UBS G10 Carry Risk Index Plus to gauge how risk-on or risk-off investors and traders are right now. Based on this index, market participants are afraid of risk. (You can sense this implicitly with the surge in gold and bonds).
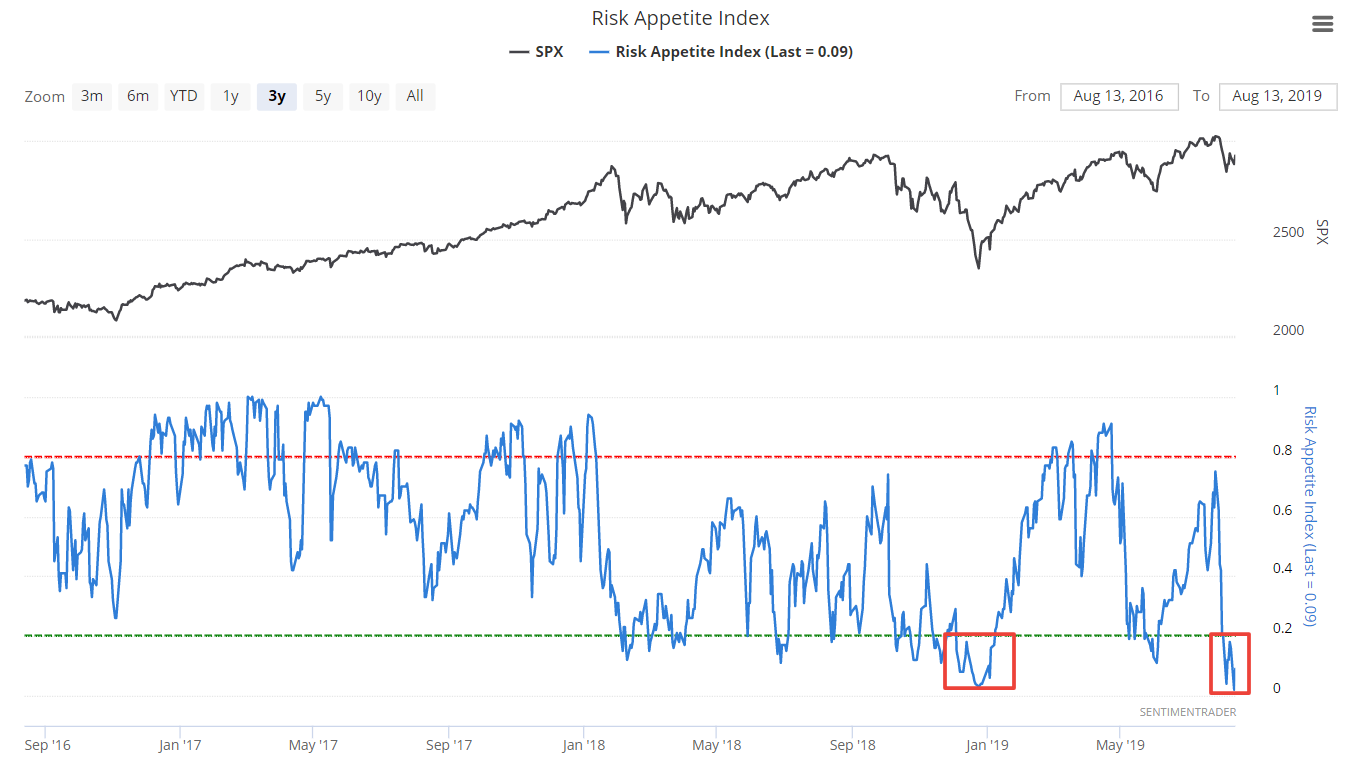
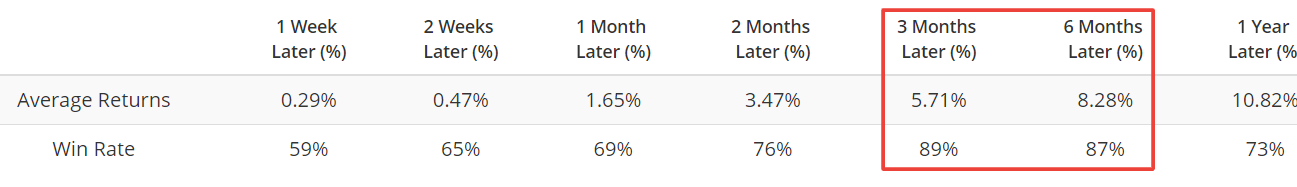
Risk Appetite readings below 0.1 (e.g. now) were mostly bullish for stocks over the next 3-6 months.
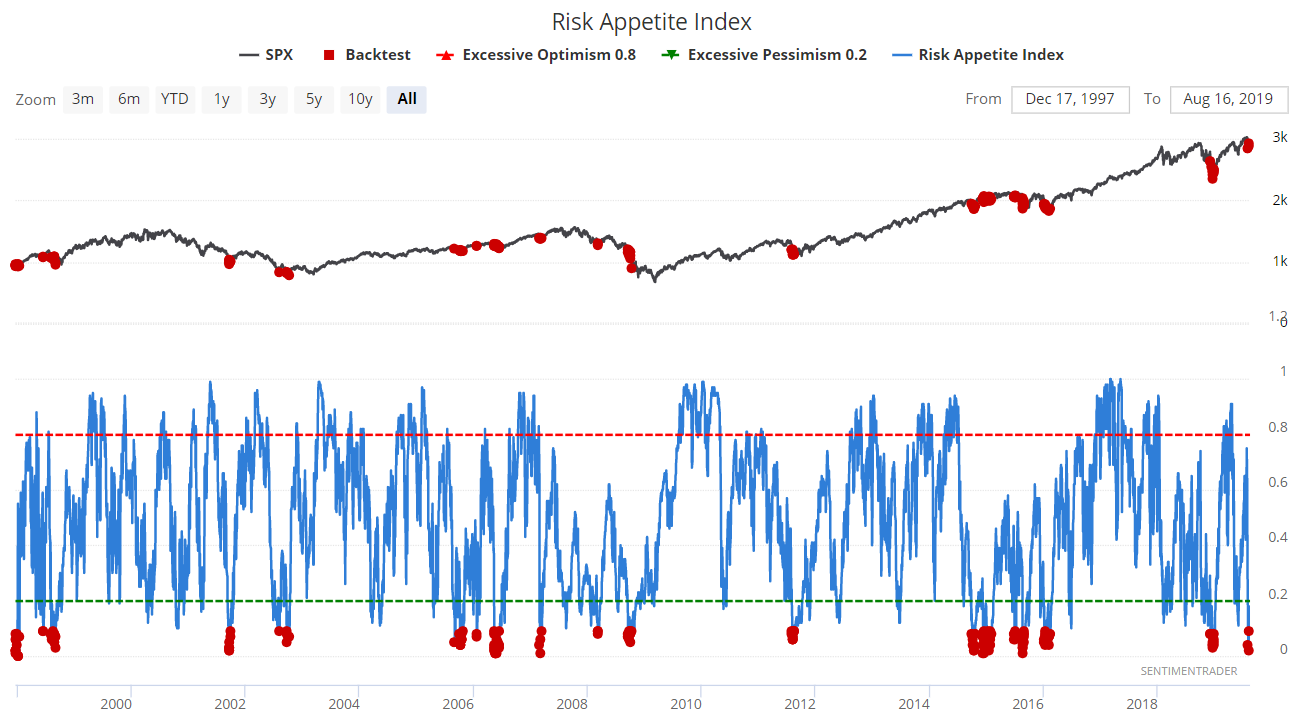
The big exception was during the September-October 2008 stock market crash. Personally, I don't think comparing today to September/October 2008 makes sense. The macro environment back then was much worse than it is right now.
Conclusion
I'll be looking at macro & technicals indepth during this weekend's market overview.