What I'm looking at - more MACD signals, economic policy uncertainty, Baltic Dry Index, copper:gold
Here's what I'm looking at:
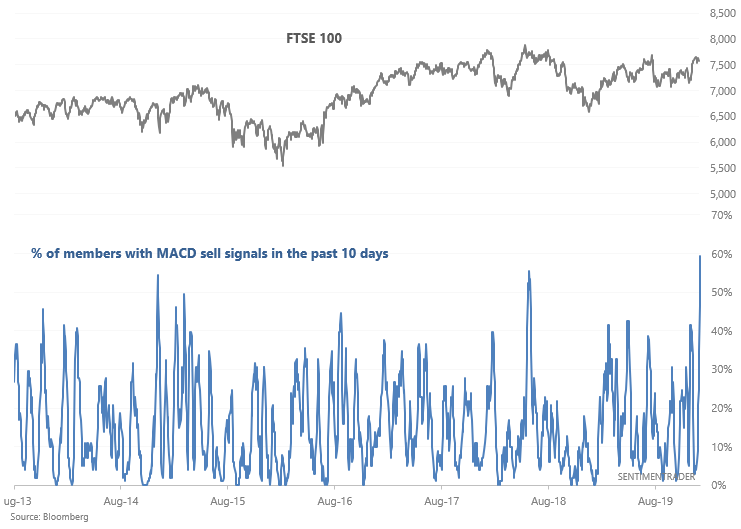
More MACD sell signals
As I mentioned yesterday, more and more stocks within U.S. stock market indices have triggered MACD sell signals in the past 10 days. And this isn't just confined to the U.S. - 59% of the FTSE 100 has experienced MACD sell signals in the past 10 days:
This is an extremely high amount of issues with MACD sell signals, and has only been matched 2 other times from 2002-present:
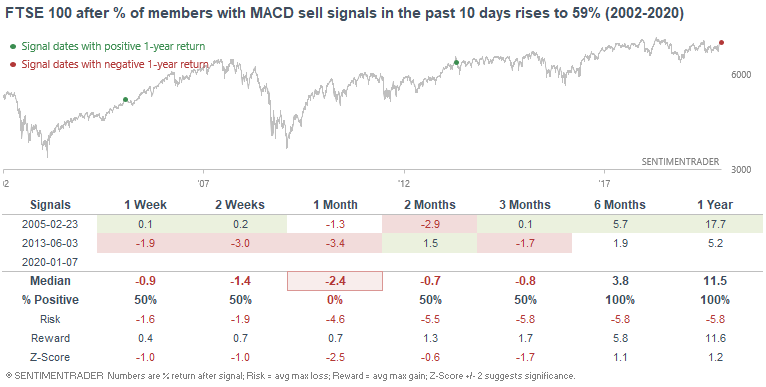
Both historical cases saw further losses over the next month with a terrible risk:reward ratio. However, it's hard to believe a study with sample size n=2. So if we relax the parameters to increase the sample size:
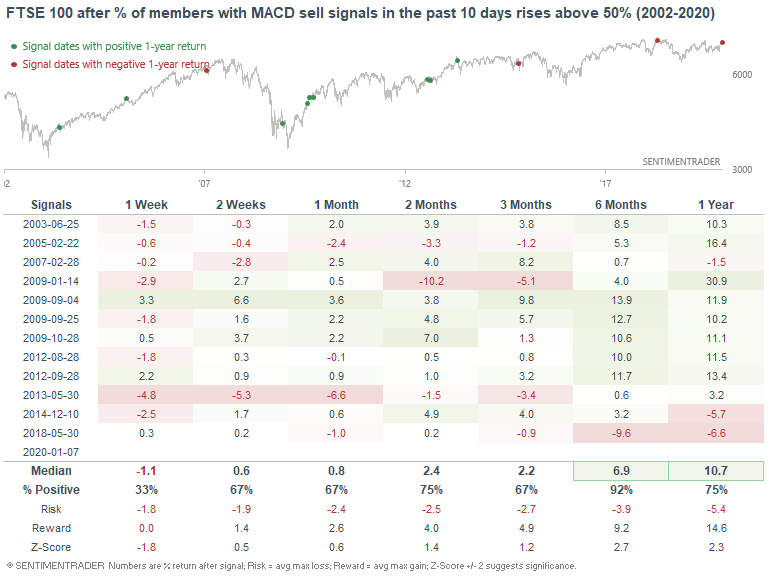
The FTSE 100's returns over the next month weren't consistently bearish. As I mentioned yesterday, this indicator has been successful at predicting some recent pullbacks, but before that wasn't really effective.
Economic Policy Uncertainty
Political and economic policy uncertainty has been consistently elevated over the past 2 years due to the global economic slowdown and ongoing trade war. But now that the narrative has shifted towards the potential for an economic rebound and a de-escalation of the trade war, uncertainty is decreasing.
The U.S. Economic Policy Uncertainty Index is now extremely low:
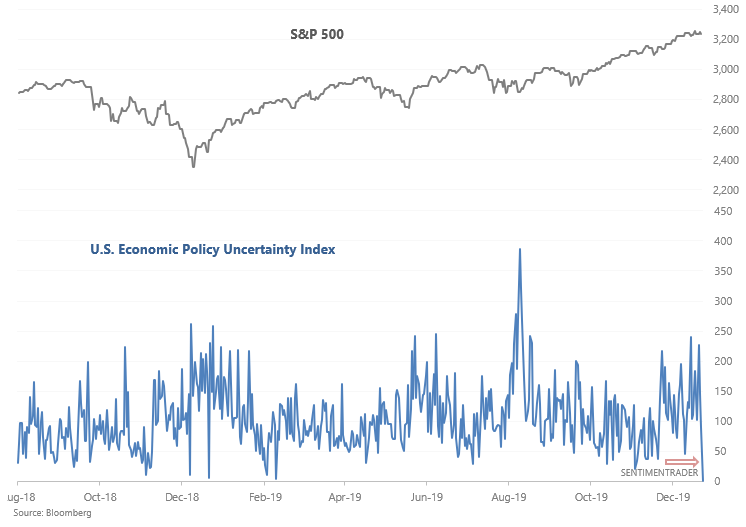
True to contrarian form, this often (but not always) led to trouble in the stock market:
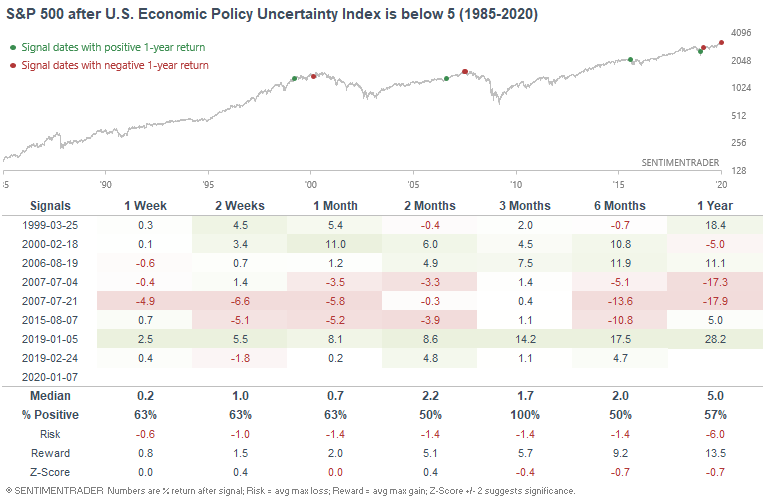
- 2000: came close to marking the bull market's top
- 2007: came close to marking the bull market's top
- 2015: just before stocks tanked
Overall, the shifting of narratives isn't a bullish sign for stocks. Last year everyone was afraid of a "recession, earnings recession, yield curve inversion, etc." Now, it seems that this sort of talk has mostly disappeared.
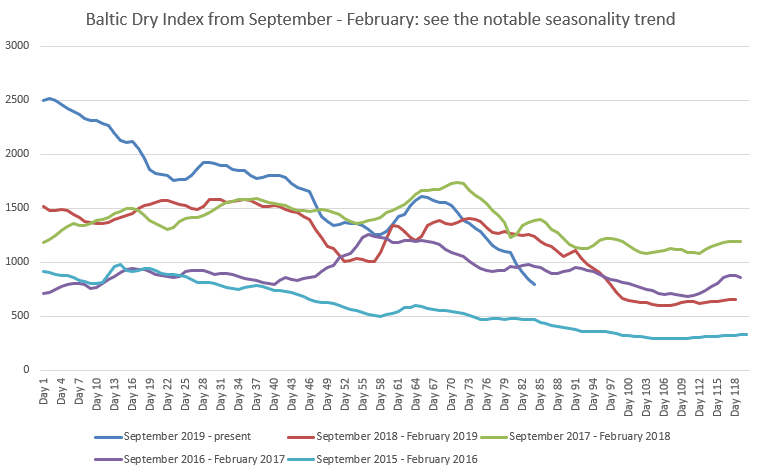
Baltic Dry Index
The Baltic Dry Index is one of those indices which gets no attention until its falling. When it does fall, people start to point out "SHIPPING BELLWEATHER IS SLIDING! RECESSSIONNNN!!"
But in all seriousness, here's the S&P 500 vs. the Baltic Dry Index over the past 5 months:
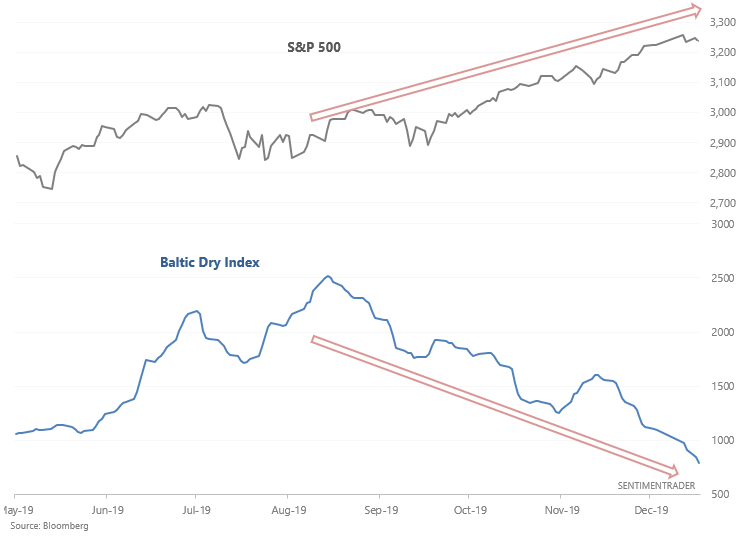
When the Baltic Dry Index fell more than -60% over a 4 month period while the S&P rallied, it wasn't a consistently bearish factor for the stock market.
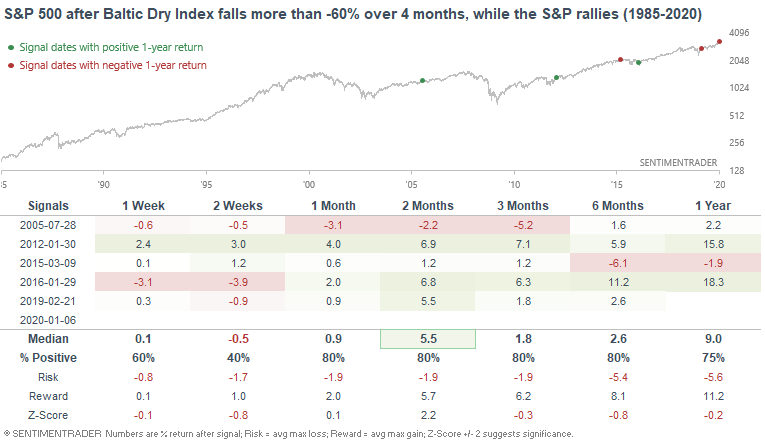
Seasonality factors are weighing down on the Baltic Dry Index, so this isn't quite a sign that "the global economy is going off the rails". The Baltic Dry Index has a strong tendency to fall from Q4 of each year to Q1 of the next year. Hence why most of the historical cases occurred from January-March:
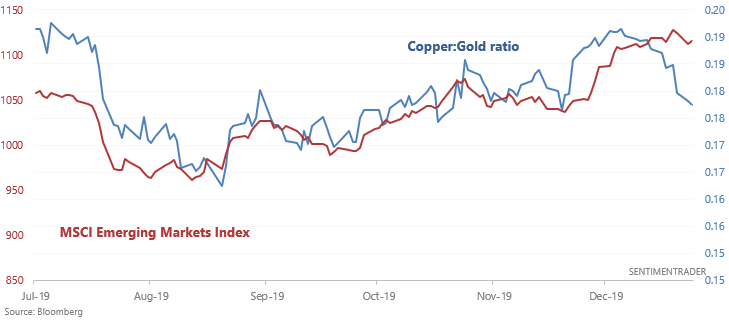
More divergences
Speaking of divergences, the Wall Street Journal noted that the copper:gold ratio has fallen over the past 2 weeks while emerging markets equities have held steady. Perhaps the copper:gold ratio is implying that emerging markets will soon follow suit?
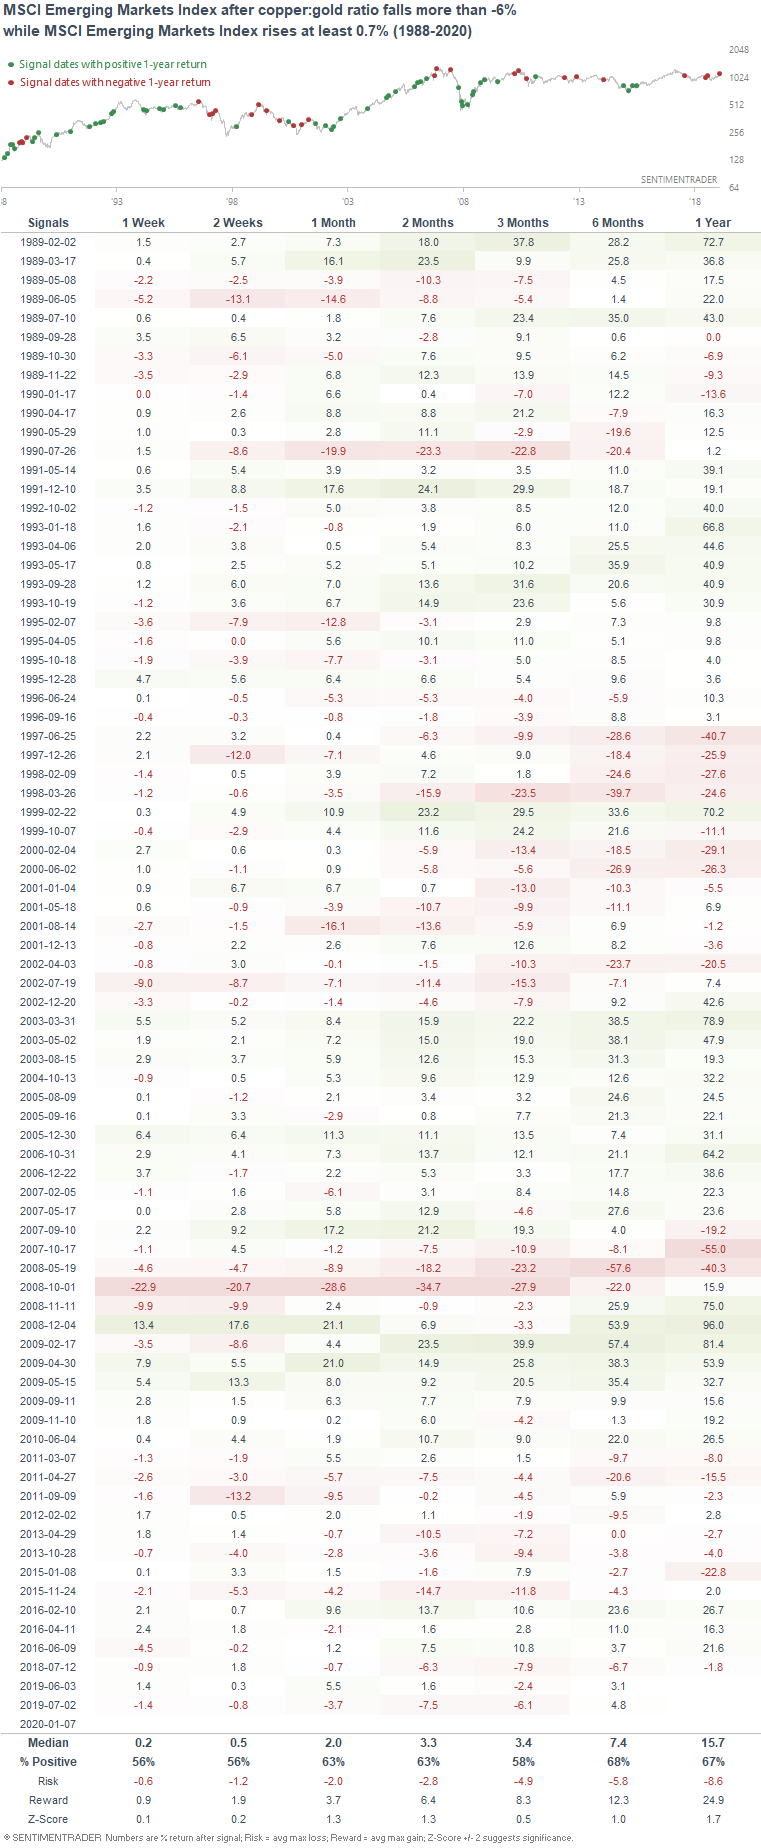
When we look at historical cases in which the copper:gold ratio diverged from the MSCI Emerging Markets Index, it's clear that this wasn't consistently bullish or bearish for emerging market equities. Most divergences simply don't amount to much.
My trading portfolio
My trading portfolio is allocated 50% in the Macro Index Model and 50% in the Simple Trading Model With Fundamentals. At the moment I have instituted a discretionary override and gone 100% long bonds (instead of long stocks) due to the extreme nature of many of our core indicators, even though some of these core indicators aren't in the models.
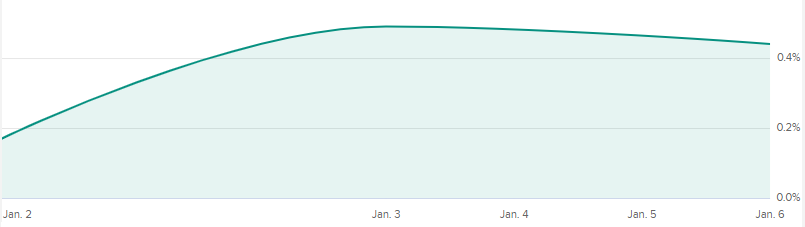
Performance in 2020 through to January 6, 2020:
- My trading account is up 0.44%
- Currently 100% in bonds