
What I'm looking at - OECD, advance-decline line, VIX, NASDAQ models + sentiment indicators
With stocks barely moving, here's what I'm looking at:
OECD Composite Leading Indicator
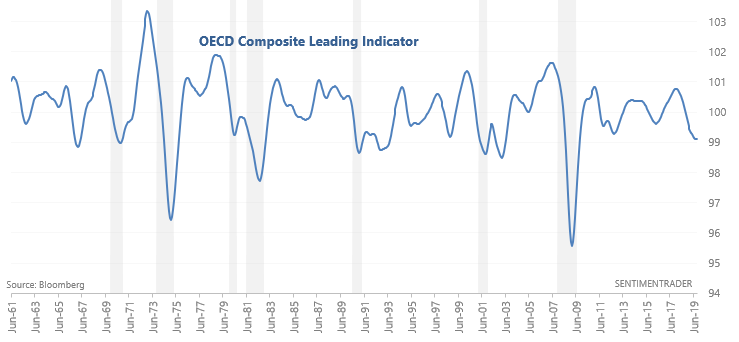
As the WSJ noted, the OECD Composite Leading Indicator is showing signs of stabilization. This indicator looks at Consumer Confidence, interest rate spreads, new orders, manufacturing, among others.

While it isn't particularly effective at timing market tops, upturns in the OECD Composite Leading Indicator after a long downturn usually marked bottoms in the global economy. Here's a longer term look at this chart, from 1961-present:
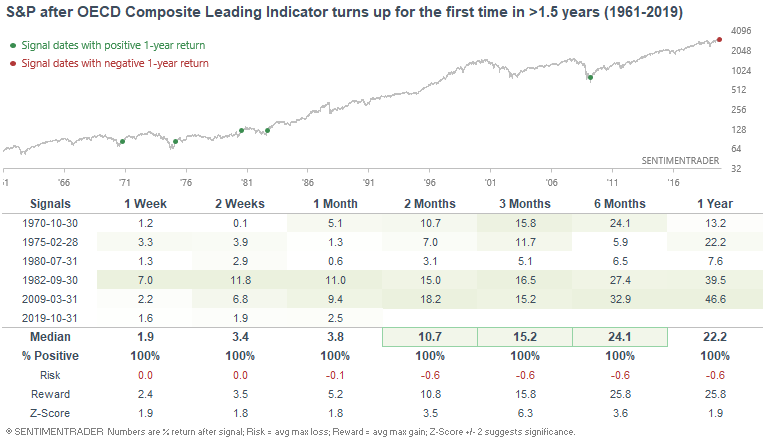
When the OECD Composite Leading Indicator turns up for the first time in more than 18 months, the S&P' returns over the next half year were mostly pristine since this typically happened after a recession:
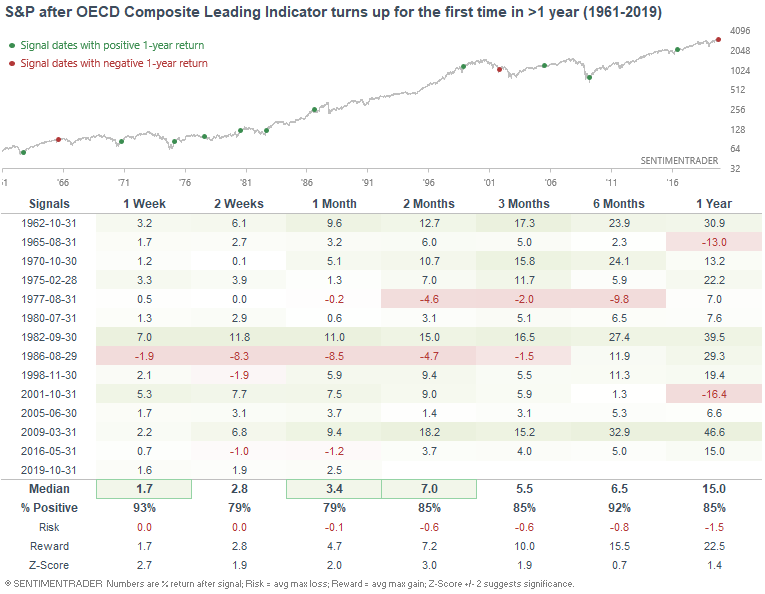
If we loosen the parameters to increase the sample size, the S&P's returns over the next 6 months were still mostly bullish:
Advance-decline
With the U.S. stock market trending higher this year, the NYSE Advance-Decline Line has been consistently making new highs:
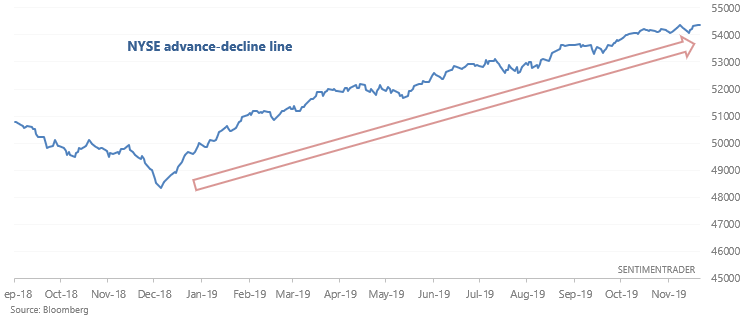
This breadth indicator typically trends lower before bear markets begin (e.g. 2000 and 2007). If we look at cases in which the NYSE Advance-Decline Line consistently made new highs over the past year, the S&P's returns over the next year were mostly bullish. The one bearish case was in February 2007, but even then the stock market made new highs for another 8 months before it peaked:
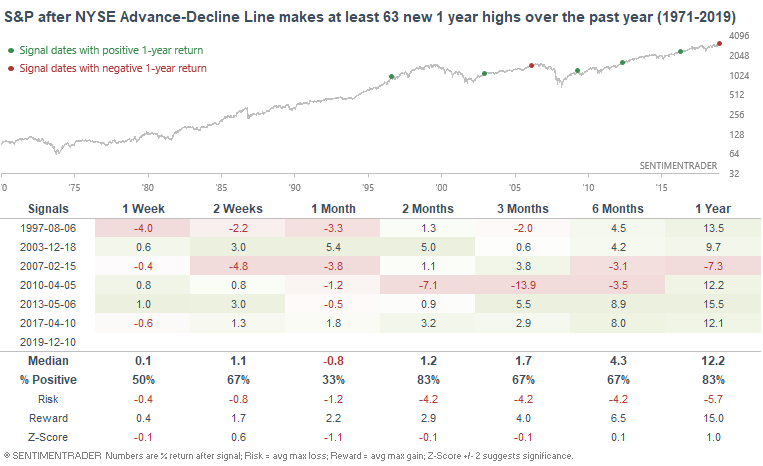
The upwards trending Advance-Decline Line continues to suggest that the bull market's top is not in.
VIX
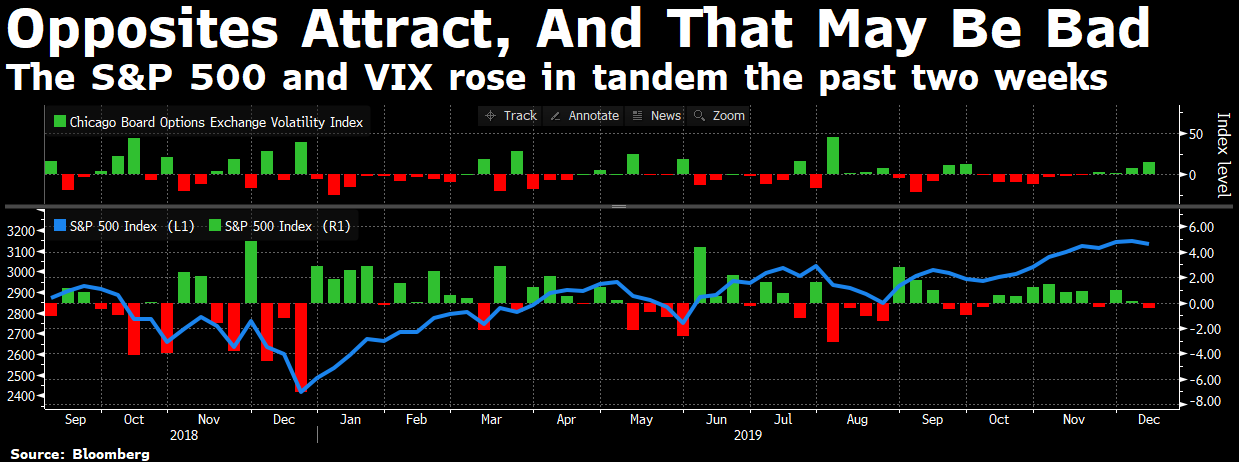
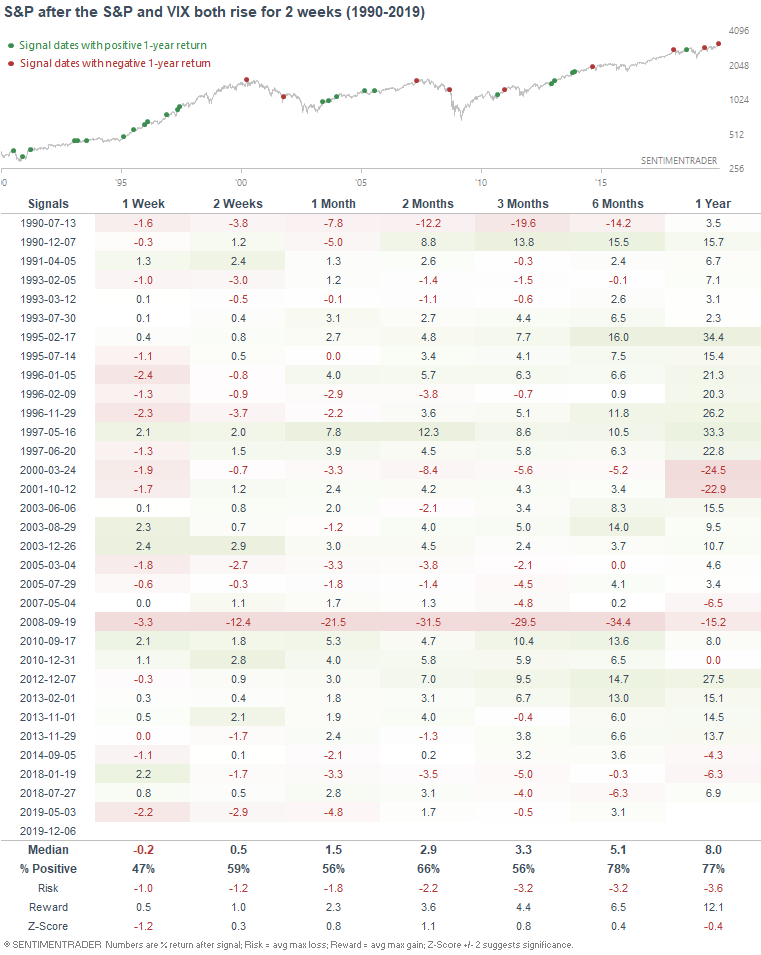
As Bloomberg noted, both the S&P and VIX have gone up together over the past 2 weeks, which could be a short term bearish sign for stocks. The last time this happened was in May 2019, just as stocks pulled back:
If we run the numbers, this has been a slight bearish factor for the S&P over the next week, but it hasn't been terribly or consistently bearish.
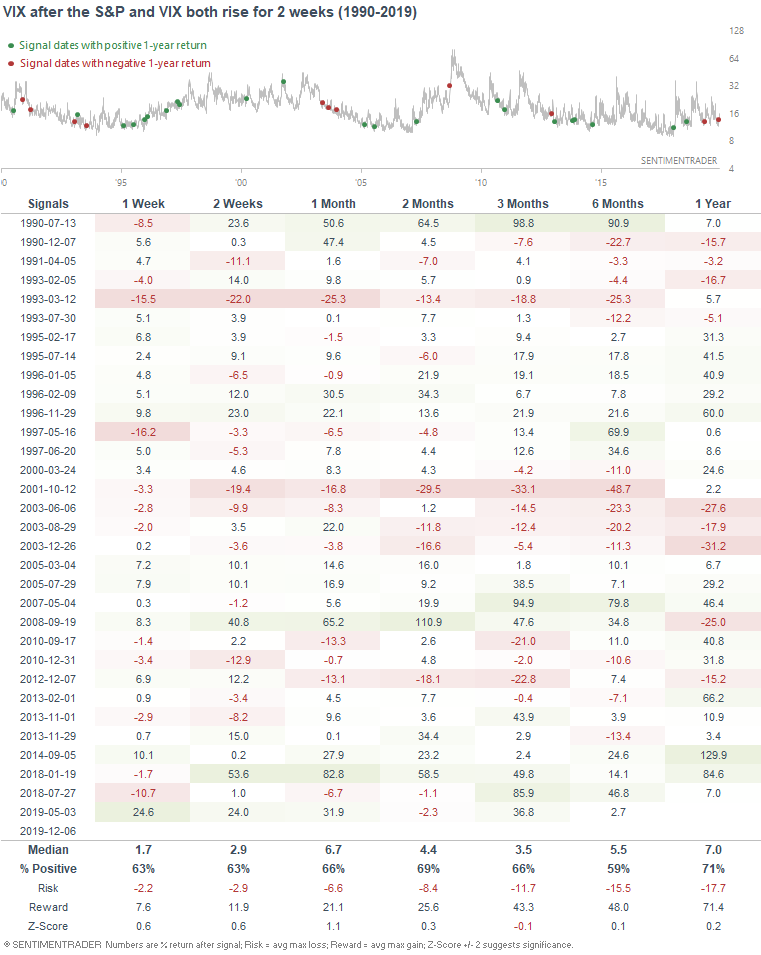
And while this has been slightly more bullish than random for VIX over the next month, the edge isn't terribly strong either.
Applying sentiment indicators to NASDAQ models
Last week I looked at applying the Stock/Bond ratio and NYSE HiLo Logic Index to various models. The results were pretty universal, regardless of which model you applied this indicators to. Applying these 2 models:
- Increased each model's returns
- Increased each model's Sharpe ratio
In this post we're going to do the same thing, but instead of buying the S&P 500 when the model is long stocks, the model will buy the NASDAQ 100. Everything else remains the same.
Simple Trading Model With Fundamentals (NASDAQ 100 version) + 2 sentiment indicators
Average annual returns
From December 30, 1988 - August 1, 2019:
- The original Simple Trading Model With Fundamentals has an average annual return of 18.69% per year
- Simple Trading Model With Fundamentals (+Stock/Bond ratio and NYSE HiLo Logic Index) has an average annual return of 20.68% per year
*These returns do not include the NASDAQ 100's dividends reinvested. Including dividends reinvested, average annual returns would be higher.
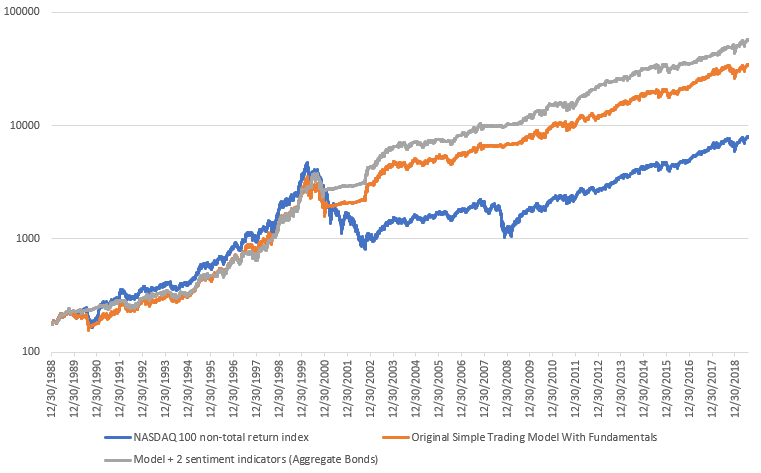
Sharpe ratio
From December 30, 1988 - August 1, 2019:
- The original Simple Trading Model With Fundamentals has a Sharpe ratio of 0.76
- Simple Trading Model With Fundamentals (+Stock/Bond ratio and NYSE HiLo Logic Index) has a Sharpe ratio of 0.98
*These Sharpe ratios are lower than what you might expect, since they do not include the NASDAQ 100's dividends reinvested. Including dividends reinvested, Sharpe would be higher.
Macro Index Model (NASDAQ 100 version) + 2 sentiment indicators
Average annual returns
From December 30, 1988 - August 1, 2019:
- The original Macro Index Model has an average annual return of 17.54% per year
- Macro Index Model (+Stock/Bond ratio and NYSE HiLo Logic Index) has an average annual return of 18.53% per year
*These returns do not include the NASDAQ 100's dividends reinvested. Including dividends reinvested, average annual returns would be higher.
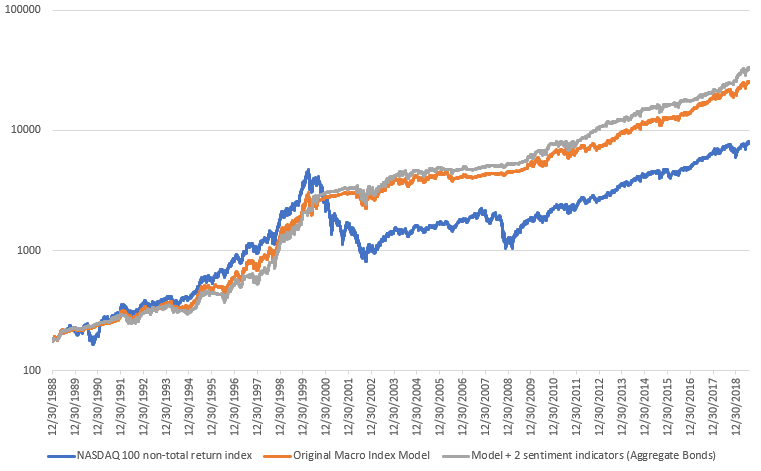
Sharpe ratio
From December 30, 1988 - August 1, 2019:
- The original Macro Index Model has a Sharpe ratio of 0.76
- Simple Trading Model With Fundamentals (+Stock/Bond ratio and NYSE HiLo Logic Index) has a Sharpe ratio of 0.91
*These Sharpe ratios are lower than what you might expect, since they do not include the NASDAQ 100's dividends reinvested. Including dividends reinvested, Sharpe would be higher.
Conference Board LEI Model (NASDAQ 100 version) + 2 sentiment indicators
Average annual returns
From December 30, 1988 - August 1, 2019:
- The original Conference Board LEI Model has an average annual return of 17.33% per year
- Conference Board LEI Model (+Stock/Bond ratio and NYSE HiLo Logic Index) has an average annual return of 18.8% per year
*These returns do not include the NASDAQ 100's dividends reinvested. Including dividends reinvested, average annual returns would be higher.
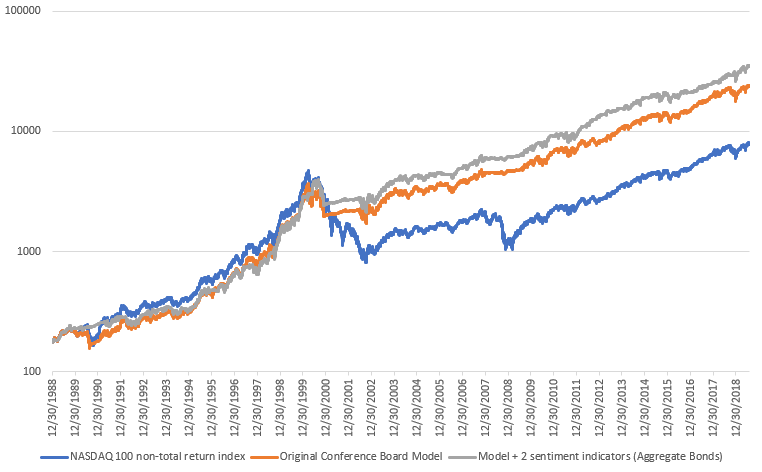
Sharpe ratio
From December 30, 1988 - August 1, 2019:
- The original Conference Board LEI Model has a Sharpe ratio of 0.71
- Conference Board LEI Model (+Stock/Bond ratio and NYSE HiLo Logic Index) has a Sharpe ratio of 0.86
*These Sharpe ratios are lower than what you might expect, since they do not include the NASDAQ 100's dividends reinvested. Including dividends reinvested, Sharpe would be higher.
My trading portfolio
I've been moving countries and changing residencies over the past half year, so I haven't done much trading up until a month ago. Now that I've settled down, I've reopened trading accounts. In the interest of transparency, I'm going to show you what my own trading portfolio is doing, similar to what Jason does.
From October 25 (when I started to trade again) - present:
- My account is up 2.47%
- Currently 100% in bonds
I don't place discretionary trades - these are purely based on my quantitative models.