What I'm looking at - sentiment, McClellan Summation, new highs, liquidity premium
Here's what I'm looking at:
Sentiment
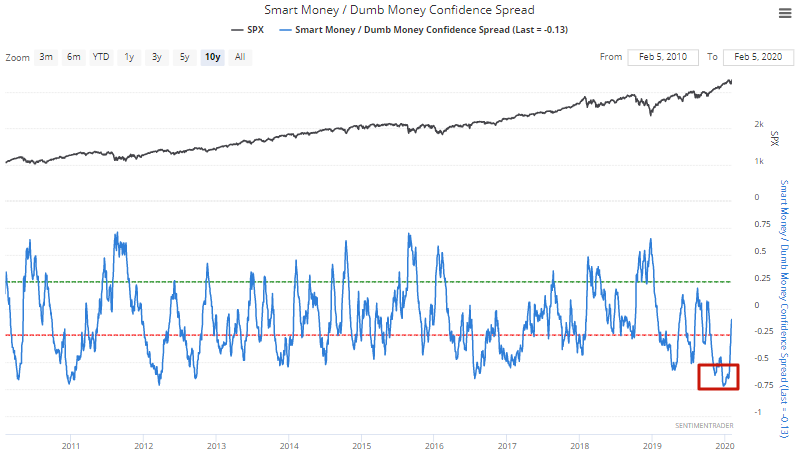
Sentiment has been extremely optimistic over the past few months, which has prompted us to consistently point to the large possibility of a pullback/correction.
But now that the S&P has made a small pullback and then made a new all-time high (on a daily CLOSE basis), it begs the question "is that it?" Is this all that we can expect from the "long overdue pullback", or will stocks fall more? Is it normal for sentiment to be crazy extreme, and stocks to only fall a little?
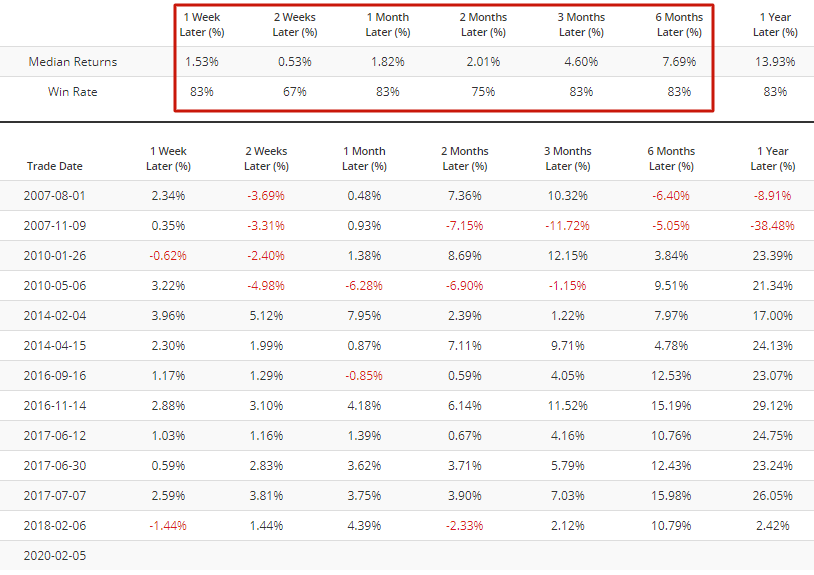
The following table looks at cases in which the Smart Money/Dumb Money Confidence spread was under -0.6 (i.e. extreme optimism), the S&P made a small 2-5% pullback, and then made a new high:
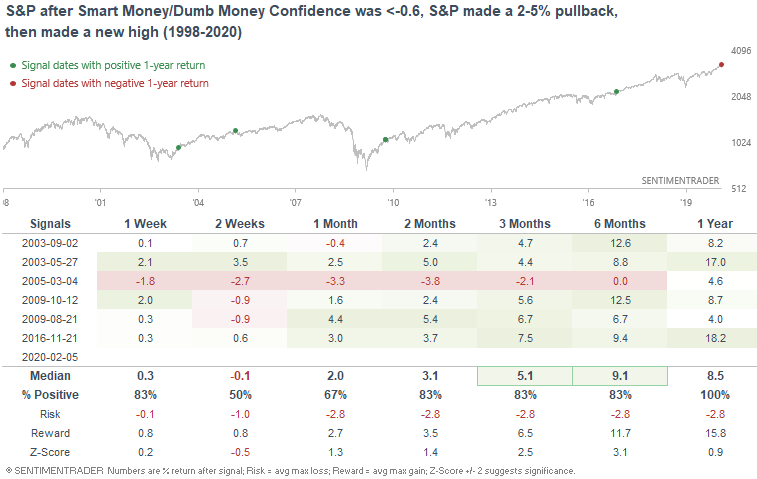
The sample size is small, so it's hard to draw a clear conclusion. While it did sometimes lead to more losses over the next 2 weeks, on a 3-6 month forward basis the S&P usually went higher. Overall, I think this implies that even if the stock market falls more, it won't be a big/protracted decline.
McClellan Summation
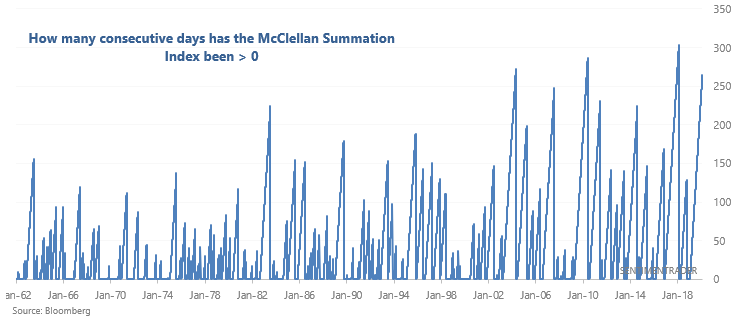
The U.S. stock market's rally since December 2018 has been very persistent, causing long term breadth indicators like the McClellan Summation Index to stay consistently positive:
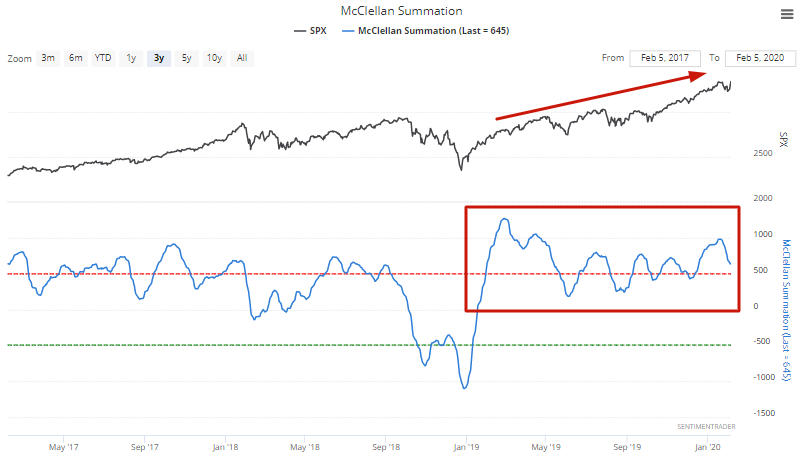
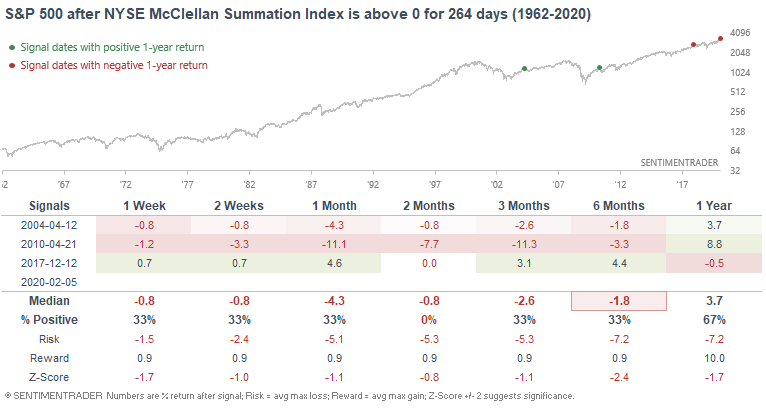
This streak of positive McClellan Summation readings is in rarefied air:
The 3 other times the McClellan Summation Index was positive for so long, stocks either fell immediately, or melt-up and then tanked.
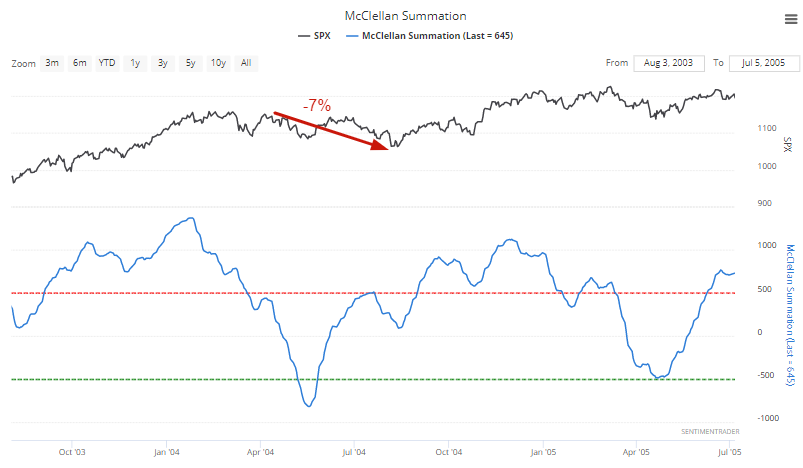
Here's the 2004 case:
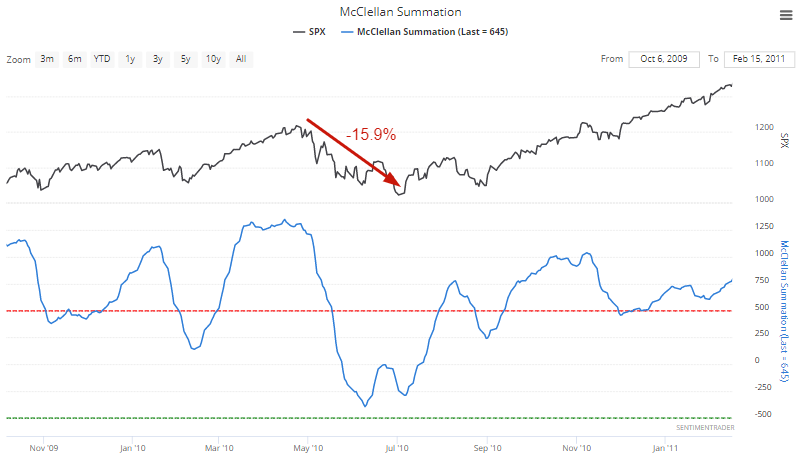
Here's the 2010 case:
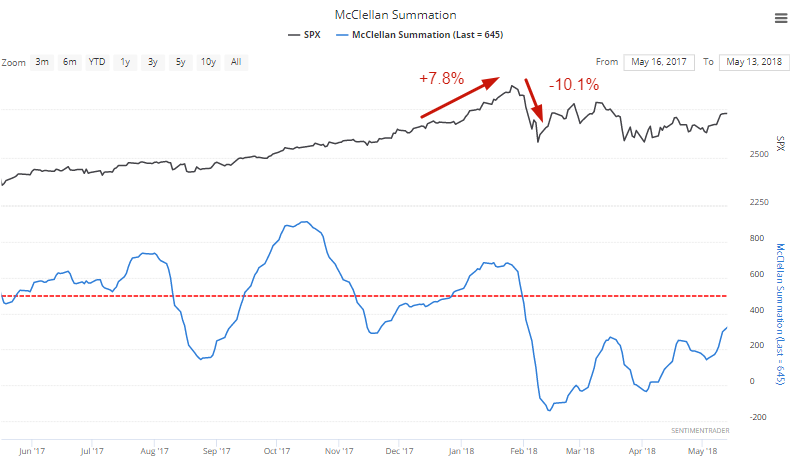
Here's the 2017 case:
New highs
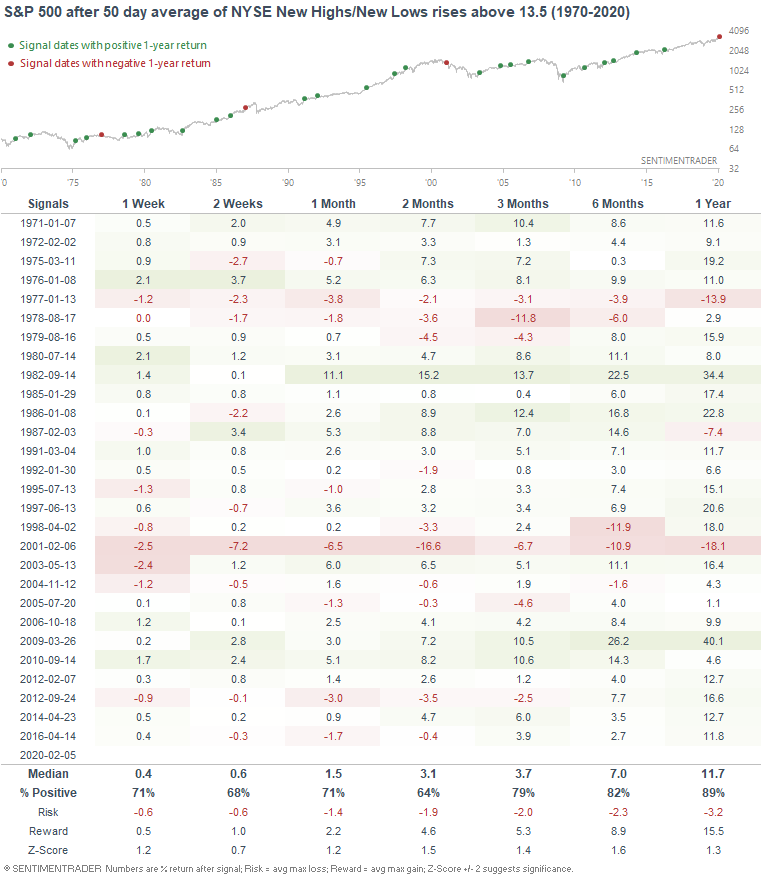
As the S&P makes new highs, the NYSE New Highs/New Lows ratio's 50 dma has risen above 13.5:
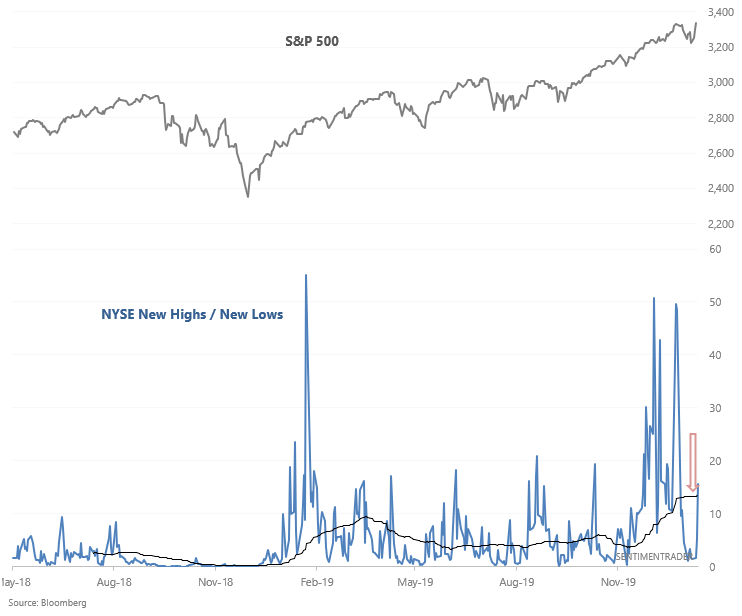
When there were consistently a lot of new highs vs. new lows, the S&P typically rallied over the next 3-12 months. This basically implies that shorting a strong uptrend is very hard. Momentum remains on the side of bulls.
Liquidity Premium
And lastly, QQQ liquidity premium is quite high right now, which is rare given that the stock market is at all-time highs.
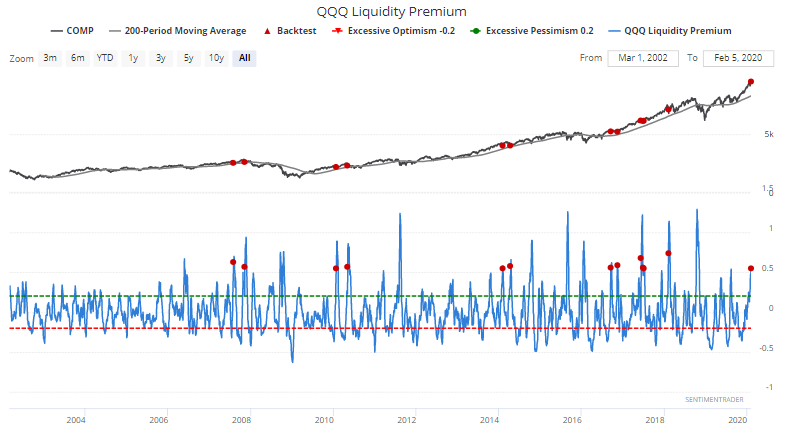
*Liquidity Premium measures the volume of ETFs vs. the volume of their underlying stocks. When the volume in ETFs is high relative to the volume in underlying stocks (i.e. liquidity premium is high), it suggests that there is uncertainty in the market as traders rush towards more liquid ETFs.
When QQQ Liquidity Premium reached 0.55 while the NASDAQ was above its 200 dma, the NASDAQ usually rallied in the weeks and months ahead. Once again, this is rare when the NASDAQ is at an all-time high.
My trading portfolio
My trading portfolio is allocated 50% in the Macro Index Model and 50% in the Simple Trading Model With Fundamentals. At the moment I have instituted a discretionary override and gone 100% long bonds (instead of long stocks) due to the extreme nature of many of our core indicators, even though some of these core indicators aren't in the models.
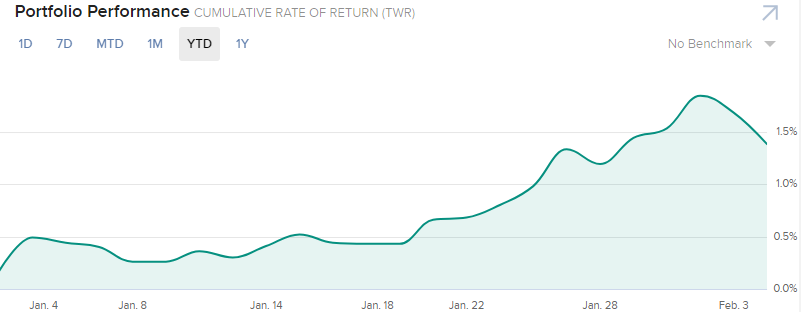
Performance YTD 2020:
- My trading account is up 1.38%
- Currently 100% in bonds