
What I'm looking at - Titanic Syndrome, U.S. breadth, overseas breadth, biotech, VIX jump, seasonality
Here's what I'm looking at:
Titanic Syndrome
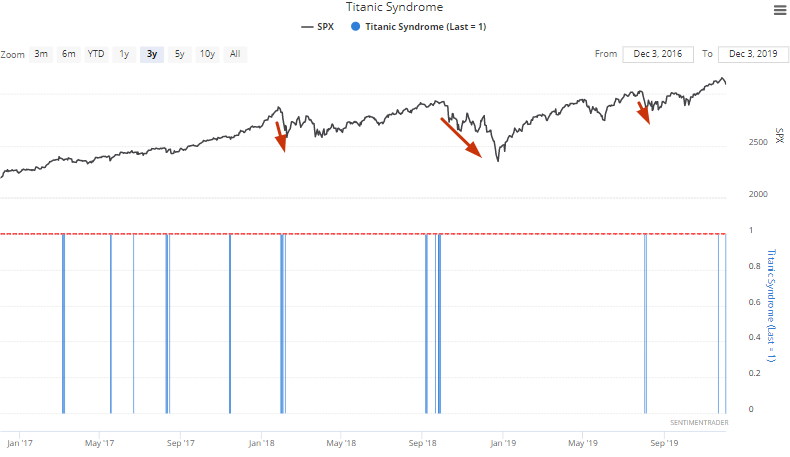
Jason has looked at the Hindenburg Omen and Titanic Syndrome in recent weeks, and these bearish symptoms remain. A Titanic Syndrome signal triggered again yesterday.
These signals have been particularly accurate over the past 2 years, with each instance resulting in a meaningful pullback or correction.
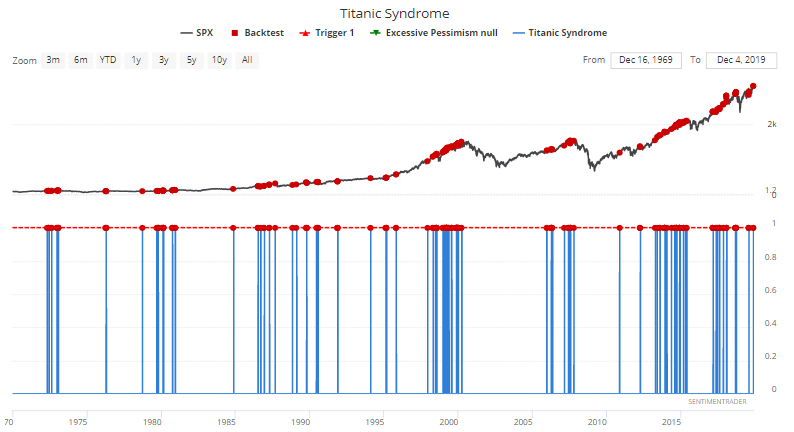
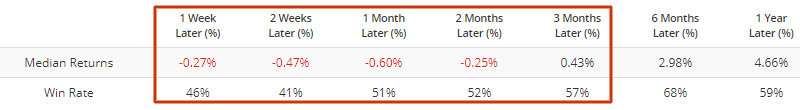
Once again, historical cases in which the Titanic Syndrome triggered saw worse than average returns for the stock market in the weeks and months ahead, during which it was better to hold bonds than stocks.
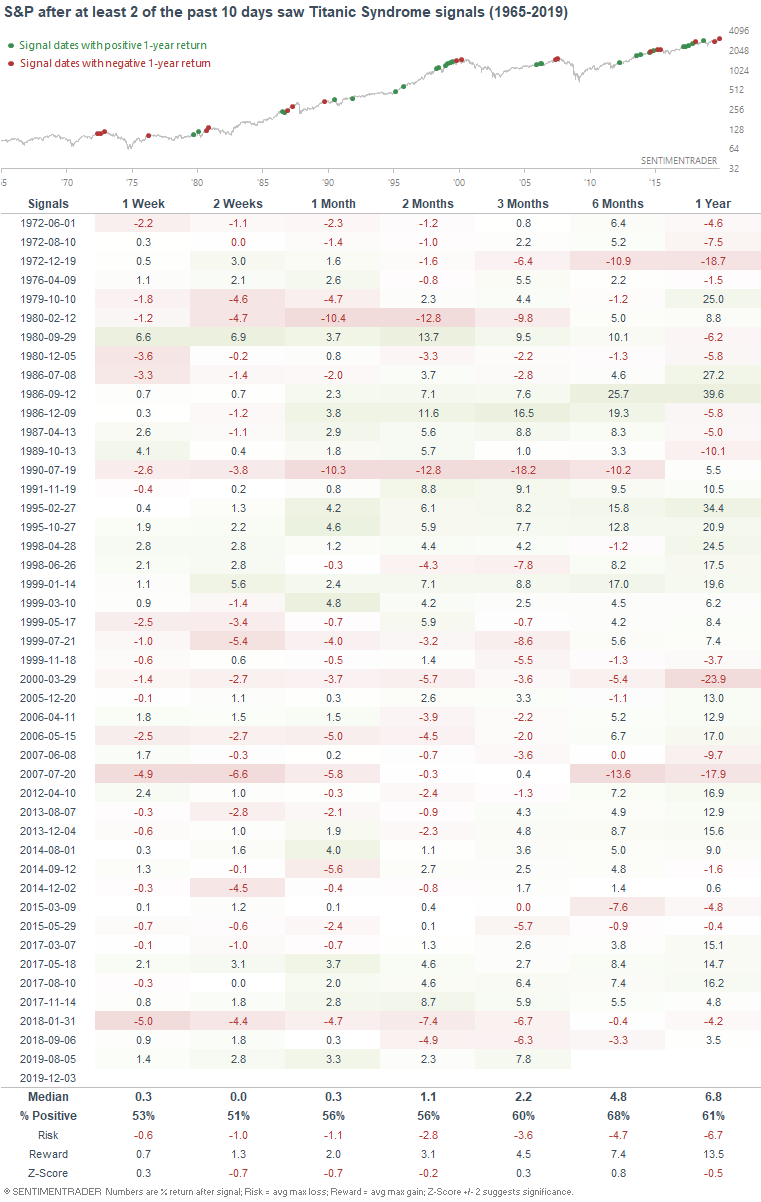
Since this isn't the first Titanic Syndrome signal to trigger recently, we can look at cases in which 2 or more were triggered over the past 2 weeks (excluding overlapping cases). Once again, the S&P's performance over the next few weeks and months were worse than random.
Breadth (that's more about momentum)
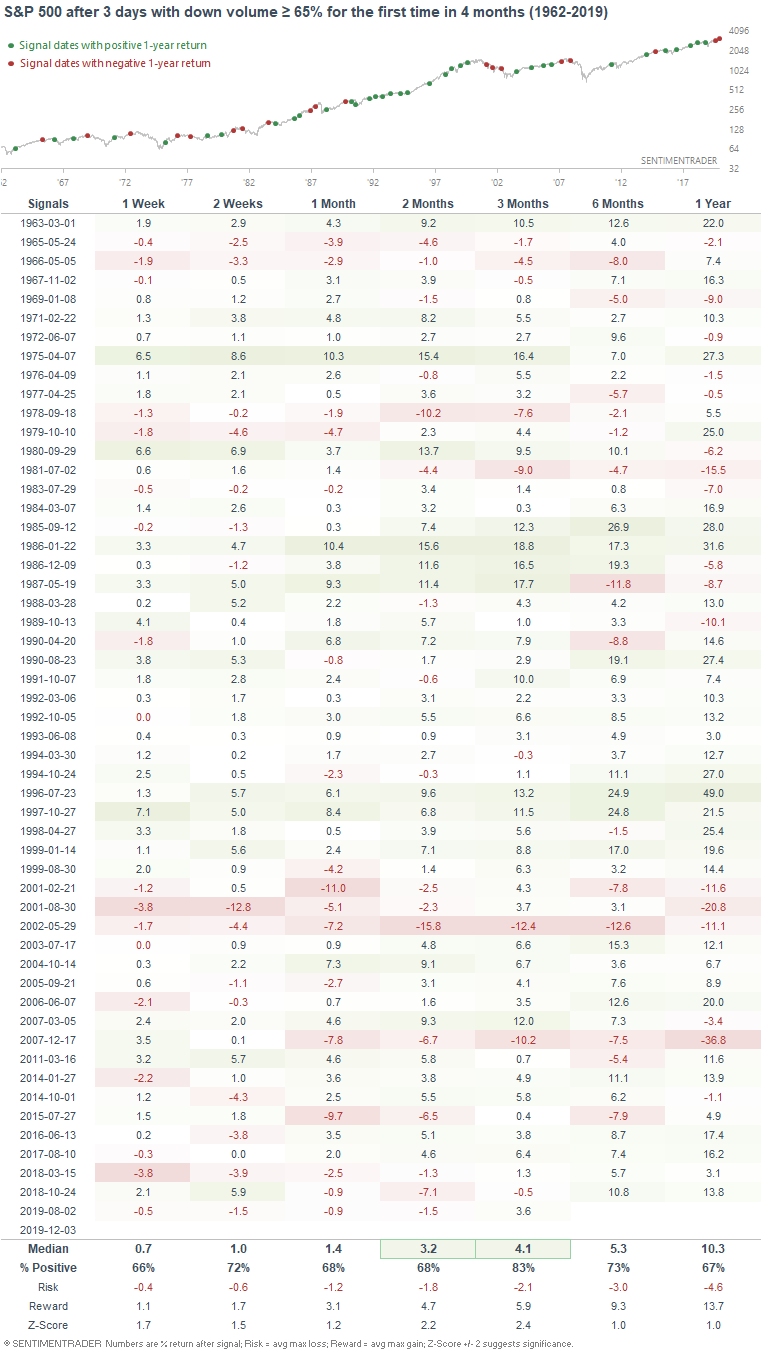
After a nonstop rally over the past 1.5 months, stocks are starting to reverse. This has caused the % of volume flowing into issues that go up to remain at 35% or less for 3 consecutive days. In other words, this has been the first 3 days of sustained selling since early-August, when the stock market last made a meaningful pullback.
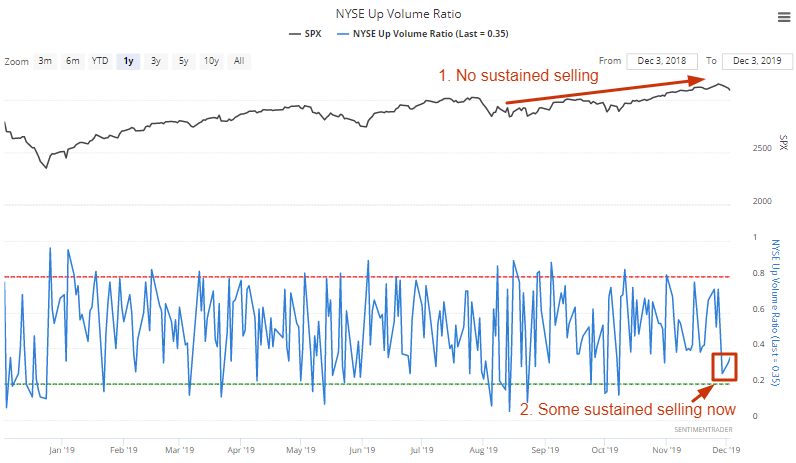
When the stock market experienced sustained selling for the first time in a long time, it typically rallied more over the next 3 months, even if it experienced more losses in the next few weeks (which has usually been the case from 2000-present).
This is essentially a momentum study using breadth. Strong, persistent rallies don't end that quickly. They typically experience short term weakness before more gains ahead.
Ex-U.S. breadth
With global markets selling off, plenty of ex-U.S. markets are witnessing a large percentage of their members with a MACD sell signal in the past 10 days. For example, this figure for the Canadian S&P/TSX has climbed to 29%.
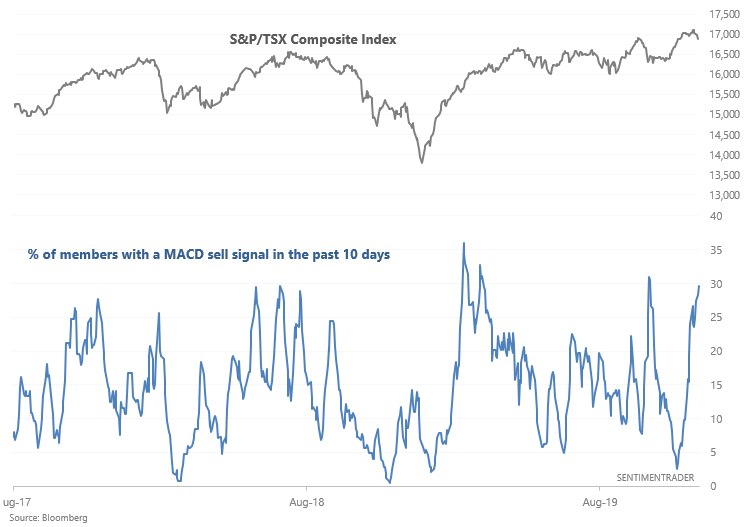
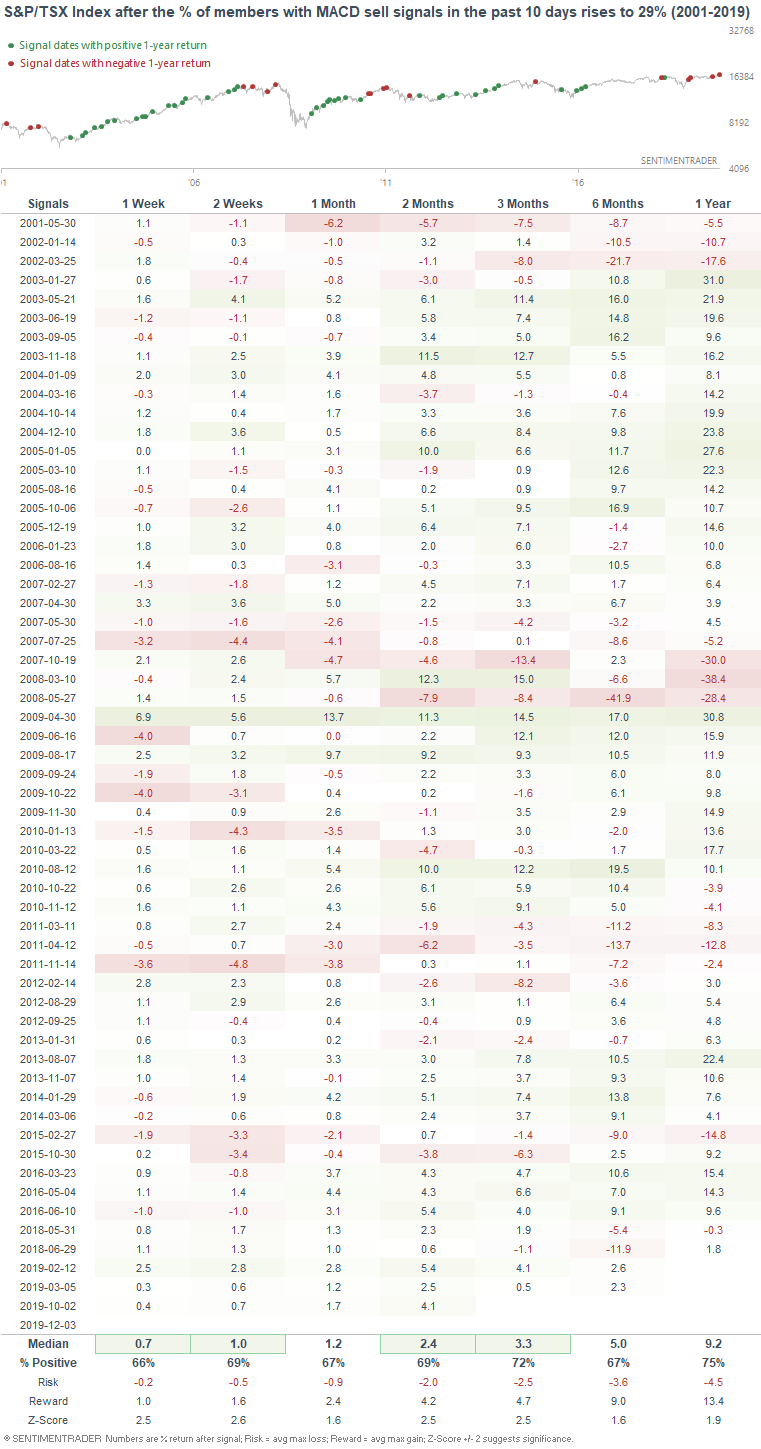
When this figure became this high in the past, the S&P/TSX's returns over the next few months leaned bullish:
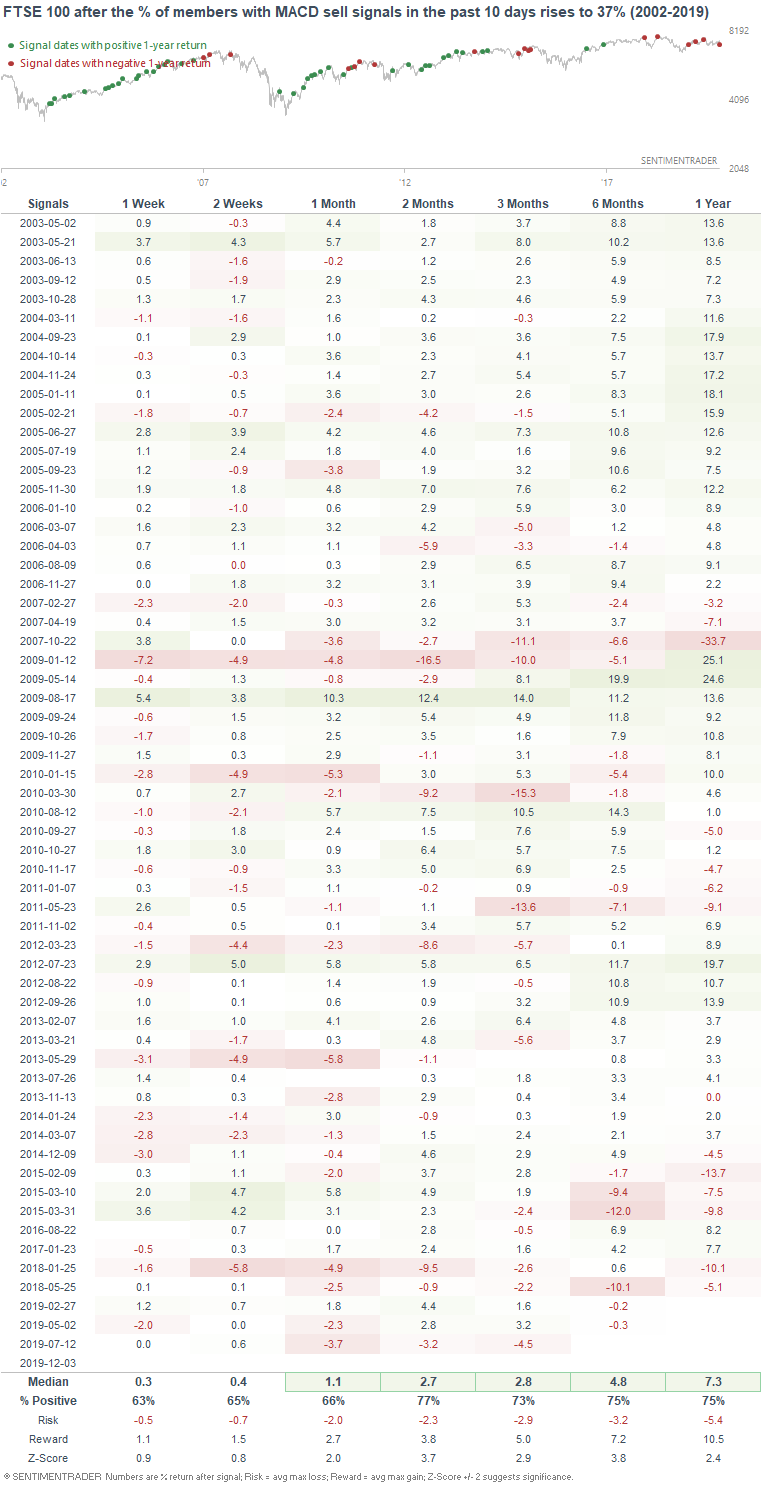
Similarly, 37% of FTSE 100 members have witnessed an MACD sell signal in the past 10 days:
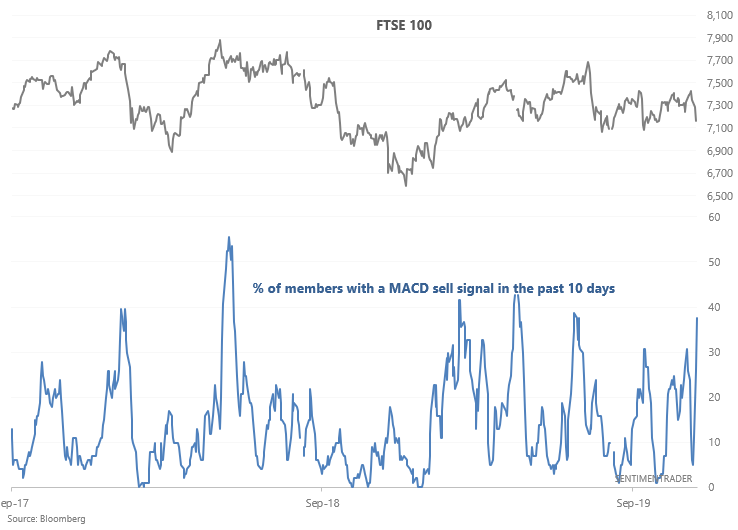
Once again, this provided the FTSE 100 with a bullish lean over the next several months:
Biotech
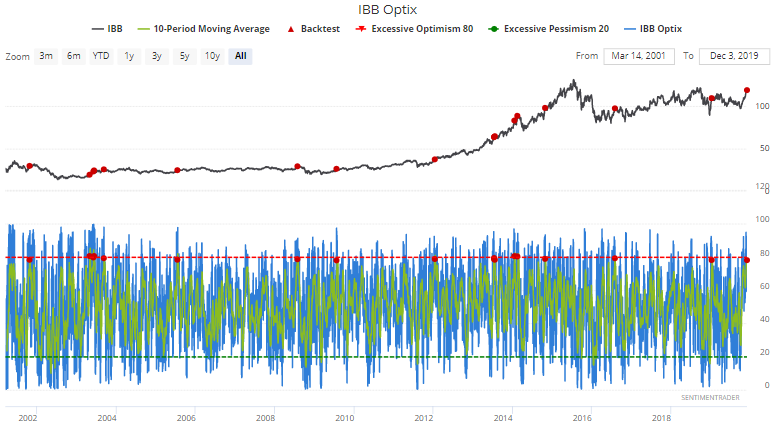
Biotech Optix is currently at 78, which is extremely high (historically):
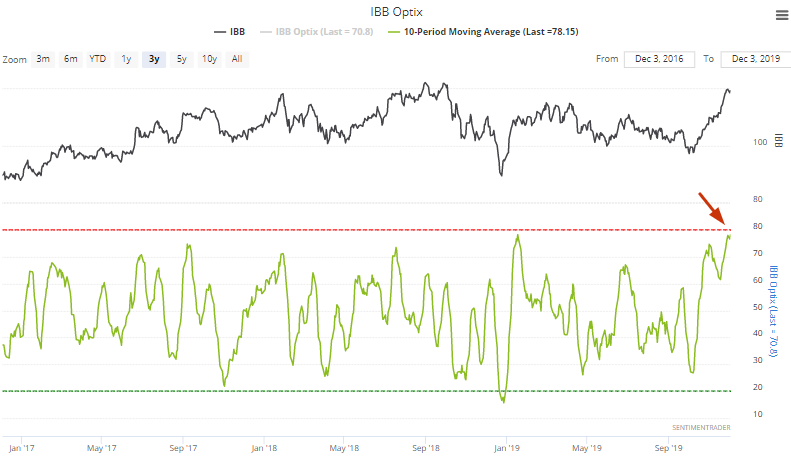
When biotech sentiment was this high in the past,
Volatility
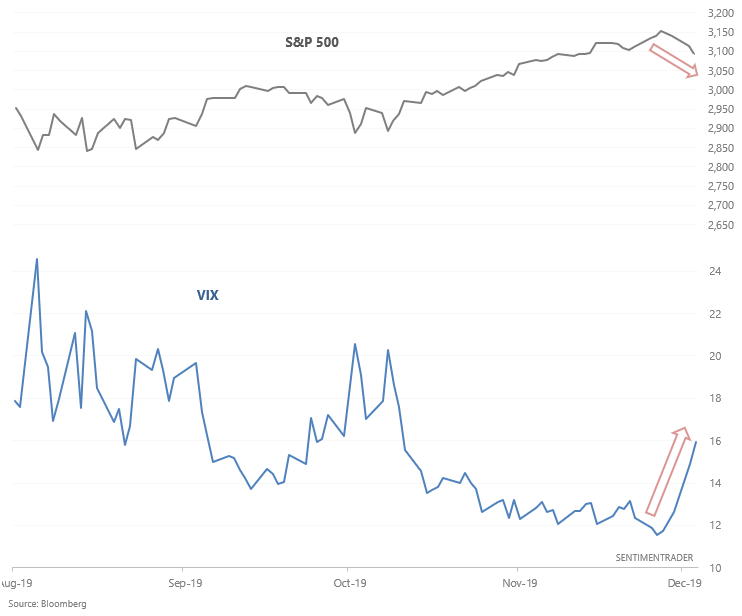
VIX jumped as the stock market fell over the past few days:
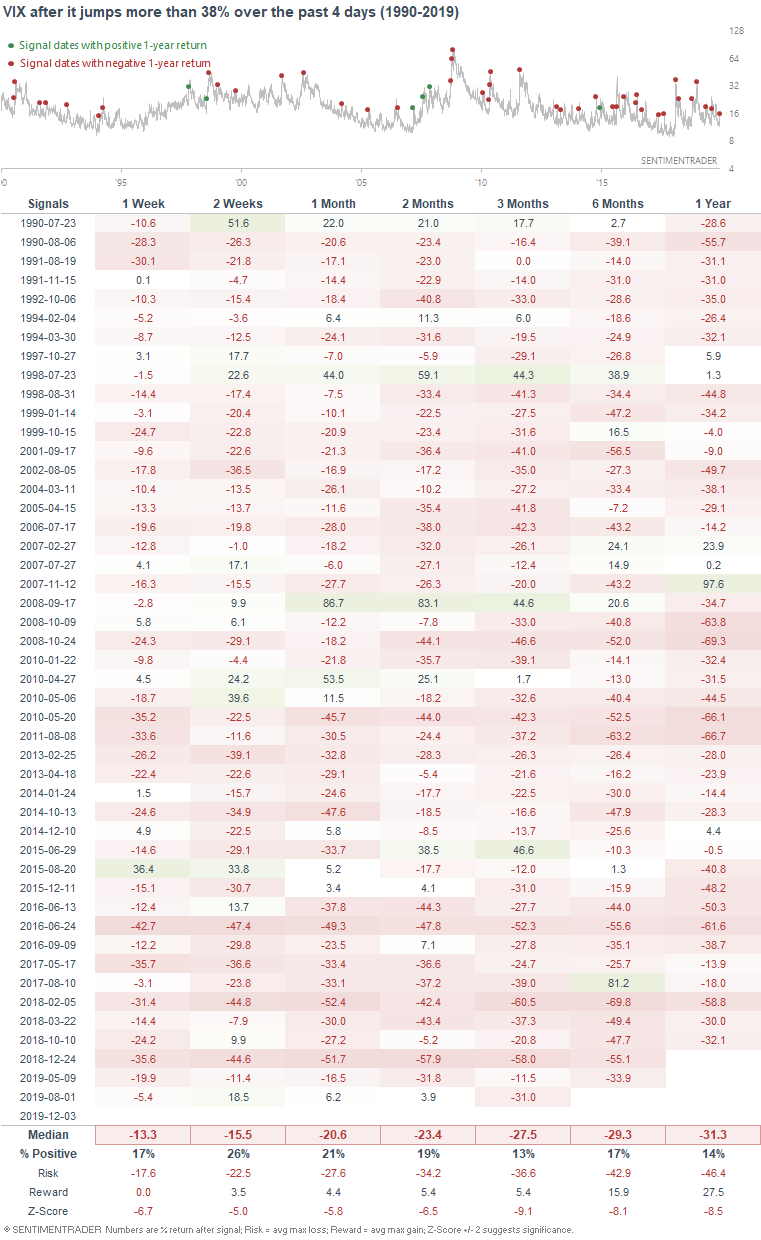
During these types of events, it's tempting to jump on the bandwagon in hopes that VIX will spike even more. And while it does work from time to time, there are more failed VIX spikes that successful volmageddons. The following table demonstrates every case in which VIX spiked more than 38% in 4 days, and what it did next:
Here's what the S&P 500 did next:
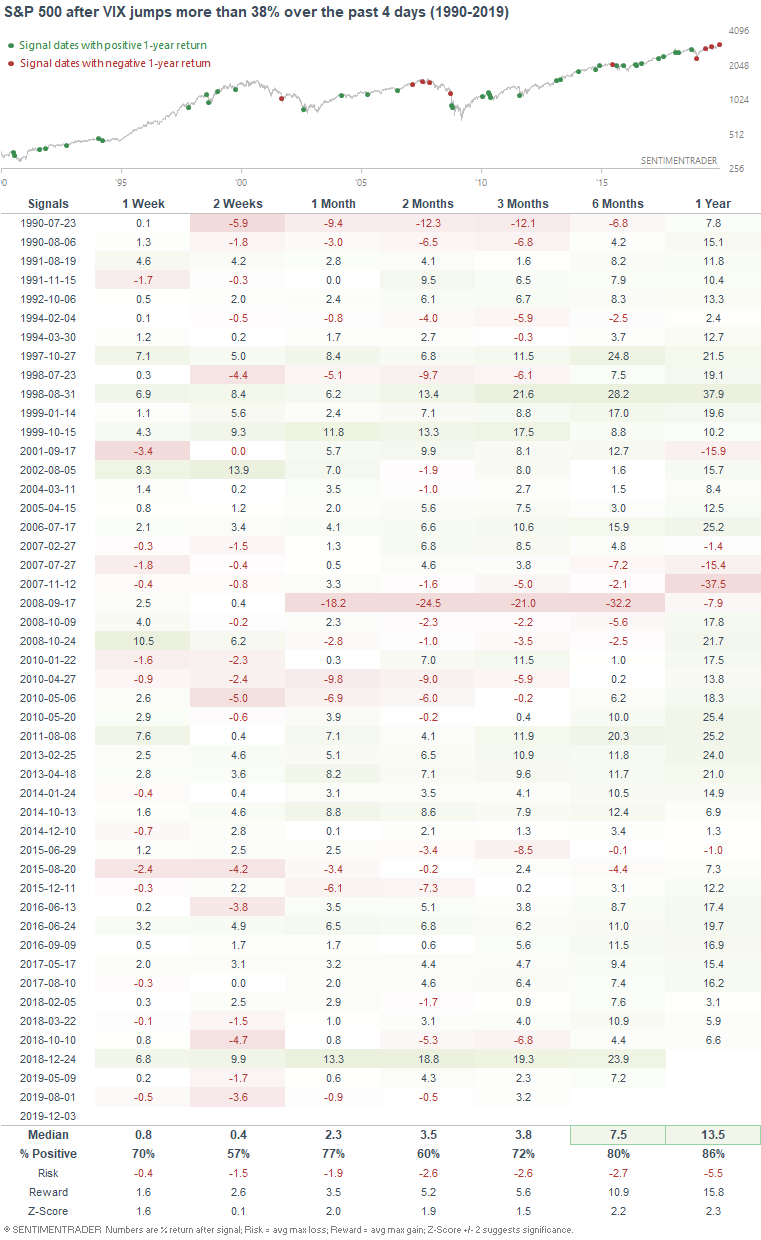
This isn't to say that VIX can't spike more in the next few days - it certainly will if stocks pullback more. But at this point, going long VIX isn't a terrific trade from a risk:reward perspective.
Seasonality
December is supposed to be great in terms of seasonality...
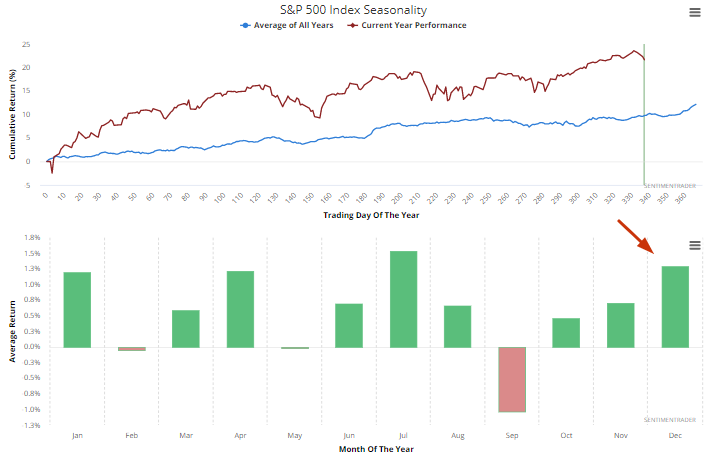
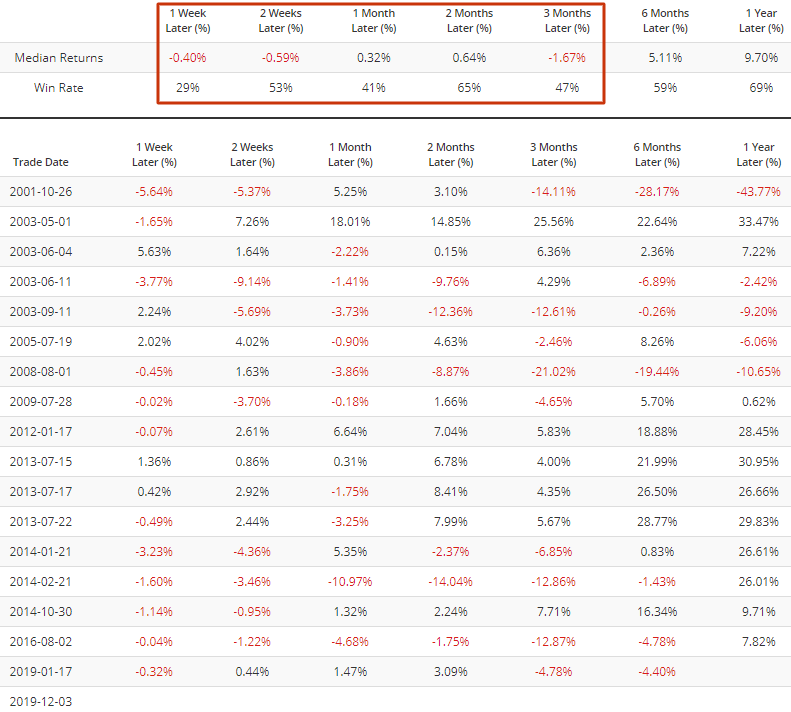
...so it's not very common for stocks to fall during the start of December. When it has, it was typically around recessions, bear markets, or periods of market turbulence. The following table looks at every case in which the S&P fell more than -1.5% in the first 2 days of December (using daily CLOSE $):
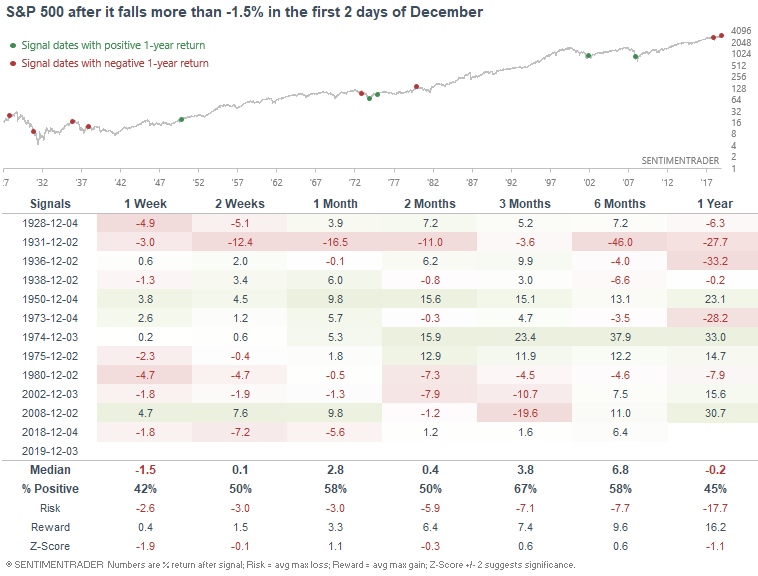
The last couple of times this happened:
- December 2018 (we all know how that went)
- 2008 (recession)
- 2002 (end of bear market, following the 2001 recession)
- 1980 (recession in 1981)
- 1975 (following the 1974 recession)
- 1974 (recession)
- 1973 (recession
Does this mean that we're near a recession, and stocks are about to tank? No. I wouldn't take this seriously. I don't trade stocks with seasonality, and I certainly don't make long term or fundamental predictions with 2 days of price action. Nevertheless, Oddstats would be proud of this stat.
My trading portfolio
I've been moving countries and changing residencies over the past half year, so I haven't done much trading up until a month ago. Now that I've settled down, I've reopened trading accounts. In the interest of transparency, I'm going to show you what my own trading portfolio is doing, similar to what Jason does.
From October 25 (when I started to trade again) - present:
- My account is up 2.51%
- Currently 100% in bonds
I don't place discretionary trades - these are purely based on my quantitative models.