What I'm looking at - TLT Optix, Leading vs. Coincident, Russell range, DAX breadth, REITs, Smart Money Index
Here's what I'm looking at:
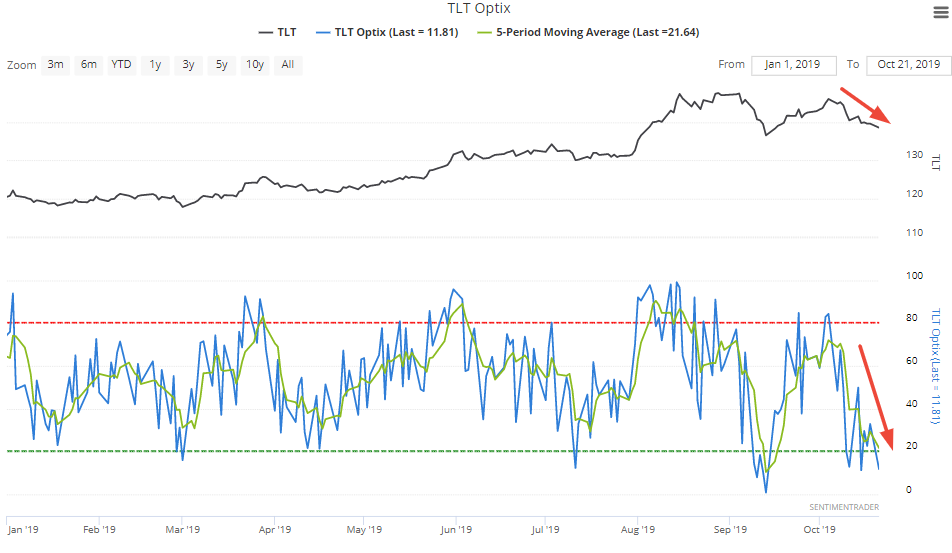
TLT
With bonds pulling back, TLT's Optix is trending downwards. Its 5 day average is now below 22:
While it's easy to assume that this is bullish for bonds, it hasn't always been the case. The following demonstrates what happened next to TLT when Optix's 5 day average fell below 22, while TLT was in an uptrend (above its 200 dma):
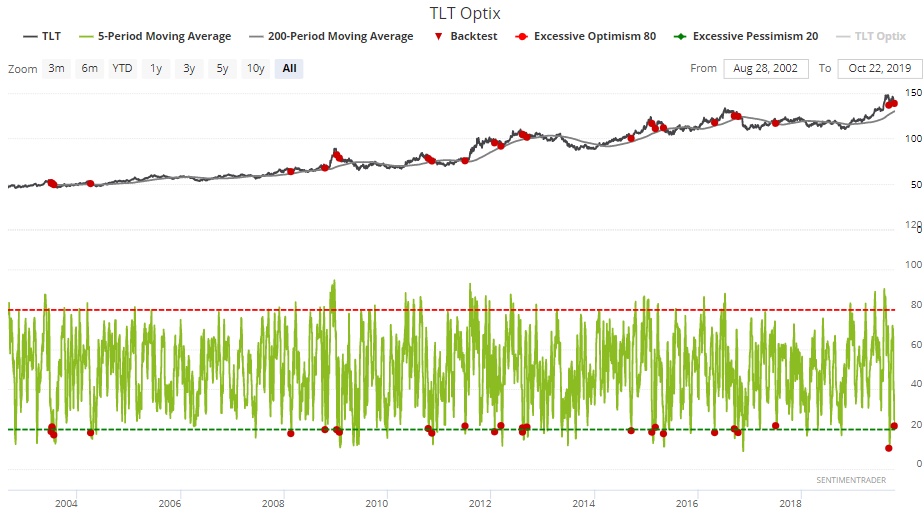
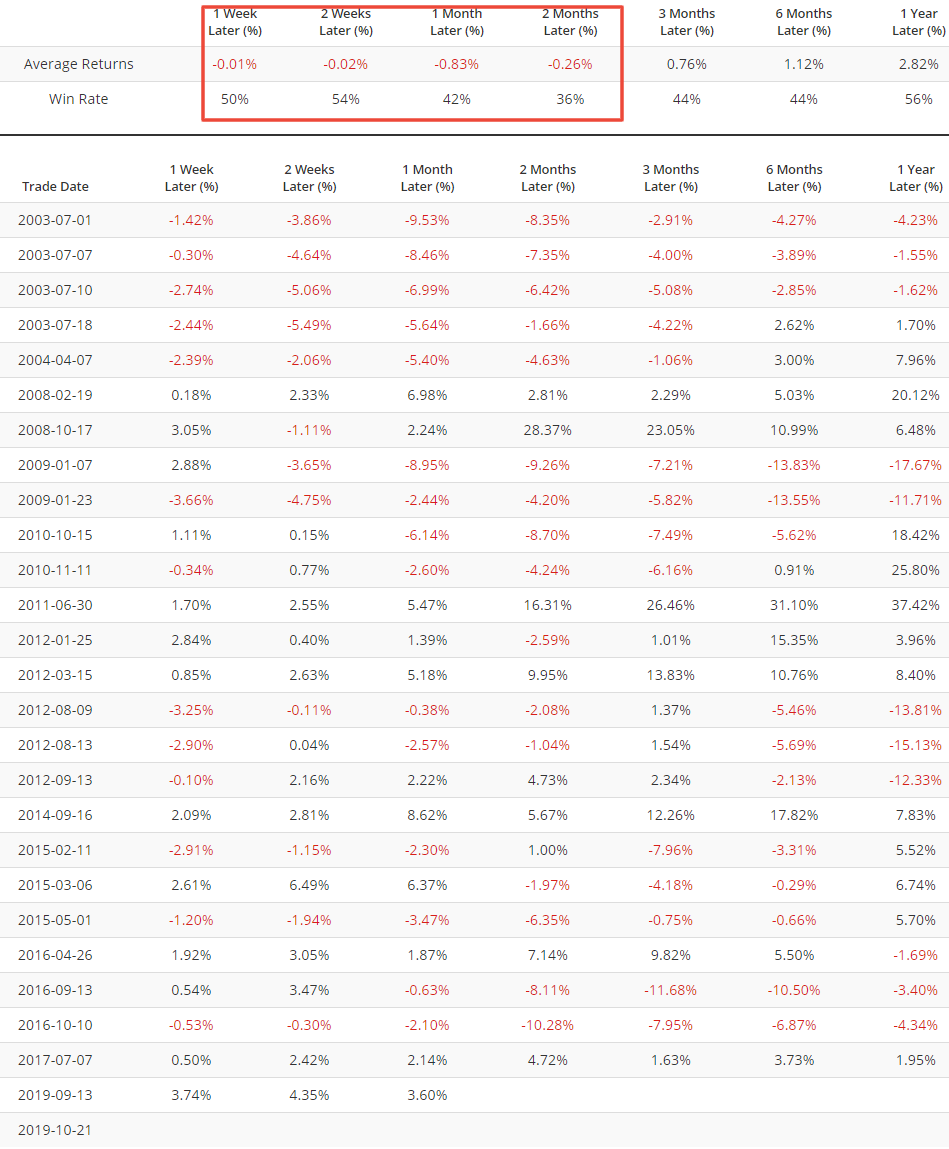
Treasury bonds typically fell over the next 2 months.
Leading vs Coincident Indicators
One final word about the Conference Board's set of indicators. (If you haven't already, see Jason's daily report on the LEI). Bespoke noted that that ratio between the Conference Board's Leading Economic Indicators vs. Coincident Economic Indicators has fallen to a 16 month low:
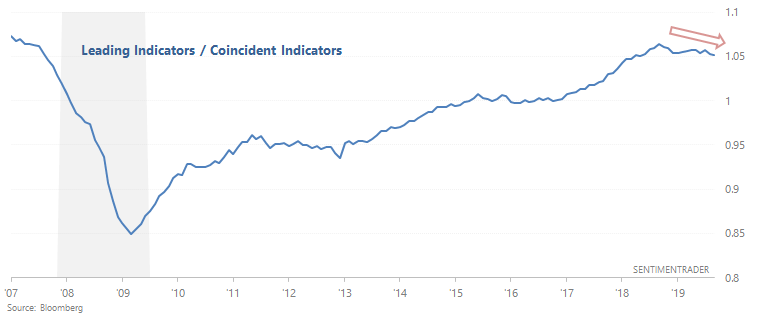
This is a concept I first came across in Ed Yardeni's autobiography, which suggested that this ratio is a useful leading indicator since it tends to roll over before recessions begin:
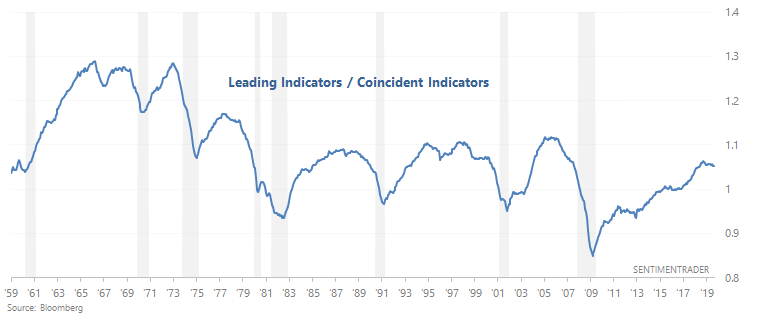
While this assertion is true, there are also plenty of false bearish signals (e.g. 1995) or bearish signals that were too early (e.g. April 2006, August 1998). The following chart demonstrates what happened next to the S&P when this ratio fell to a 16 month low (excluding overlaps):
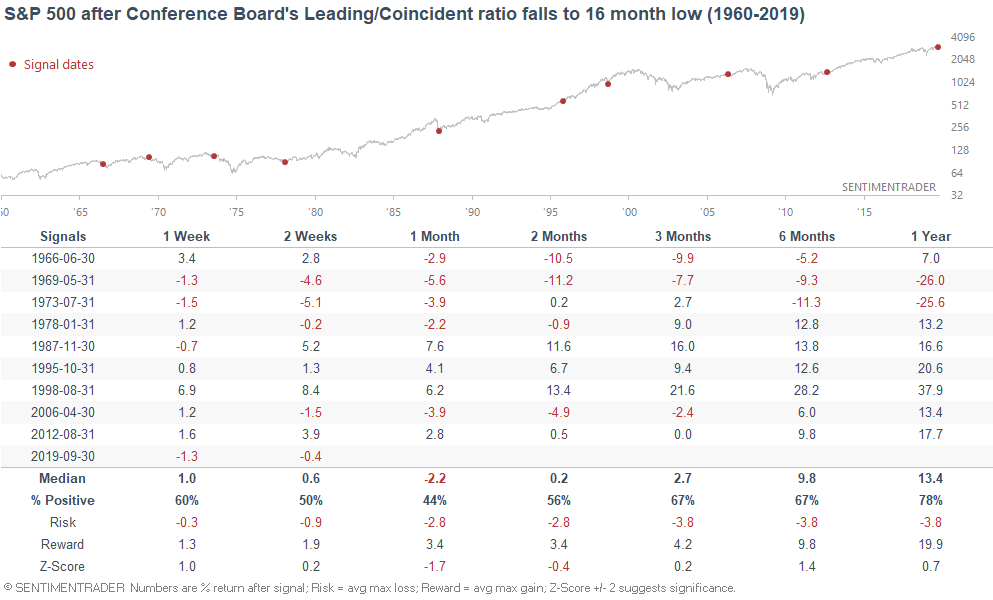
Some late-cycle cases were immediately preceded by large losses over the next 6 months (e.g. 1966, 1969, 1973), and other cases were followed by another 1-2 year rally.
Small caps
Small caps continue to trend sideways in a relatively tight range.
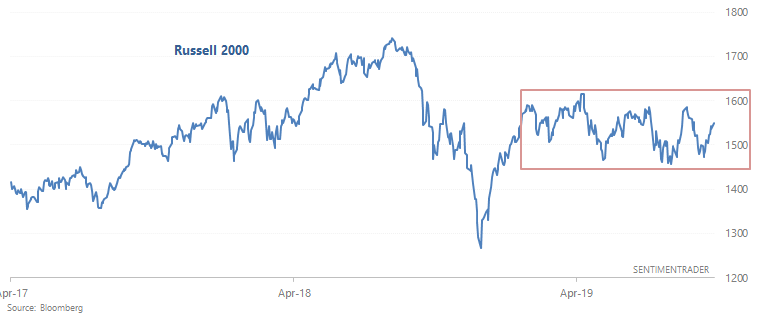
Long, tight ranges are usually followed by a breakout on the upside. The following table illustrates what happened next to the Russell when it's 9 month range (max/min) fell below 12%:
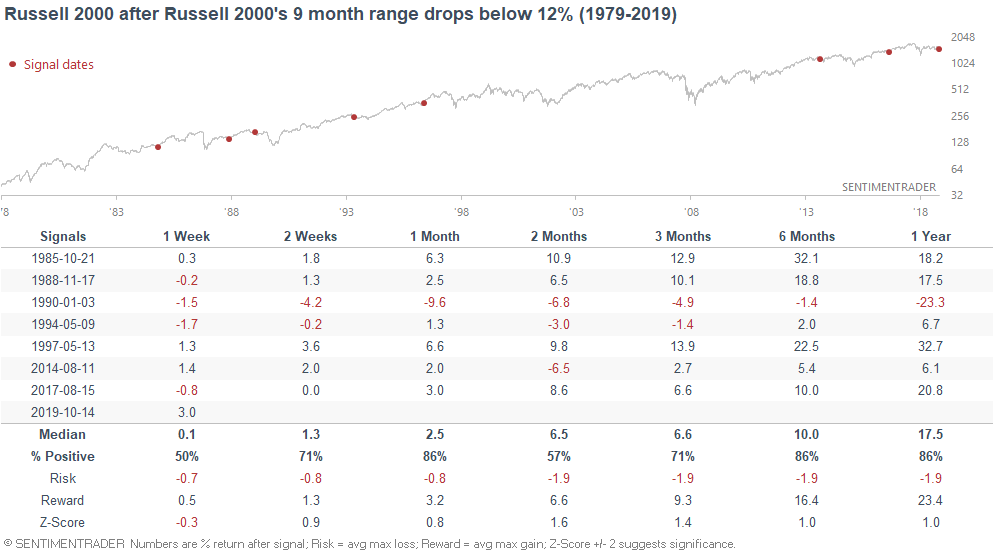
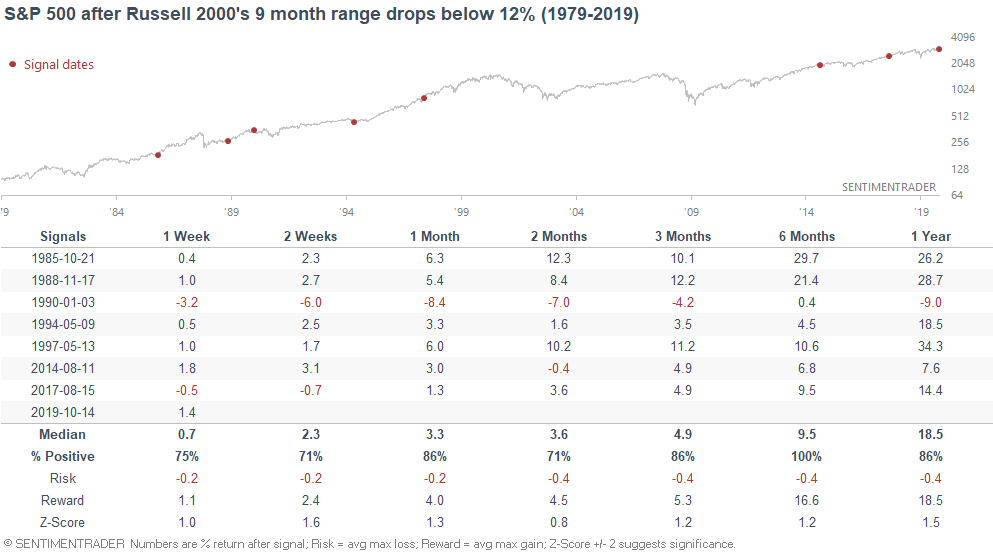
As you can see, the Russell's returns over the next 6 months are mostly bullish, with one bearish case. The following table looks at what the S&P did next:
DAX's improving breadth
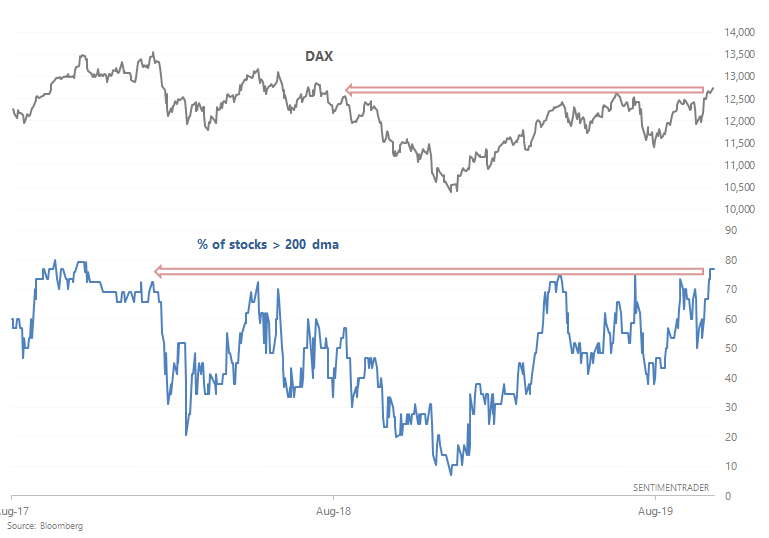
Outside of the U.S., various countries' stock indices are breaking out (e.g. Japan and Germany). With German stocks breaking out, the % of DAX members above their 200 dma has climbed above 76% for the first time in almost 2 years:

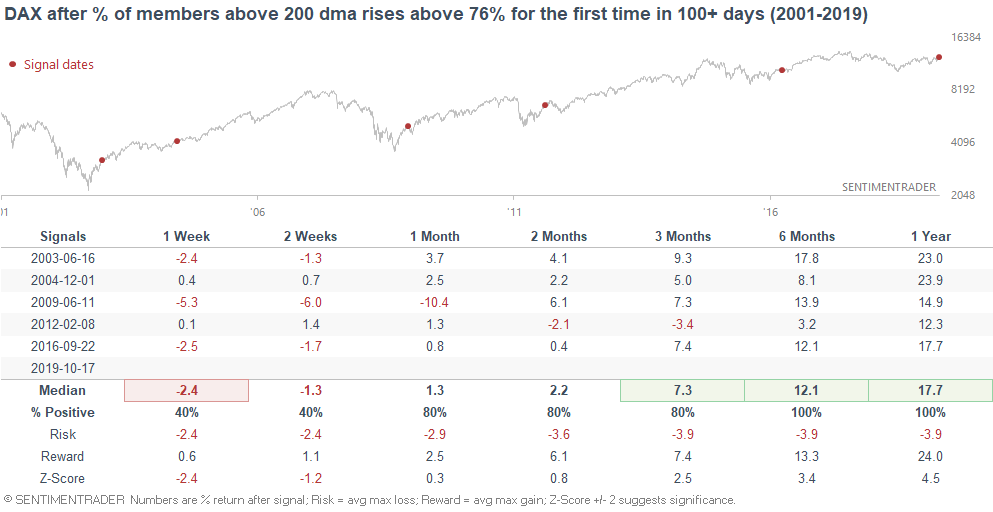
As you can see, this streak of "weak breadth + breakout" mirrors the 2001-2002 and 2007-2009 bear markets. If we loosen the parameters and examine every case in which weak breadth ended after 100+ days, the DAX's forward returns over the next 6-12 months were quite bullish, even if it faced short term pullbacks.
REITs
As Tiho noted, REITs are on fire this year (no doubt helped by falling interest rates). While REITs have been grinding upwards nonstop, yesterday was the first time since February in which RWR's 14 day RSI exceeded 70.
*RWR = REIT ETF
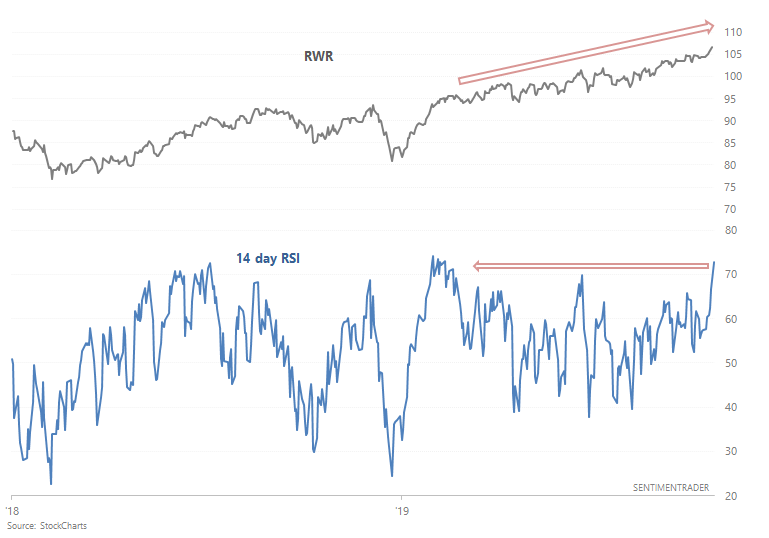
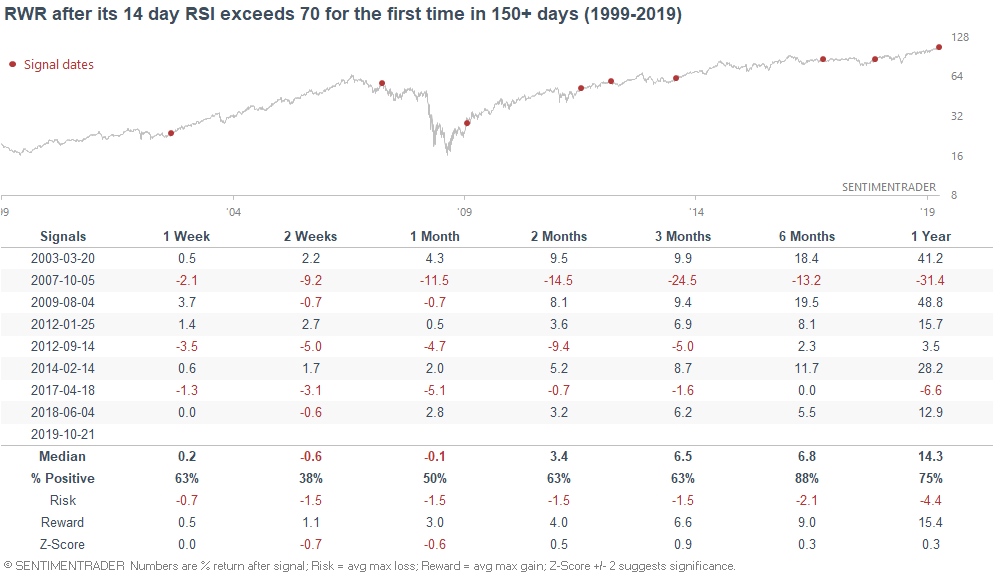
When RWR's 14 day RSI exceeded 70 for the first time in more than 150 days, it typically experienced weakness over the next 2-4 weeks, but went higher over the next 6 months:
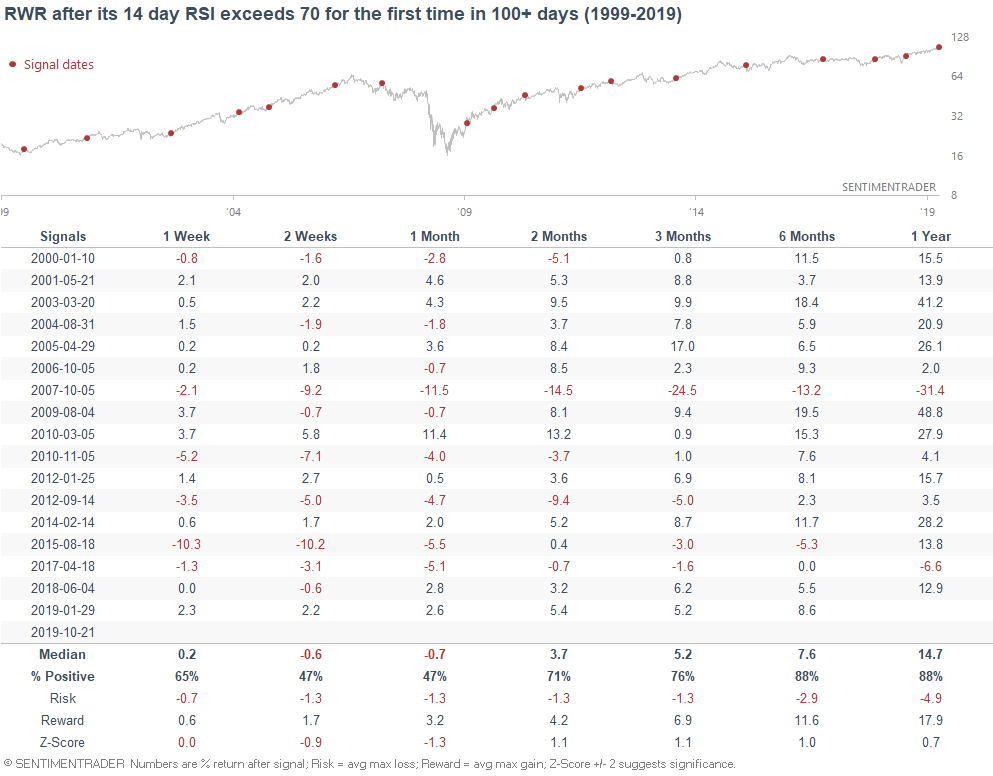
If we loosen the parameters to include cases in which RSI exceeded 70 for the first time in 100+ days, the results are similar. Forward returns are weak over the next 2-4 weeks, but strong over the next 6 months.
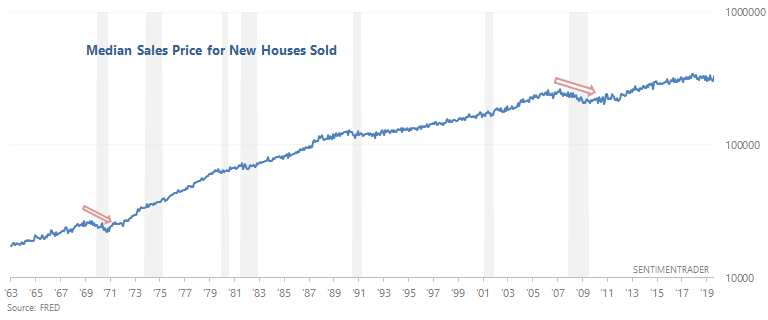
October 2007 was a clear bearish outlier, and that outlier can be easily explained away. Activity leads prices in real estate, and real estate activity (New Home Sales, Housing Starts, Building Permits) had already collapsed by late-2007. The opposite is true today, with real estate activity trending sideways/upwards.
Real estate tends to hold up better than stocks during a recession, and I don't think "the next one" will be similar to 2008. In my opinion, I think the next bear market will be severe, but the recession will be mild. But then again, I'm not fond of making big long term predictions. When you add up the successes + failures, most 3-10 year predictions turn out to be no better than a 50/50 coin toss.
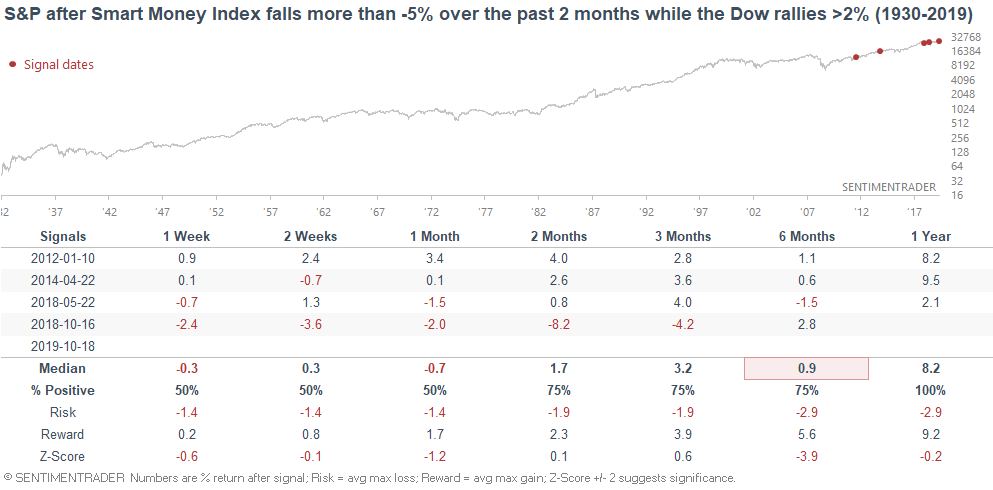
Smart Money Flow Index
The Smart Money Flow Index (or Smart Money Index) is based on the premise the "smart money" trades at the end of the day while "dumb money" trades at the start of the day. This indicator particularly catches traders' attention when it goes down (headline: SMART MONEY IS SELLING).
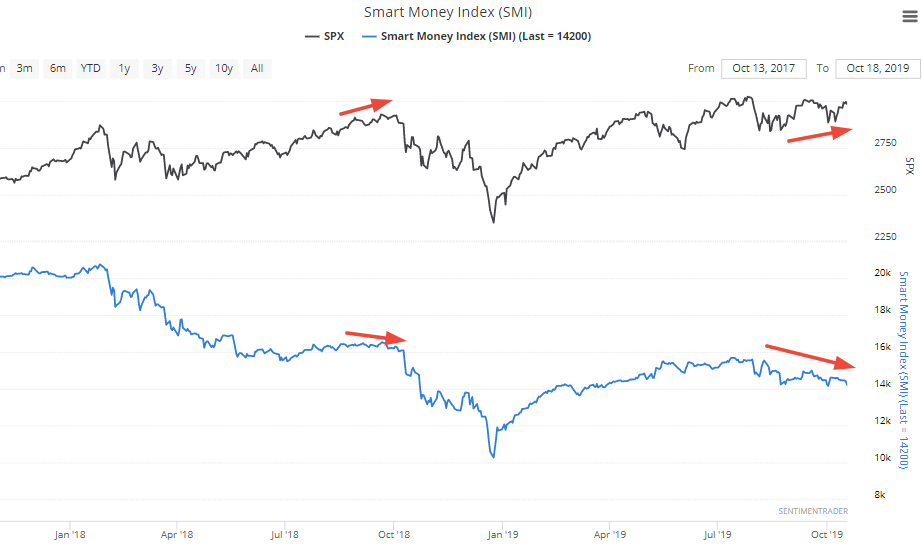
Despite its popularity and catchy name, I don't find this indicator to be particularly useful for timing purposes. The premise that "smart money trades at the end of the day" is increasingly not true, due to the popularity of ETFs.