What I'm looking at - VIX, nonresidential fixed investment, healthcare, finance, SKEW
With stocks setting all-time highs, here's what I'm looking at:
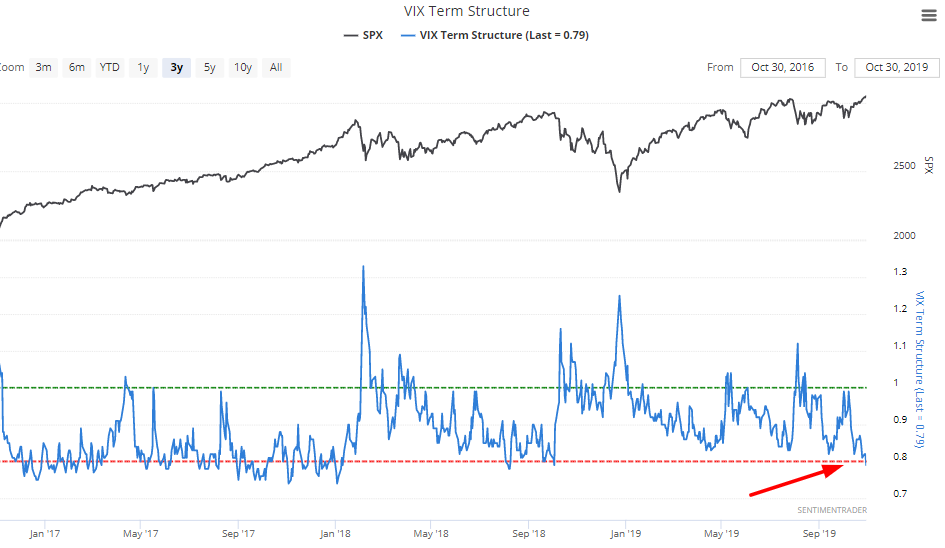
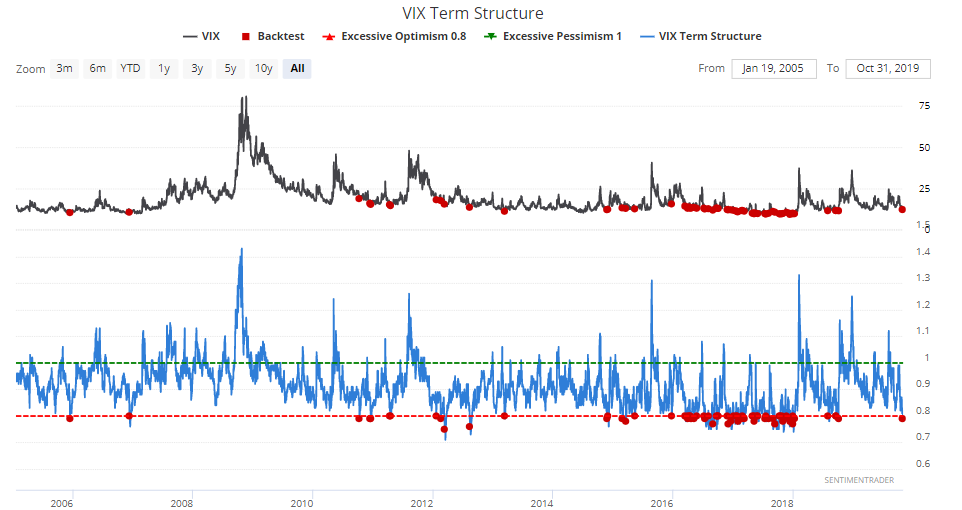
VIX term structure
As the stock market rallies and VIX falls, VIX's term structure has fallen below 0.8:
*The term structure compares 1 month VIX futures vs. 3 month VIX futures. When the term structure dips below 0.8, it demonstrates complacency towards volatility.
The last time this happened was September/October 2018, just before vol spiked and stocks tanked. Is this a consistently bearish sign for stocks?
The following table demonstrates every case in which VIX's term structure dipped below 0.8, and what the S&P 500 did next:
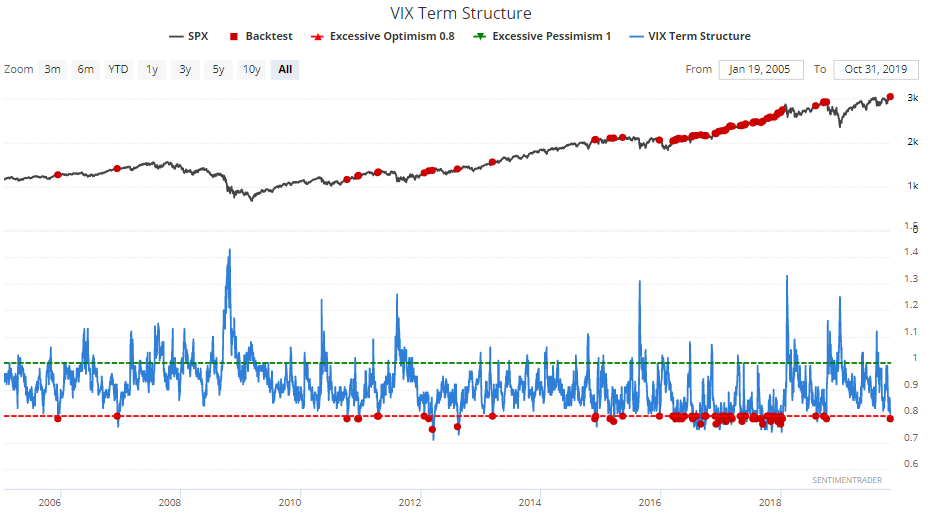
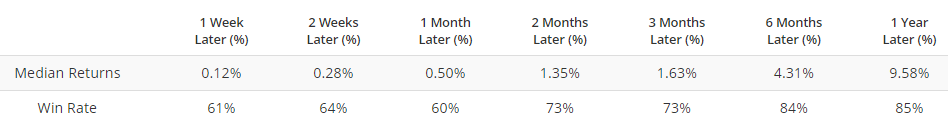
Here's what VIX did next:
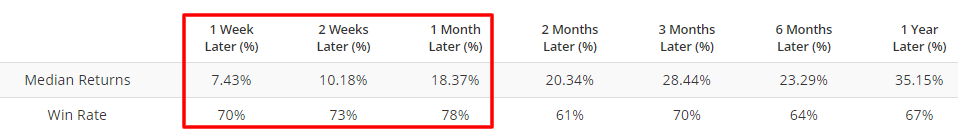
As you can see, this is more bullish for VIX than bearish for the S&P 500.
Private Nonresidential Fixed Investment
The latest GDP report demonstrated slightly weakening growth, with business investment being a drag.The quarterly % change in private nonresidential fixed investment has fallen to -0.6%, which was last seen during the 2015-2016 earnings recession (and global slowdown), and before that during 2008:
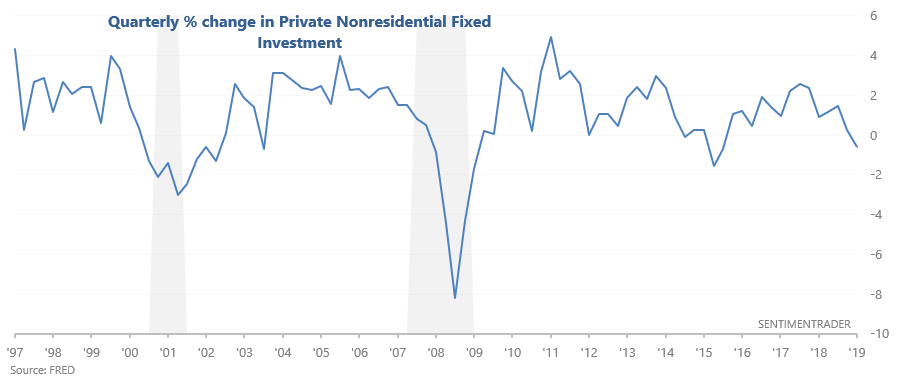
Is this bad news for stocks? Are global equity markets about to tank? The following is the exact same chart, but with data from 1947-2019:
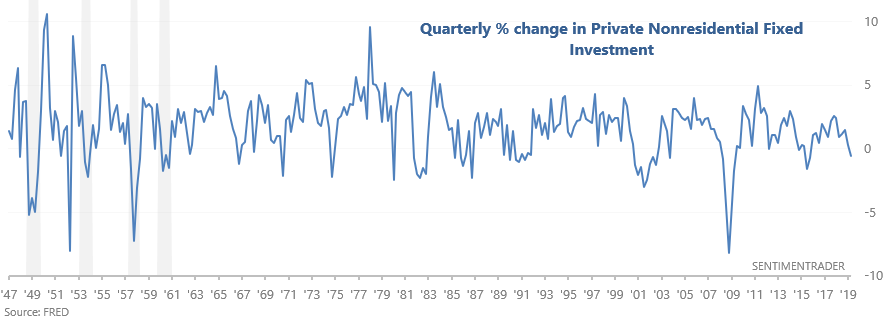
Here's what happened next to the S&P when this figure fell below -0.5%:
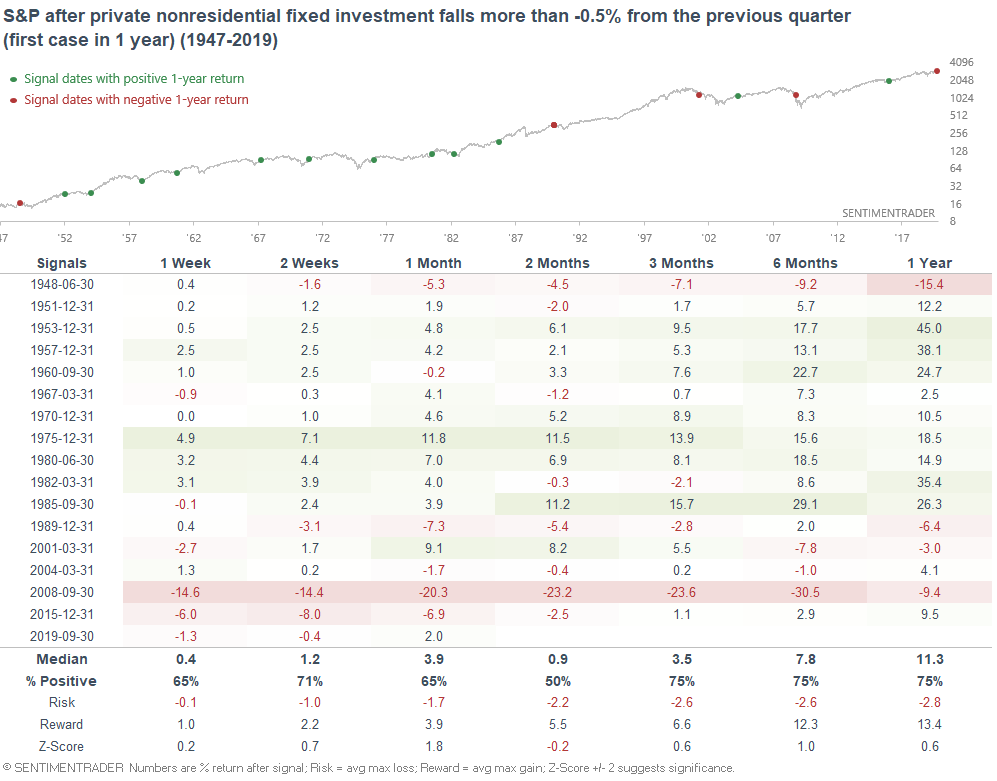
As you can see, this was bearish in 2015, 2008, and 2001. But before that, this wasn't a consistently bearish factor for stocks on any time frame. When it comes to macro, I'm not a big fan of GDP-related data series. The data is quarterly, there are too many big revisions, and it isn't a consistent leading indicator (from a market timing perspective).
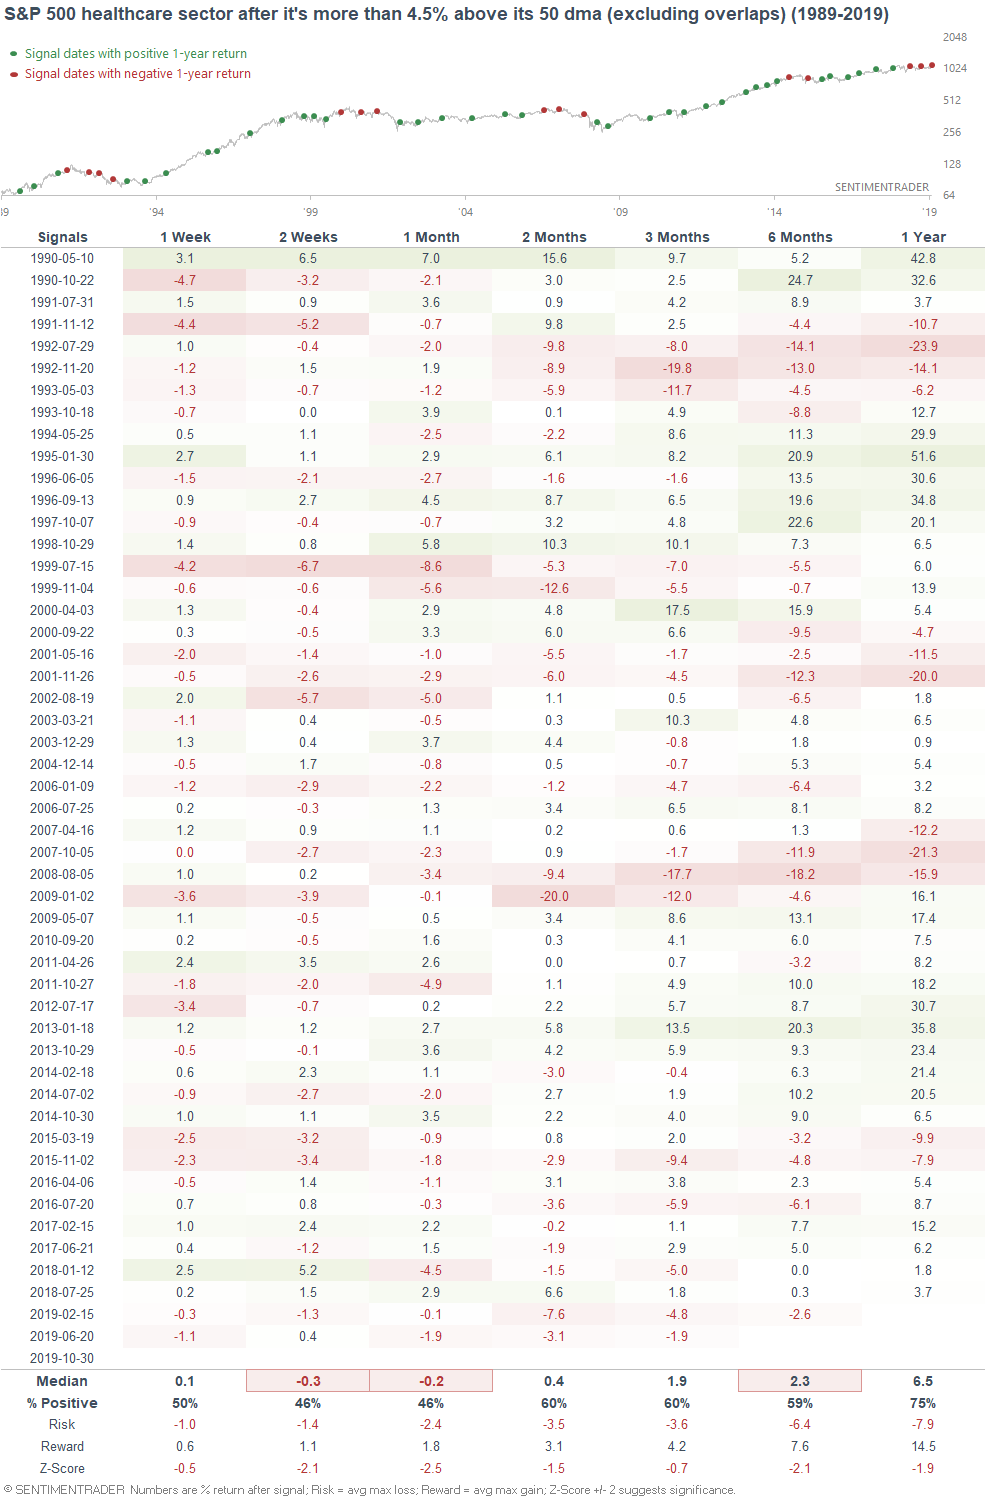
S&P 500 healthcare
As Bespoke suggested, the S&P 500 healthcare sector surged recently. It is now more than 4.5% above its 50 day moving average:
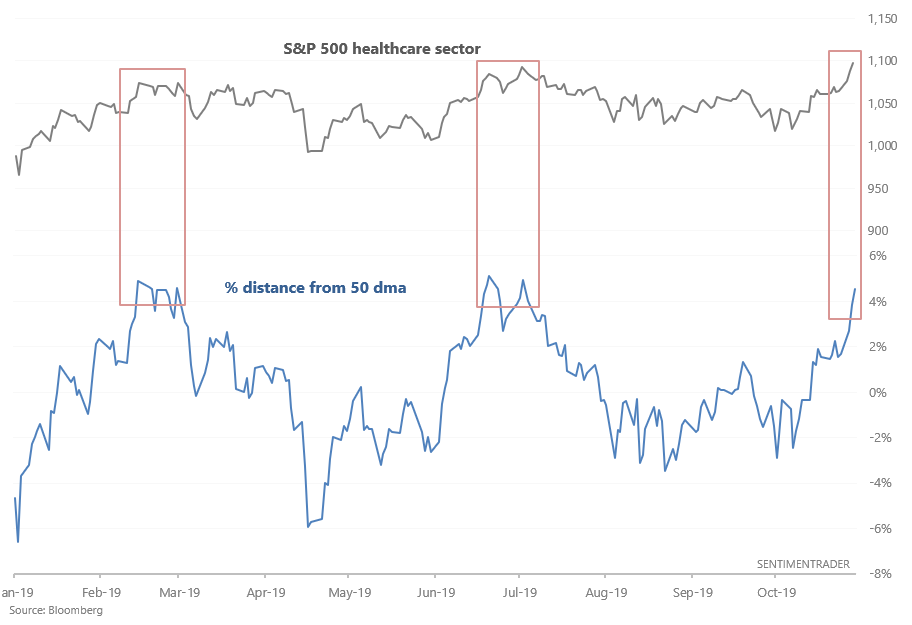
The healthcare sector struggled the last 2 times this happened. And from 1989-present, this was slightly bearish for healthcare over the next few weeks:
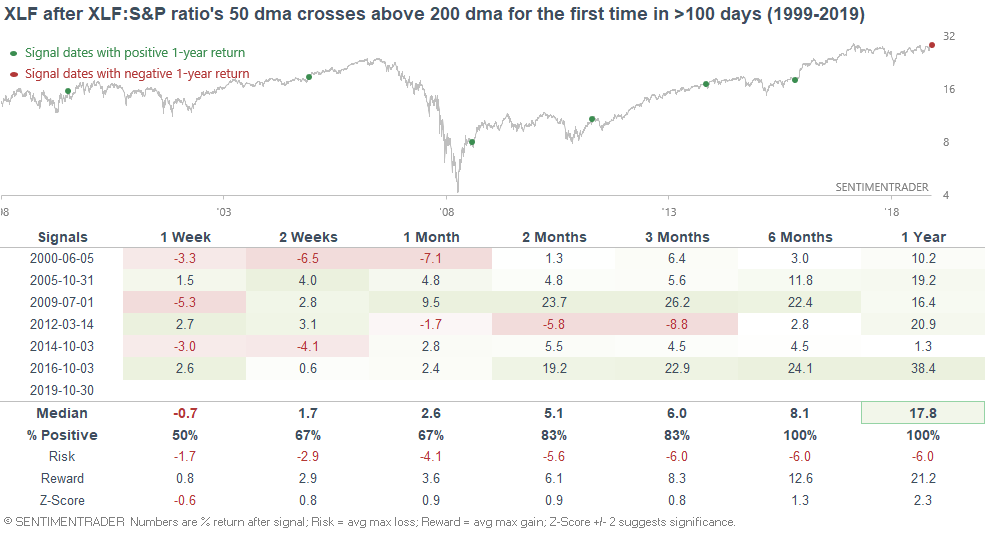
Finance
Whereas financial stocks have lagged for most of 2018 and 2019, they are now slowly starting to outperform. This has pushed the XLF:S&P ratio's 50 dma above its 200 dma for the first time since mid-2018:
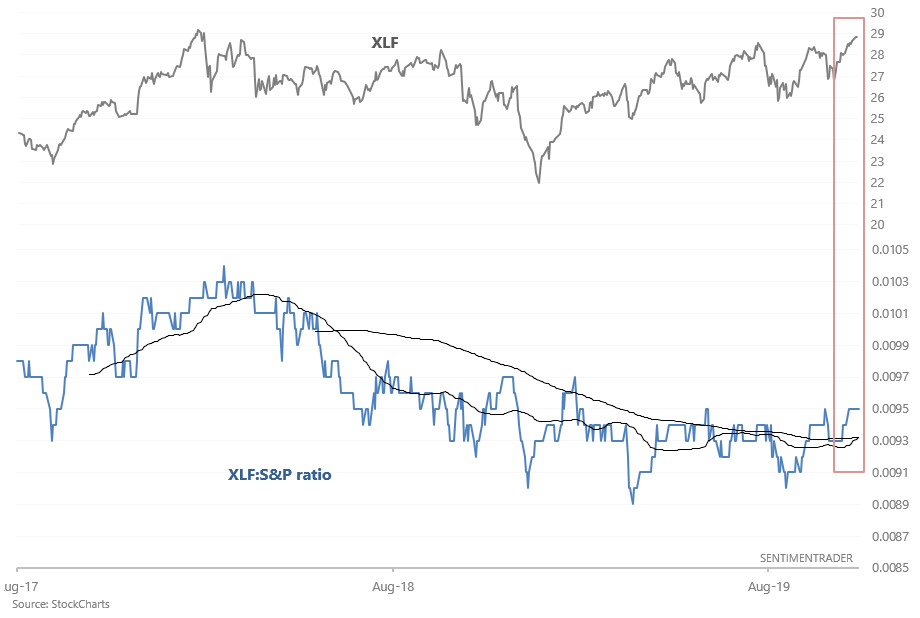
When this happened in the past, XLF typically surged over the next 6-12 months:
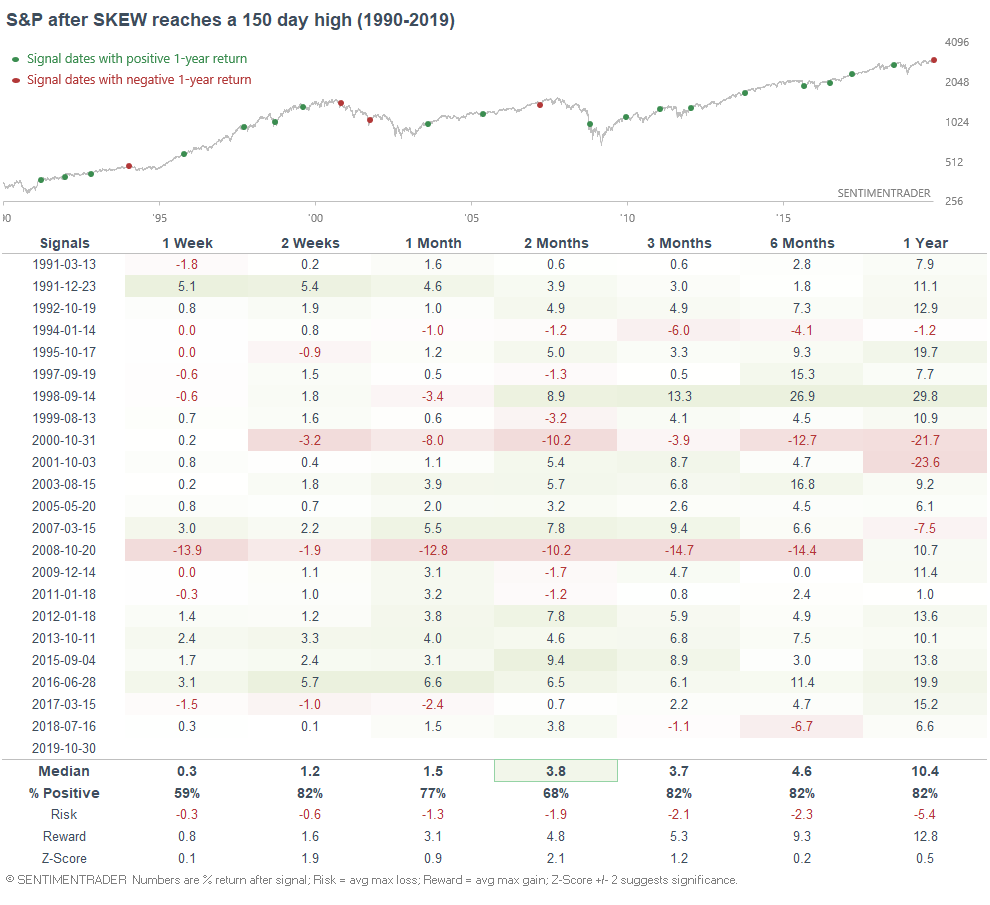
SKEW
The SKEW Index looks at the risk of a black swan event. This index tends to go up as the stock market rallies and go down as the stock market falls. It was quite high from July-September 2018, just before stocks tanked.
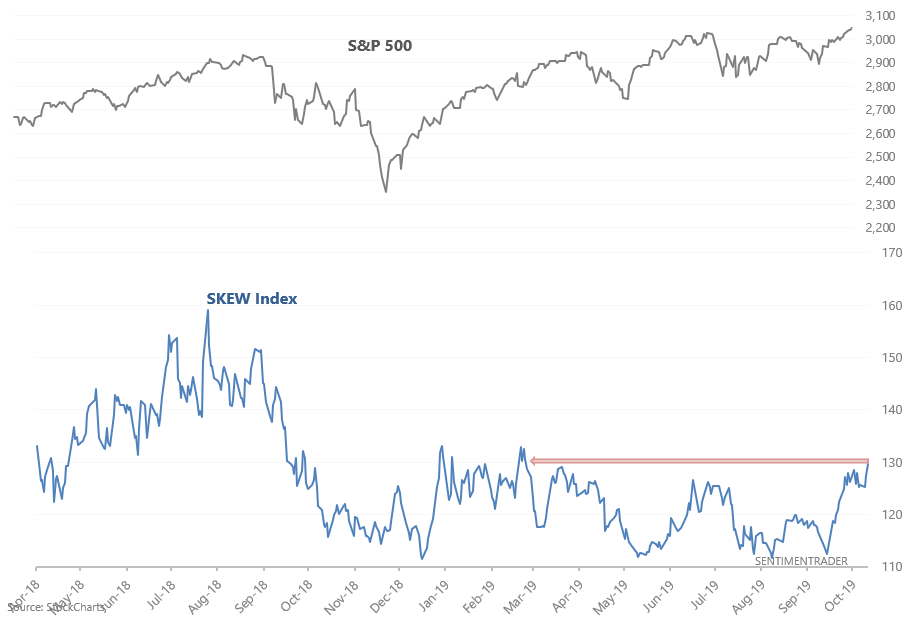
But when the SKEW Index broke out to a 150 day high, the S&P's forward returns over the next few weeks and months were more positive than random. Since this index tends to mirror the S&P's movements, a breakout in SKEW sometimes coincides with a breakout in equities.