Indicators &
Backtest Tools
Research
Reports
Report Solutions
Reports Library
Strategies
& Scanner
Free
Resources
Simple Backtest Calculator
Simple Seasonality Calculator
The Kelly Criterion Calculator
Sentiment Geo Map
Public Research Reports
Free Webinar
Pricing
Company
About
In the News
Testimonials
Client Success Stories
Contact
Log inLoginSign up
< BACK TO ALL REPORTS

What the S&P's 10-and-10 correction suggests for the next few months

Jason Goepfert
2022-03-15
Despite the S&P 500's "10 and 10" decline, there have been zero days with exhaustive selling pressure. No eurozone ETFs have a positive trend score.

A 10-and-10 decline with no exhaustive selling pressure

It's been less than 3 months, but it feels much longer. As investors heralded the end of 2021, stocks were sitting at all-time highs, and the outlook (according to most) was excellent.

Now 10 weeks removed from the last weekly closing high in the S&P 500, the most benchmarked index in the world is still sitting more than 10% below its high point. Buyers' apathy and inability to build on even minor rallies is a hallmark of bear markets, and that fear is building by the day.

Curiously, there have been no days with truly exhaustive selling pressure during this entire stretch. Despite the large (but not extreme) price swings, there have been zero days with more than 90% selling pressure. The NYSE Up Issues Ratio has remained above 10% the entire time, unlike the pandemic crash and its aftermath.

No exhaustive selling during this decline

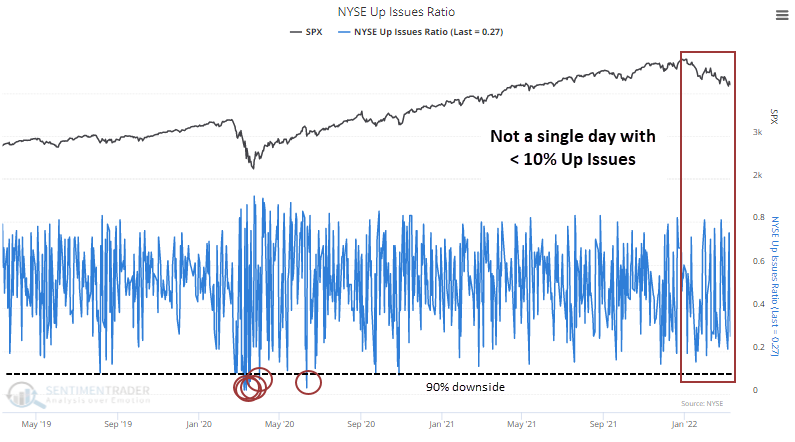
Volume is more volatile, but even so, there haven't been any days with less than 10% Up Volume. The persistent selling pressure is causing sentiment to stay weak. Or rather, weak sentiment is causing rally attempts to falter quickly: chicken and egg.

At least some investors seem to be stepping up. With commercial hedgers covering some of their historic short positions against major equity index futures, Smart Money Confidence has been able to rise. It has now surpassed the peak from the pandemic.

We took a look at forward market returns after each of these developments, and they were all consistent in their message.

No positive trends in the eurozone

The number of Eurozone ETFs outperforming the S&P 500 on a YTD basis contracted sharply. Dean showed that price trend indicators for Eurozone countries show a significant reversal from positive to negative.

Applying a composite trend model to each Eurozone ETF shows all 15 countries with a positive score as recently as November 2021. Today, that same basket shows zero ETFs with a positive trend score.

No eurozone country ETFs have a positive trend score

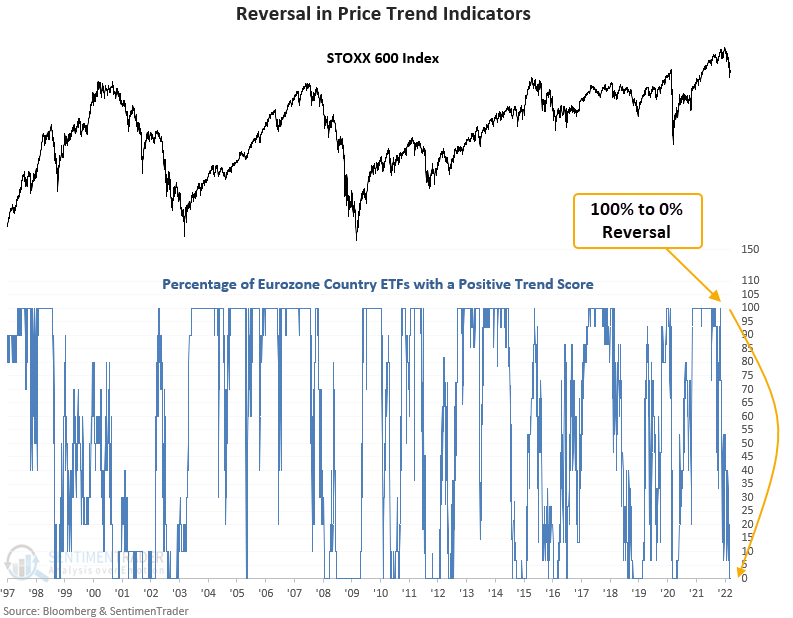
This signal has triggered 12 other times over the past 24 years. Returns in the STOXX 600 after those signals was not exactly what people who buy "oversold" indicators would expect.

Indicators & Backtest Tools
IndicatorEdge
‍
BackTestEdge
‍
Other Tools
‍
DataEdge API
RESEARCH
reports
Research Solution
‍
Reports Library
‍
Strategies & Scanner
Trading Strategies
‍
Smart Stock Scanner
‍
FREE
RESOUrCES
Simple Backtest
Calculator
Simple Seasonality
Calculator
The Kelly Criterion
Calculator
Sentiment Geo Map
‍
Public Research Reports
‍
Free Webinar
COMPANY
‍
About
‍
In the News
‍
Testimonials
‍
Client Success Stories
Pricing
Bundle pricing
‍
Announcements
‍
FAQ
© 2025 Sundial Capital Research Inc. All rights reserved.
Setsail Marketing
TermsPrivacyAffiliate Program
Risk Disclosure: Futures and forex trading contains substantial risk and is not for every investor. An investor could potentially lose all or more than the initial investment. Risk capital is money that can be lost without jeopardizing ones’ financial security or life style. Only risk capital should be used for trading and only those with sufficient risk capital should consider trading. Past performance is not necessarily indicative of future results.

Hypothetical Performance Disclosure: Hypothetical performance results have many inherent limitations, some of which are described below. No representation is being made that any account will or is likely to achieve profits or losses similar to those shown; in fact, there are frequently sharp differences between hypothetical performance results and the actual results subsequently achieved by any particular trading program. One of the limitations of hypothetical performance results is that they are generally prepared with the benefit of hindsight. In addition, hypothetical trading does not involve financial risk, and no hypothetical trading record can completely account for the impact of financial risk of actual trading. for example, the ability to withstand losses or to adhere to a particular trading program in spite of trading losses are material points which can also adversely affect actual trading results. There are numerous other factors related to the markets in general or to the implementation of any specific trading program which cannot be fully accounted for in the preparation of hypothetical performance results and all which can adversely affect trading results.

Testimonial Disclosure: Testimonials appearing on this website may not be representative of other clients or customers and is not a guarantee of future performance or success.