
What to Watch for in the Bond Market

As you can see in the chart below (courtesy of Stockcharts.com), long-term treasuries (using ticker TLT as a proxy) staged a nice advance from mid-March into late July. Since then, things have taken a turn for the worse, just recently crossing back below its 200-day moving average.
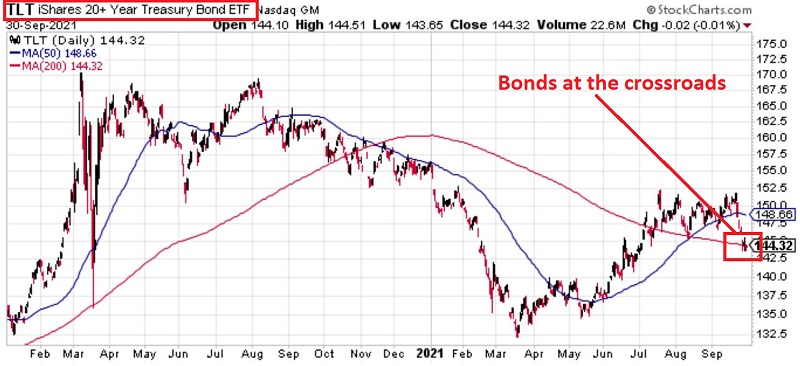
The obvious question is, "will the weakness continue, or will bonds bounce back?"
Let's look at a few key factors.
SEASONALITY
The chart below displays the Annual Seasonal Trend for 30-year Treasuries. As you can see, we are about to enter a seasonally unfavorable period.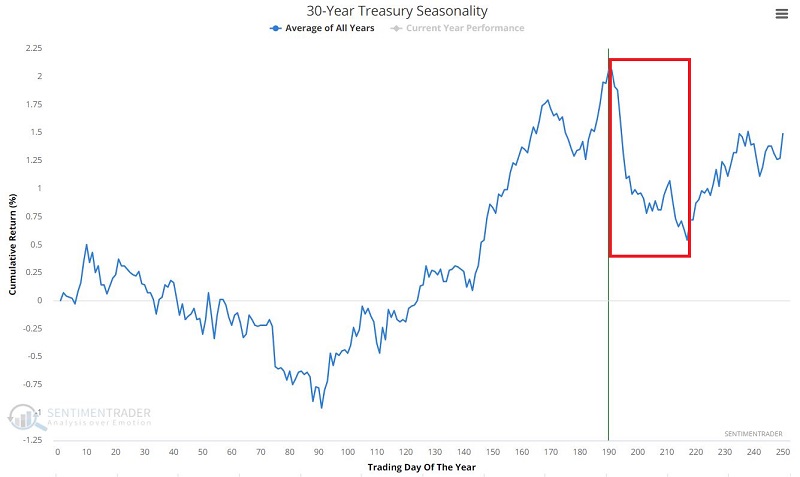
The chart below displays the cumulative $ +(-) from holding a long position in t-bond futures ONLY during the seasonally unfavorable period from Trading Day of the Year 191 through TDY 217.
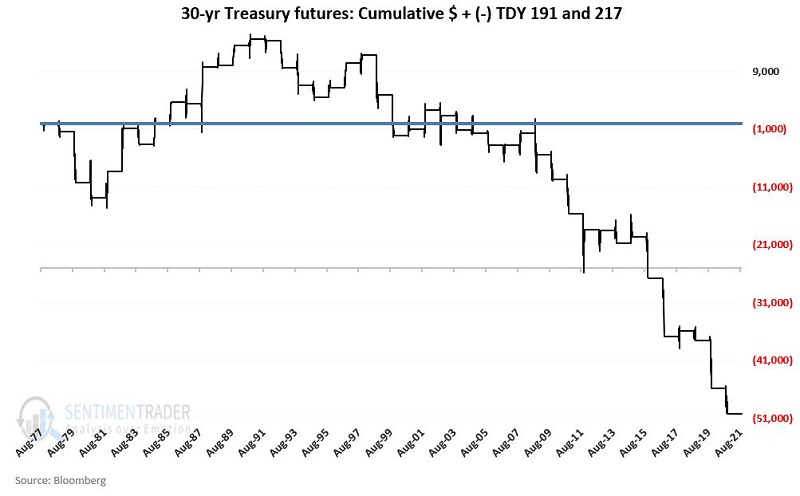
As you can see in the chart above, this period did see some strength in the 1980s. But since then, it has been primarily pure pain.
For the record, since 1977:
- # Times UP = 16
- # Times DOWN = 28
- Average $ UP = +$2,893
- Average $ DOWN = (-$3,446)
However, since 1998:
- # Times UP = 5
- # Times DOWN = 18
- Average $ UP = +$1,725
- Average $ DOWN = (-$3,924)
Can TLT rally sharply after its recent decline? Absolutely. But it would have to do so into the teeth of a strongly unfavorable seasonal headwind.
Let's talk real-world trading.
Some individuals may read the part about seasonality and assume that I am "predicting" a decline in bond prices. But that is not the case. Seasonality is only one piece of the puzzle for any market. The implications for real-world trading are:
- If you are inclined to trade the short side of t-bonds, the seasonal trend and the break below the 200-day moving average suggest that bears have the upper hand and that you might aggressively press the case
- For those who expect the bond market to bounce and rally, the key is to acknowledge that you might be "swimming upstream" in the near-term, therefore the keys are being prudent in terms of position sizing and making sure to ruthlessly manage your risk exposure
BIG PICTURE INTEREST RATE TRENDS
The chart below (courtesy of Tom McClellan) displays the trend in High-Grade Corporate bond yields since 1740.
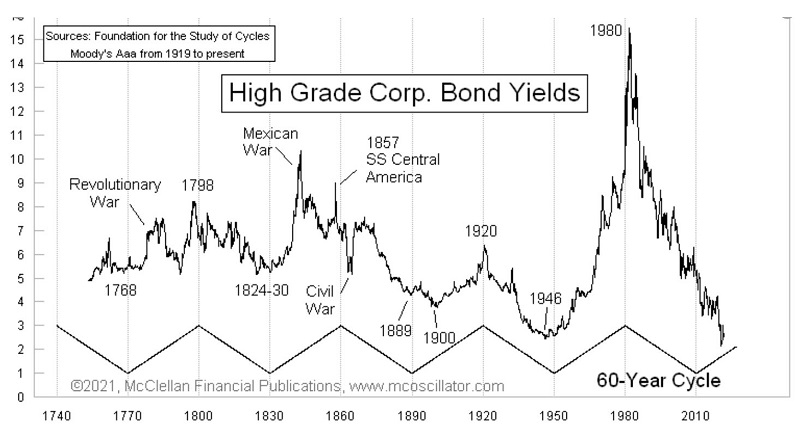
The important thing to note is that rates have a history of long, slow trends - both up and down. In the last 40 years, what we have witnessed is arguably the most extremely one-sided movement in rates EVER.
With Central Banks around the globe seemingly doing everything in their power to force rates to stay low (to finance government debt), there is no way to predict when this trend will ultimately reverse.
The good news is that we DO NOT need to predict "when" the reversal in trend will occur. Because rates trends tend to last for years (and more often, decades), we merely need to keep a close eye open for an objective sign of a confirmed reversal.
The chart below (courtesy of AIQ TradingExpert) displays:
- Ticker TYX (the current 30-year treasury bond yield x 10)
- With its 120-month exponential moving average
Except for one month (October 2018), the 30-year treasury yield has been in a downtrend below its 120-month EMA every month since May 1985 - i.e., a 36-year confirmed downtrend in rates (for the record, rates topped out in October of 1981, making it a 40-year downtrend since the peak).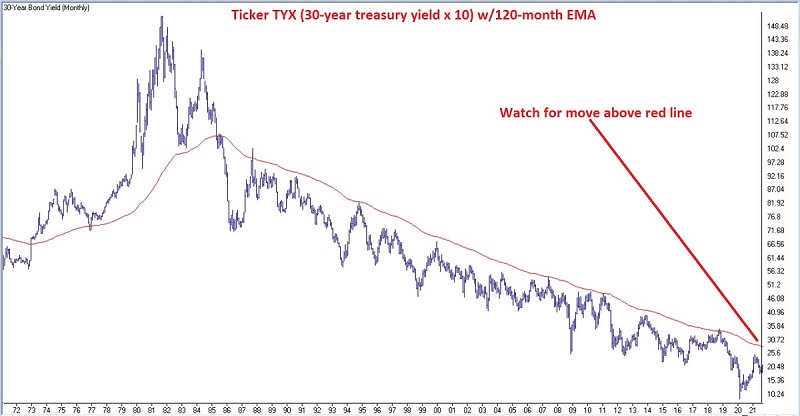
The "theoretical" bottom line:
One day, the current long-term downtrend in rates WILL end. And when it does - I would look at a move by TYX back above its 120-month EMA as confirmation - virtually everything that investors have learned about bonds in the past 40 years will likely go out the window.
The "investing" bottom line:
When rates reverse and begin to trend higher, investors will do well to avoid long-term bonds (which are more sensitive to changes in rates and move inversely in price to rates - i.e., higher interest rates = lower bond prices) and to stick to short-term maturities to be able to re-invest more frequently at higher rates as rates rise.