
What's at Stake in the Month of June

The most important number for the stock market between now and the end of June is 4,204.11. That was the closing price for the S&P 500 Index (SPX) at the end of May.
I will explain the implications in a moment but first, let's start with the summary:
- June SPX close > 4,204.11 = GOOD
- June SPX close < 4,204.11 = DISAPPOINTING
Now onto the actual analysis.
5 STRAIGHT UP MONTHS
- If SPX closes the month of June 2021 above 4,204.11, it will mark the 5th consecutive "Up" month
- Since 1949 there have been 28 previous instances when the S&P 500 Index closed higher 5 consecutive months for the first time in 6 months
The chart below displays the hypothetical monthly equity curve achieved by holding the S&P 500 Index ONLY during the 12 months after each previous signal.
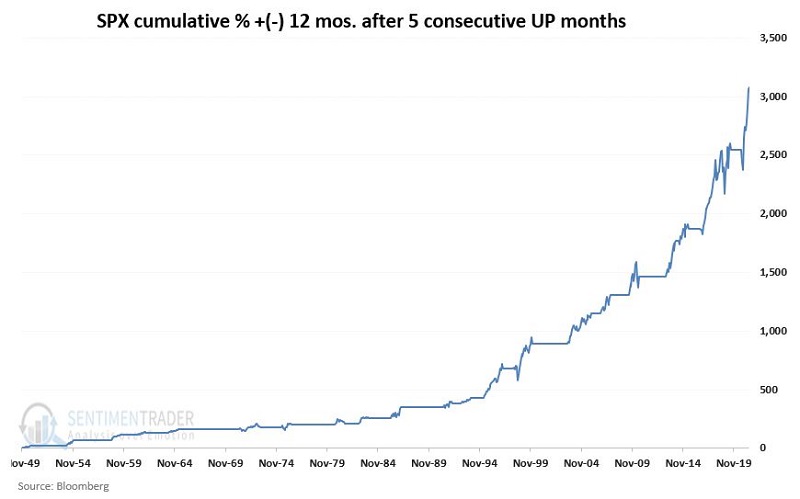
The "Lower Left to Upper Right" nature of the returns is fairly obvious - not to mention fairly compelling. Many investors are surprised by these results as the natural tendency is to believe that after 5 straight positive months, the market is overbought and due for a rest. In reality, momentum is a real thing in the stock market. This simple indicator makes that argument fairly well.
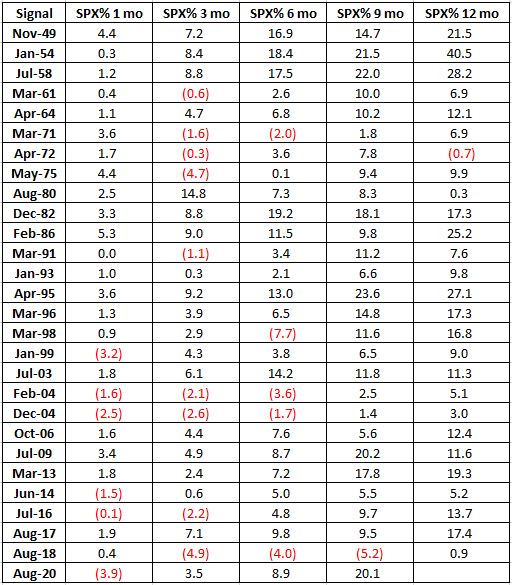
The table below displays the previous signals and SPX % price change over various time periods.
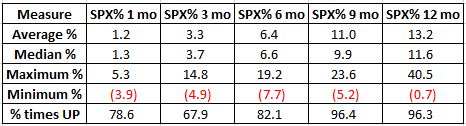
The table below displays the relevant facts and figures for the 12 months after a 5 Straight Up Months signal.
THE 2ND QUARTER TRIFECTA
- If SPX closes the month of June 2021 above 4,204.11, it would mean that April, May, and June all showed a higher close
- Since 1949 there have been 17 previous instances when the S&P 500 Index achieved this "2nd Quarter Trifecta" by closing higher during all 3 months
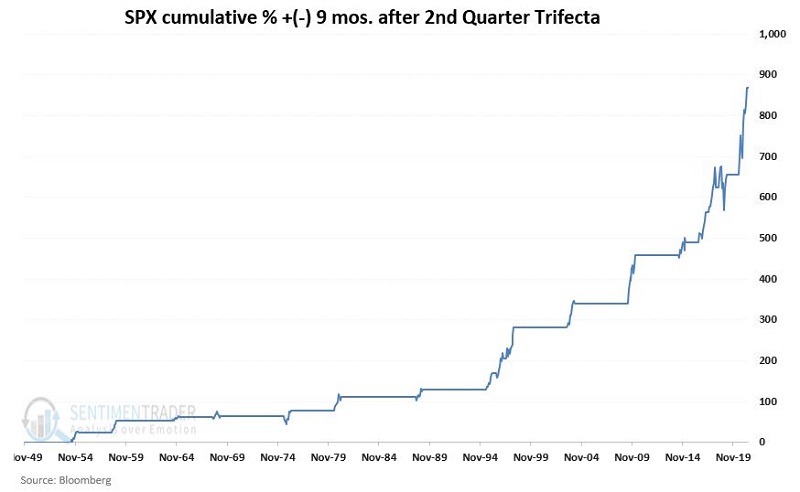
The chart below displays the hypothetical monthly equity curve achieved by holding the S&P 500 Index ONLY during the 9 months after each previous signal.
The table below displays the previous signals and SPX % price change over the next 9 months.
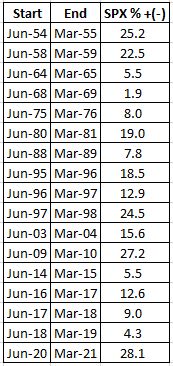
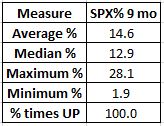
The table below displays the relevant facts and figures for the 9 months after a 2nd quarter Trifecta signal.
SUMMARY
It is hard to imagine that the stock market could continue to advance significantly for another 12 months, given the rally we have seen since the March 2020 low. Nevertheless, history suggests that if the S&P 500 closes the month of June 2021 above 4,204.11, investors may be wise to continue to give the bullish cash the benefit of the doubt.