Indicators &
Backtest Tools
Research
Reports
Report Solutions
Reports Library
Strategies
& Scanner
Free
Resources
Simple Backtest Calculator
Simple Seasonality Calculator
The Kelly Criterion Calculator
Sentiment Geo Map
Public Research Reports
Pricing
Company
About
In the News
Testimonials
Client Success Stories
Contact
Log inLoginSign up
< BACK TO ALL REPORTS

What's the message from the junk bond market?

Dean Christians
2021-01-12
Junk bonds and equities often move in tandem. What if any message can we gain from junk bonds in the current environment?

As Jason and I noted in several studies last week, market breadth has been healthy across many indices and exchanges. In today's note, I plan to review market breadth measures for high yield bonds.

Bond investors, as a group, are generally seen as being the smart money. While the history for market breadth bond data from FINRA TRACE is limited, I believe it still offers some great insight.


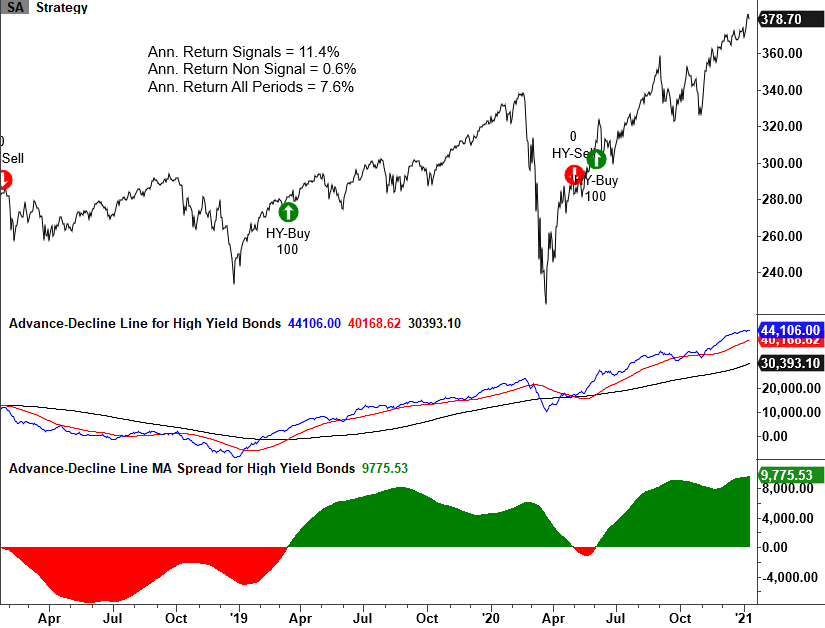
The advance-decline line for junk bond issues continues to make new highs, and the spread between the 50 and the 200-day moving average for the AD line is firmly in expansion territory. Historically, the SPY ETF annualizes at 11.3% when on a golden cross buy signal using the 50 and 200-day moving average.


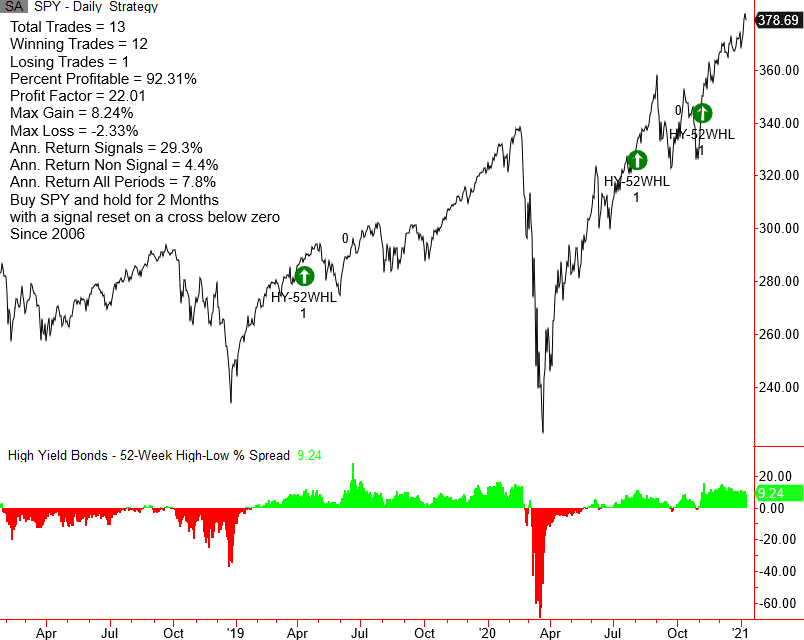
New 52-week highs to continue to exceed new lows. The spread measured in percentage terms currently resides at just a shade over 9%. If I buy the S&P 500 whenever the spread between highs and lows crosses above 10%, the S&P 500 annualizes at an impressive 29.3%.


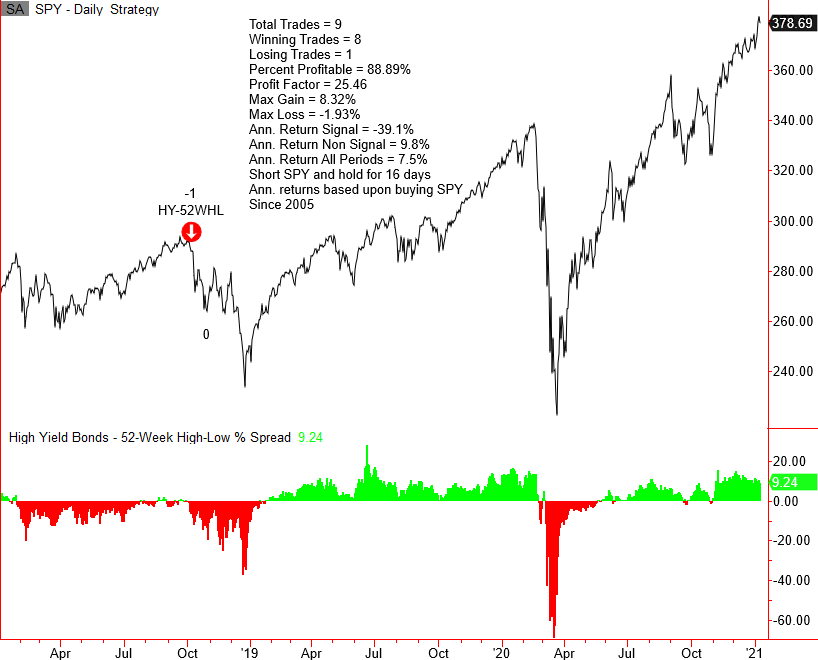
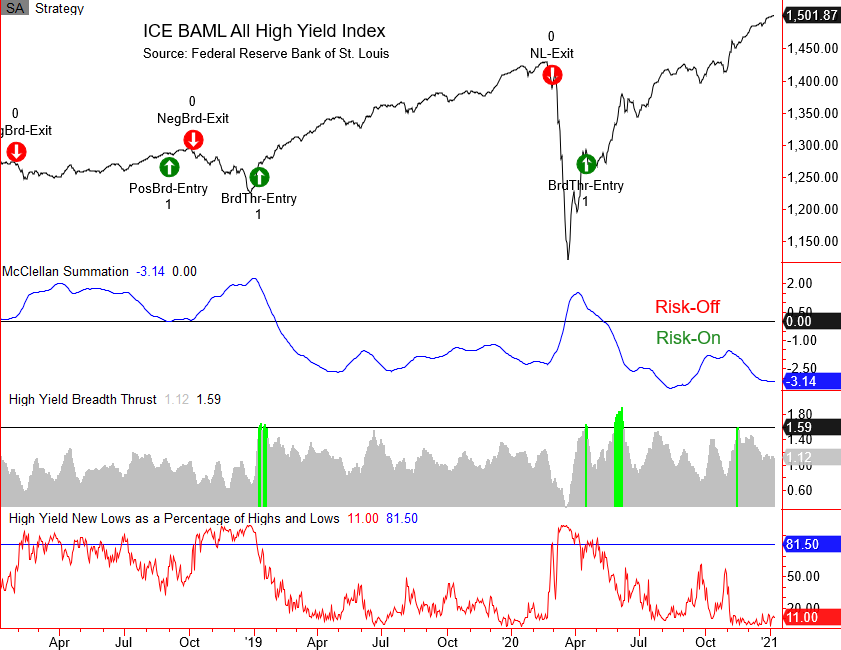
New highs are an essential measure of market breadth, but I keep a close eye on new lows when the markets are trending higher. When an index is near a high and lows are expanding, take note. Currently, high yield new lows are minimal. The risk-off signal in the chart below measures instances when the 52-week high-low % spread for high yield issues crosses below -5%, and the SPY ETF is trading 2.25% or less below a closing high. 


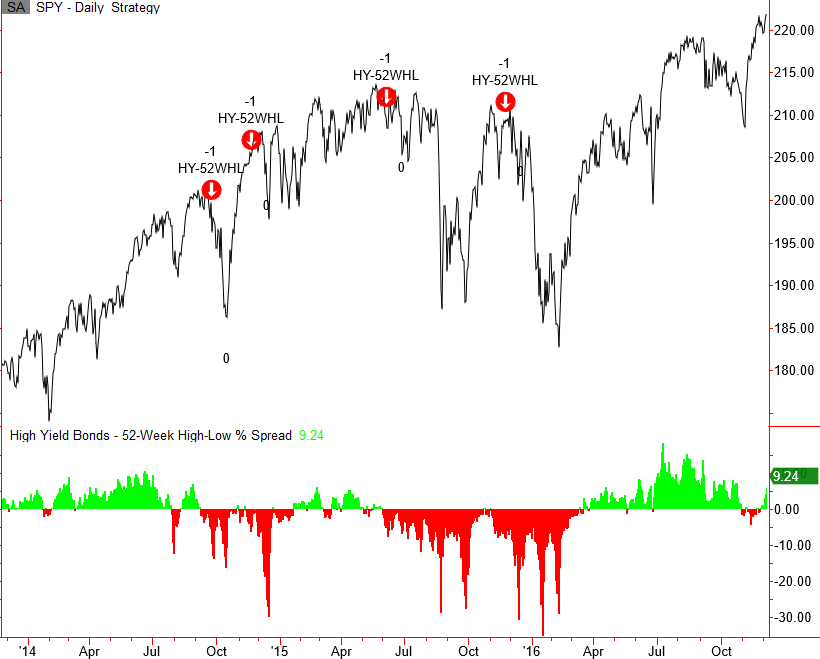
The 2014-16 period provides a perfect example of why I monitor the new high-low % spread.


Several years ago, I created a high yield timing system that incorporates breadth and trend components. One feature utilizes the McClellan Summation Index. As the chart below shows, the indicator is well below levels associated with risk-off periods.


Bottom line: market breadth measures for high yield issues remain constructive and nowhere near levels associated with risk-off periods.

Sorry, you don't have access to this report

Upgrade your subscription plan to get access
Go to Dasboard
Indicators & Backtest Tools
IndicatorEdge
‍
BackTestEdge
‍
Other Tools
‍
DataEdge API
RESEARCH
reports
Research Solution
‍
Reports Library
‍
Strategies & Scanner
Trading Strategies
‍
Smart Stock Scanner
‍
FREE
RESOUrCES
Simple Backtest
Calculator
Simple Seasonality
Calculator
The Kelly Criterion
Calculator
Sentiment Geo Map
‍
Public Research Reports
‍
COMPANY
‍
About
‍
In the News
‍
Testimonials
‍
Client Success Stories
Pricing
Bundle pricing
‍
Announcements
‍
FAQ
© 2025 Sundial Capital Research Inc. All rights reserved.
Setsail Marketing
TermsPrivacyAffiliate Program
Risk Disclosure: Futures and forex trading contains substantial risk and is not for every investor. An investor could potentially lose all or more than the initial investment. Risk capital is money that can be lost without jeopardizing ones’ financial security or life style. Only risk capital should be used for trading and only those with sufficient risk capital should consider trading. Past performance is not necessarily indicative of future results.

Hypothetical Performance Disclosure: Hypothetical performance results have many inherent limitations, some of which are described below. No representation is being made that any account will or is likely to achieve profits or losses similar to those shown; in fact, there are frequently sharp differences between hypothetical performance results and the actual results subsequently achieved by any particular trading program. One of the limitations of hypothetical performance results is that they are generally prepared with the benefit of hindsight. In addition, hypothetical trading does not involve financial risk, and no hypothetical trading record can completely account for the impact of financial risk of actual trading. for example, the ability to withstand losses or to adhere to a particular trading program in spite of trading losses are material points which can also adversely affect actual trading results. There are numerous other factors related to the markets in general or to the implementation of any specific trading program which cannot be fully accounted for in the preparation of hypothetical performance results and all which can adversely affect trading results.

Testimonial Disclosure: Testimonials appearing on this website may not be representative of other clients or customers and is not a guarantee of future performance or success.