
When Sugar is Not So Sweet

Like many commodities, sugar futures have enjoyed a terrific run, having doubled in price since the April 2020 low. However, in recent months the pace of the advance has slowed, and sugar has repeatedly "bumped its head" against overhead resistance. See the chart for October sugar futures below (courtesy of www.Barchart.com).
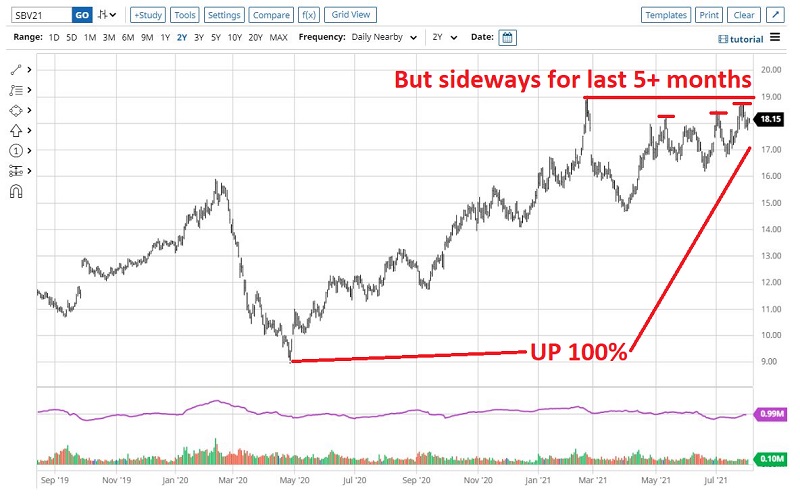
The most bullish thing sugar can do is power up through the 19.00 level and run to new highs. Will this happen? It certainly could. However, at the moment, there are a couple of warning signs to consider.
SEASONALITY
The chart below displays the Annual Seasonal Trend for sugar futures.
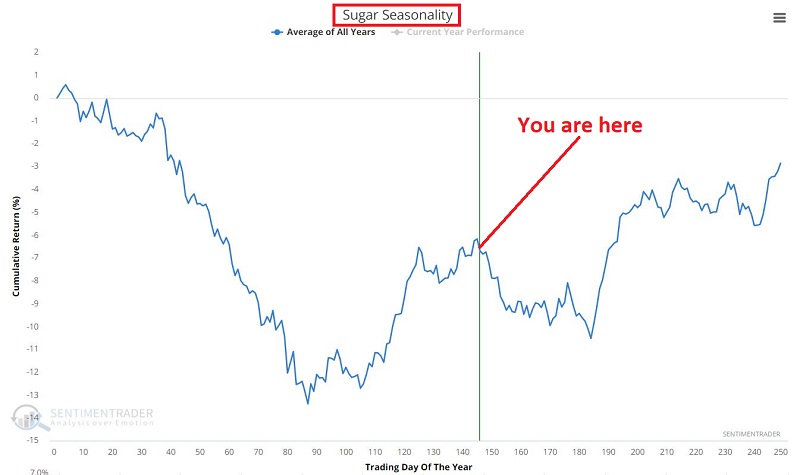
As you can see, the sugar market has just entered a seasonally unfavorable period that lasts from Trading Day of the Year (TDY) #145 through Trading Day of the Year #170. As always, it is essential to point out that seasonal trend charts look backward at what has happened in the past and not forward. In other words, it is NOT a roadmap.
Still, seasonality is a nod to the fact that a large part of trading success comes from finding an "edge" and exploiting it repeatedly. The chart below displays the cumulative hypothetical $ +(-) achieved by holding a long 1-lot of sugar futures from the close on TDY #145 through the close of TDY #170 every year since 1975.
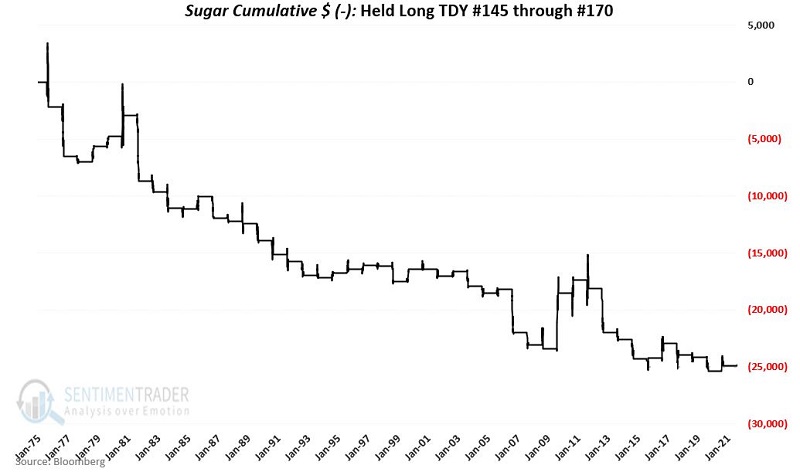
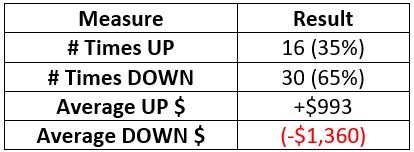
Clearly, a decline in sugar within this period is NOT some "sure thing." Far from it. But the important point is that the "edge" appears to favor the trader looking for an opportunity to play the short side of the market.
For the record, results for sugar during this period since 1975:
SENTIMENT
Based on sentiment, the near-term outlook for sugar is decidedly mixed. In this Backtest Engen Scan, we look for days when:
- The price of sugar is above its 20-day moving average
- The 20-day Optix for sugar is above 70
The signals appear in the chart below, and the results in the table below that. This signal typically occurs as sugar is advancing sharply. In some cases, sugar had topped out quickly, while in many other cases, the rally continued for a while before topping out. It would appear that once this signal occurs, an alert trader might start looking for an actual reversal in price (or an unfavorable seasonal period) to trigger a play on the short side.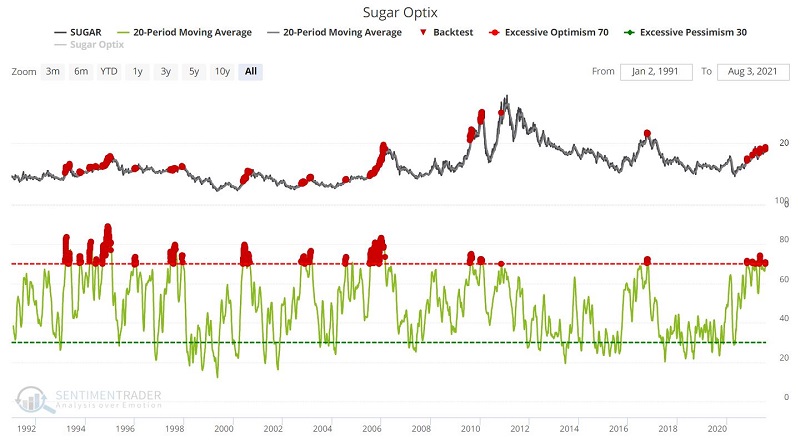
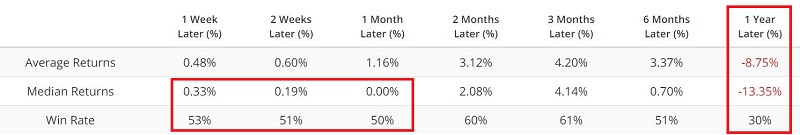
In the first month after signals, the results are basically a coin-flip. Also, note that 1-year returns have been decidedly unfavorable.
SUMMARY
It appears that there is potential for weakness in the sugar market in the month ahead. That said, if sugar breaks out and holds above 19.00, another run to the upside cannot be ruled out.