Products
SentimenTrader Trading Tools
‍
Backtest Engine
My Trading Toolkit
Correlation Analysis
Seasonality
Indicators & Data API
‍
Proprietary Indicators & Charts
Market Data API
Strategies & Scanner
‍
50+ Trading Strategies
Smart Stock Scanner
Research Reports
‍
Research Solutions
Reports Library
Free Resources
Simple Backtest Calculator
Simple Seasonality Calculator
The Kelly Criterion Calculator
Sentiment Geo Map
Public Research Reports
Education
Sentiment Indicators
Technical Indicators
Pricing
Company
About
In the News
Testimonials
Client Success Stories
Contact
Log inLoginSign up
< BACK TO ALL REPORTS

Why it matters whether stocks gap up or down at the open

Jason Goepfert
2022-03-10
The performance of stocks during the day is highly variable depending on how they open. Tech stock insiders keep buying.

Why the open matters for intraday returns

It's long been known that U.S. stocks have performed better overnight than during regular trading hours. Theories abound, but in truth nobody really knows why.

Jay took an in-depth look at this phenomenon in the SPDR S&P 500 ETF Trust (SPY) since its inception. But helpfully, he broke it down by day, and whether each day's open was higher or lower than the previous day's close.

For example, the chart below shows the growth of $1 in SPY held intraday only on Thursdays if SPY opened higher versus the growth of $1 in SPY held intraday if SPY opened lower or unchanged.

SPY on Thursdays overnight vs day session

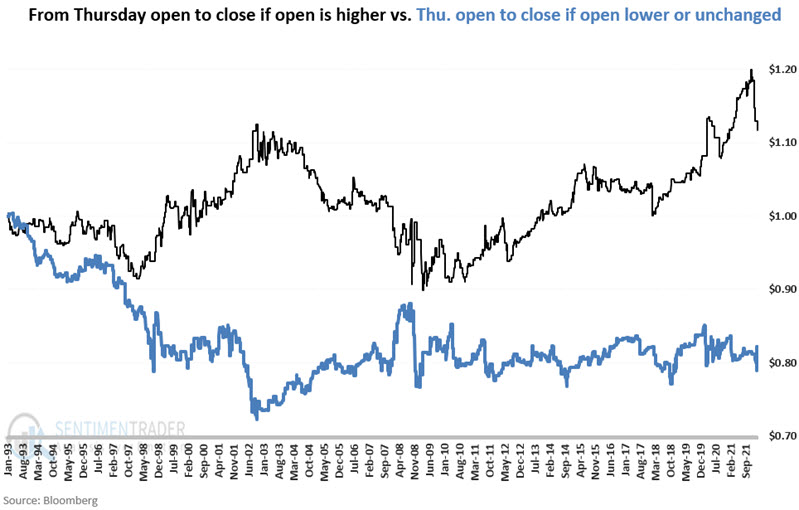
We can clearly see that if stocks opened higher on Thursday, then they tended to do significantly better during regular trading hours as well. A hyper-active trader using this strategy (not including commissions or slippage) would have returned -17.8% if buying SPY after a down open on Thursday. Other days show even more stark differences in performance.

What do tech insiders know?

Jay also noted that insider buying in the technology sector keeps popping up on his radar - and seems completely counter-intuitive based on everything read and heard in the financial press.

Ticker XLK (the upper line in the chart below) tracks an index of technology stocks. The lower line in the chart below represents open market purchases by corporate insiders for companies XLK. The red dots highlight each week when there were more than 17 open market purchases over a rolling 6-month period.

Tech stock insider buying

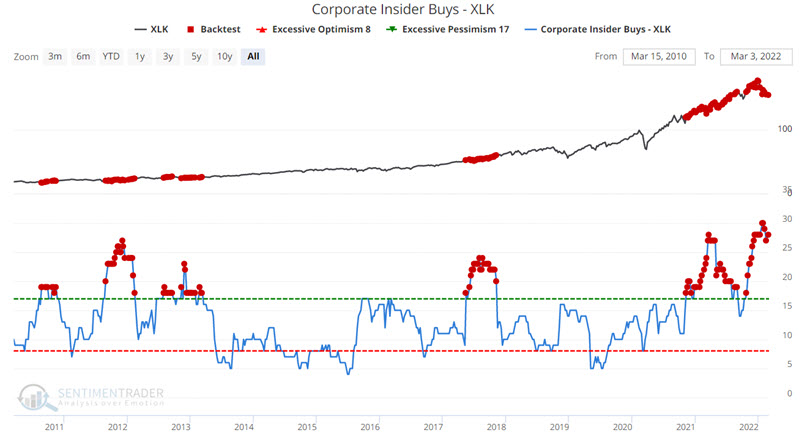
Based on the bearish conventional wisdom narrative and the low level of insider buying in general, the persistent and enthusiastic buying by tech insiders stands completely apart and seems to make no sense at all. So the question becomes, "Are tech insiders crazy, or do they know something we don't know?" What might cause these executives to ignore the doom-and-gloom pundits and buy heavily instead? 

PRODUCTS
SentimenTrader
Trading Tools
Indicators & Data API
‍
Strategies & Scanner
‍
Research Reports
FREE
RESOUrCES
Simple Backtest
Calculator
Simple Seasonality
Calculator
The Kelly Criterion
Calculator
Sentiment Geo Map
‍
Public Research Reports
‍
Education
Sentiment Indicators
‍
Technical Indicators
‍
Pricing
Bundle pricing
‍
FAQ
‍
Announcements
‍
COMPANY
‍
About
‍
In the News
‍
Testimonials
‍
Client Success Stories
CONTACT
‍
General Inquiries
‍
Media Inquiries
‍
Financial Professionals Inquiries
‍
© 2026 Sundial Capital Research Inc. All rights reserved.
Setsail Marketing
TermsPrivacyAffiliate Program
Risk Disclosure: Futures and forex trading contains substantial risk and is not for every investor. An investor could potentially lose all or more than the initial investment. Risk capital is money that can be lost without jeopardizing ones’ financial security or life style. Only risk capital should be used for trading and only those with sufficient risk capital should consider trading. Past performance is not necessarily indicative of future results.

Hypothetical Performance Disclosure: Hypothetical performance results have many inherent limitations, some of which are described below. No representation is being made that any account will or is likely to achieve profits or losses similar to those shown; in fact, there are frequently sharp differences between hypothetical performance results and the actual results subsequently achieved by any particular trading program. One of the limitations of hypothetical performance results is that they are generally prepared with the benefit of hindsight. In addition, hypothetical trading does not involve financial risk, and no hypothetical trading record can completely account for the impact of financial risk of actual trading. for example, the ability to withstand losses or to adhere to a particular trading program in spite of trading losses are material points which can also adversely affect actual trading results. There are numerous other factors related to the markets in general or to the implementation of any specific trading program which cannot be fully accounted for in the preparation of hypothetical performance results and all which can adversely affect trading results.

Testimonial Disclosure: Testimonials appearing on this website may not be representative of other clients or customers and is not a guarantee of future performance or success.