
Why This Has Been A Healthy Pullback

From new high to downtrend
Barely a month after it was sitting at an all-time high, the S&P 500 fell far enough and fast enough to close below its 200-day average.
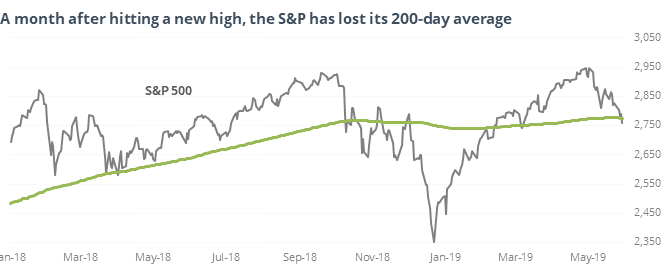
This is one of the index’s quicker turnarounds from being at a multi-year high to falling below its average. When it had spent at least a week above average and then fell below, it had typically been at least a month removed from a new high.
Other times it quickly fell below average after being at a new high, it rarely developed into a more serious correction.
A healthy pullback
While stocks within the S&P 500 have been hit hard shorter-term, most are still in healthy trends. Few stocks are above their 10- and 50-day averages, but more than 50% of them are above their long-term 200-day averages.
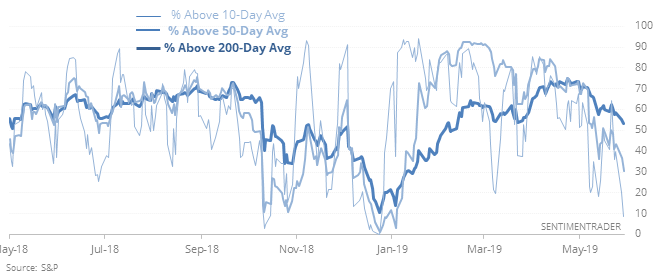
Shorter-term pullbacks like this led to much better returns when more than half of stocks were above average than below, with a difference in returns of more than 4% over the next two months.
Another heavy outflow
Equity mutual funds lost another $42 billion in assets in April, nearly 0.40% of their total assets.
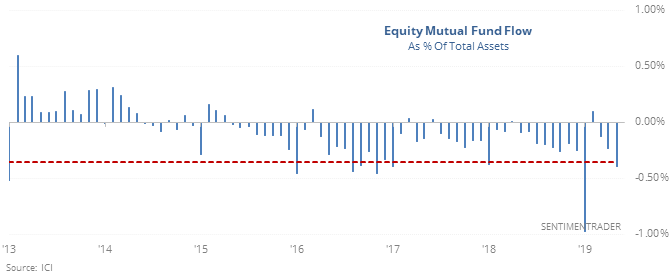
An outflow this large is rare for a month when stocks are still trading above their 12-month average.
Breakaway
Friday was the 2nd potential “breakaway” gap in three days. Since the financial crisis, this has triggered three other times – August 8, 2011, August 24, 2015, and January 7, 2016.
Silver buyers
The latest CoT report showed that “smart money” hedgers mostly retreated from prior extremes. But for only the 2nd time in history, they went net long silver.
This post was an abridged version of our previous day's Daily Report. For full access, sign up for a 30-day free trial now.