Products
SentimenTrader Trading Tools
‍
Backtest Engine
My Trading Toolkit
Correlation Analysis
Seasonality
Market Prediction
Indicators & Data API
‍
Proprietary Indicators & Charts
Market Data API
Strategies & Scanner
‍
50+ Trading Strategies
Smart Stock Scanner
Smart Option Scanner
Research Reports
‍
Research Solutions
Reports Library
Free Resources
Simple Backtest Calculator
Simple Seasonality Calculator
The Kelly Criterion Calculator
Sentiment Geo Map
Public Research Reports
Education
Sentiment Indicators
Technical Indicators
Pricing
Company
About
In the News
Testimonials
Client Success Stories
Contact
Log inLoginSign up
< BACK TO ALL REPORTS

Yen has been hit, and sentiment is sour

Jason Goepfert
2022-03-30
The Japanese yen suffered an almost unbroken string of down days over a multi-week period, one of its worst in history. That has triggered one of the lowest Optimism Index readings in 30 years, just as the currency is entering its most consistently positive time of the year.

Key points:

  • The Japanese yen has suffered a historic bout of selling pressure
  • That has triggered some of the lowest levels of optimism in 30 years
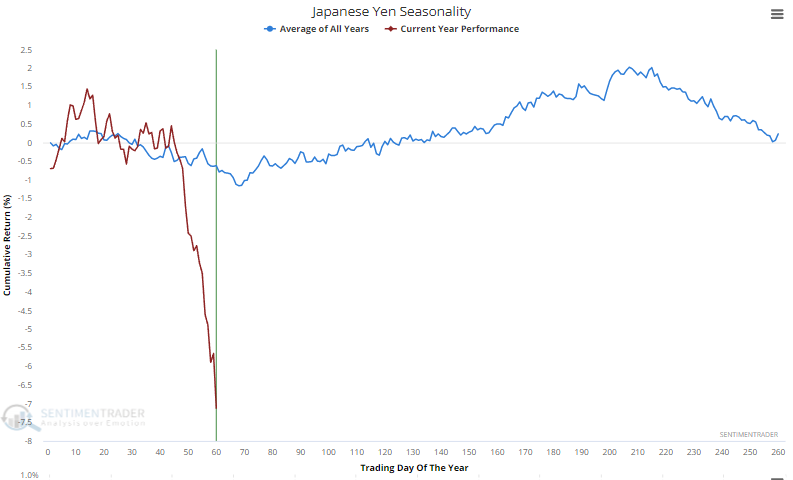
  • The currency is about to enter its most seasonally favorable time of the year

Persistent selling has weighed on sentiment

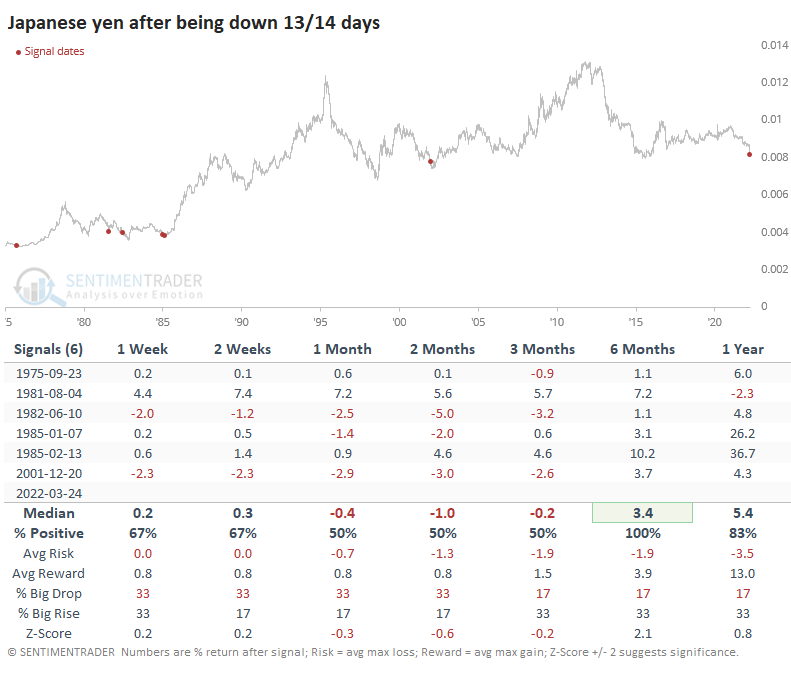
The yen just can't catch a break. Heading into the end of last week, it sunk versus the U.S. dollar on 13 out of 14 sessions. That kind of losing streak has rarely been matched.

The others generally occurred around significant lows but not imminent ones. The yen bounced around for the next 2-3 months but 6 months later was higher each time. Granted, the sample size is tiny.

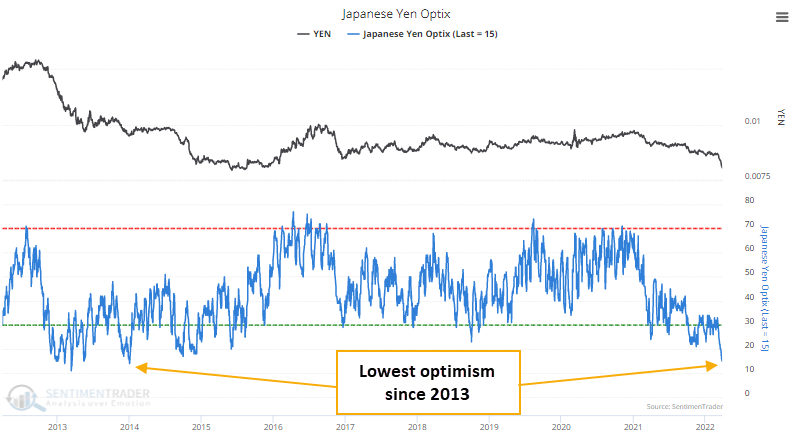
The losses have clearly weighed on sentiment. The Optimism Index for the yen has dropped to the lowest level in nearly a decade.

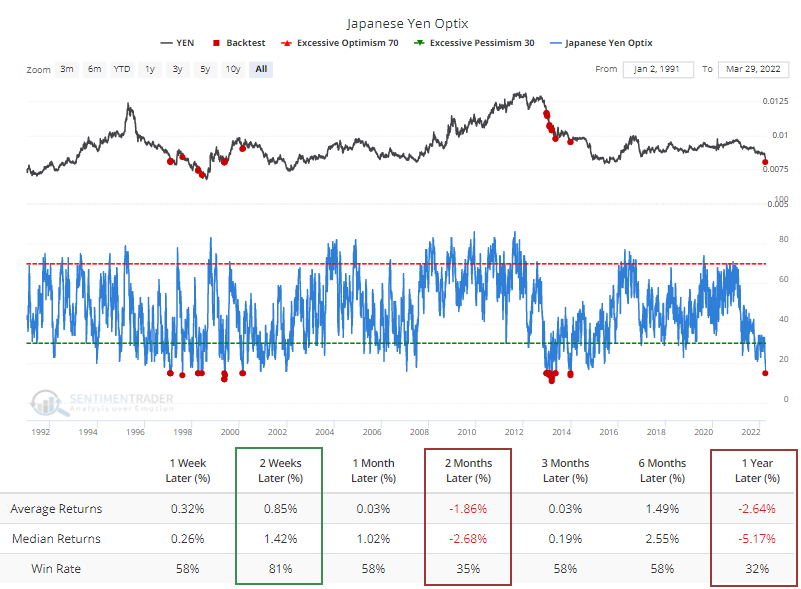
The Backtest Engine shows that a reading of 15 or below leads to quick snapbacks, but most were unsustainable. Only structural bear markets have generated this kind of despair. During structural bull markets, the Optimism Index didn't drop below 20, or if it did, it quickly brought in buyers.

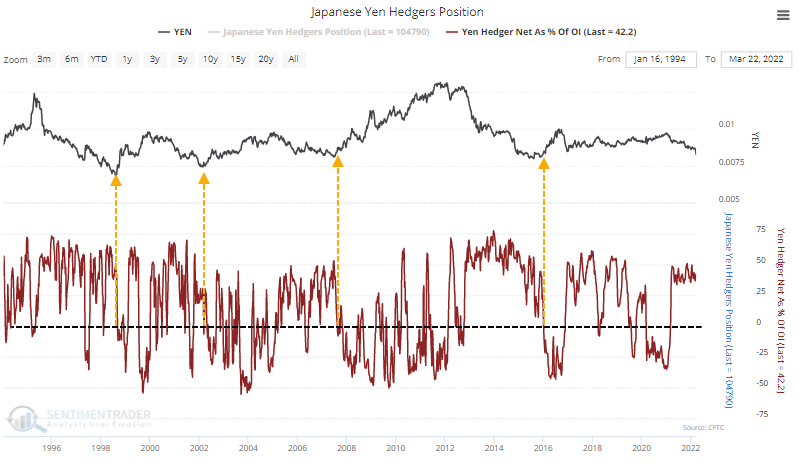
Part of the Optimism Index calculation includes hedgers' positions in the yen. Hedgers take the opposite side of speculators' positions, so a large net long among hedgers means that speculators are heavily short. Which they are; more than 40% of open interest. The problem is that major bottoms in the yen didn't hit bottom when hedgers were heavily long. It bottomed when hedgers started to reverse those positions and went net short, which they are still far from doing.

By definition, hedgers use the futures market only to hedge their day-to-day business operations, so if they go net short, it suggests they have more exposure to the underlying market.

The yen is about to exit its worst seasonal time of the year and enter the best. While much more exaggerated, it has roughly followed its typical pattern.

What the research tells us...

Currency markets tend to be the least reliable for medium-term mean-reversion tactics. The concepts of overbought/oversold or optimism/pessimism can work in very short time frames and very long ones. The multi-month time frames that are the sweet spot for extremes in most other markets aren't very effective in currencies. The yen is a perfect example. While some factors are lining up for a potential rally, it's hard to have a lot of confidence in it. After a historical bout of persistent selling, the currency is entering its best time of the year with extreme pessimism. In most markets, that would be good enough for a speculative bet at least, but risk is high.

PRODUCTS
SentimenTrader
Trading Tools
Indicators & Data API
‍
Strategies & Scanner
‍
Research Reports
FREE
RESOUrCES
Simple Backtest
Calculator
Simple Seasonality
Calculator
The Kelly Criterion
Calculator
Sentiment Geo Map
‍
Public Research Reports
‍
Education
Sentiment Indicators
‍
Technical Indicators
‍
Pricing
Bundle pricing
‍
FAQ
‍
Announcements
‍
COMPANY
‍
About
‍
In the News
‍
Testimonials
‍
Client Success Stories
CONTACT
‍
General Inquiries
‍
Media Inquiries
‍
Financial Professionals Inquiries
‍
© 2026 Sundial Capital Research Inc. All rights reserved.
Setsail Marketing
TermsPrivacyAffiliate Program
Risk Disclosure: The information and tools provided are for research and analytical purposes only and are not intended as investment advice. Market analysis involves uncertainty, and outcomes may differ from expectations. Users should conduct their own due diligence and consider their individual circumstances before making any financial decisions. Past performance is not necessarily indicative of future results.

Hypothetical Performance Disclosure: Hypothetical performance results have many inherent limitations, some of which are described below. No representation is being made that any account will or is likely to achieve profits or losses similar to those shown; in fact, there are frequently sharp differences between hypothetical performance results and the actual results subsequently achieved by any particular trading program. One of the limitations of hypothetical performance results is that they are generally prepared with the benefit of hindsight. In addition, hypothetical trading does not involve financial risk, and no hypothetical trading record can completely account for the impact of financial risk of actual trading. for example, the ability to withstand losses or to adhere to a particular trading program in spite of trading losses are material points which can also adversely affect actual trading results. There are numerous other factors related to the markets in general or to the implementation of any specific trading program which cannot be fully accounted for in the preparation of hypothetical performance results and all which can adversely affect trading results.

Testimonial Disclosure: Testimonials appearing on this website may not be representative of other clients or customers and is not a guarantee of future performance or success.