Products
SentimenTrader Trading Tools
‍
Backtest Engine
My Trading Toolkit
Correlation Analysis
Seasonality
Indicators & Data API
‍
Proprietary Indicators & Charts
Market Data API
Strategies & Scanner
‍
50+ Trading Strategies
Smart Stock Scanner
Research Reports
‍
Research Solutions
Reports Library
Free Resources
Simple Backtest Calculator
Simple Seasonality Calculator
The Kelly Criterion Calculator
Sentiment Geo Map
Public Research Reports
Pricing
Company
About
In the News
Testimonials
Client Success Stories
Contact
Log inLoginSign up
< BACK TO ALL REPORTS

Another Month, Another Record High

Jason Goepfert
2021-09-01
September has the lowest probability of seeing a new high in stocks, and when the S&P 500 (and other indexes) close the month of August at an all-time high, short-term returns tended to be terrible.

This year will go down in the history books as one of the best for investors. It already has in many respects, as we outlined two months ago. And it just keeps going.

September and October are well-known as being the most challenging for traders, as stocks have tended to see their worst returns and highest volatility. In a premium post yesterday, Jay showed that over the past 120 years, if an investor held the Dow Industrials only during September and October, their return would have been -74% (though it hasn't been nearly as bad since 2008).

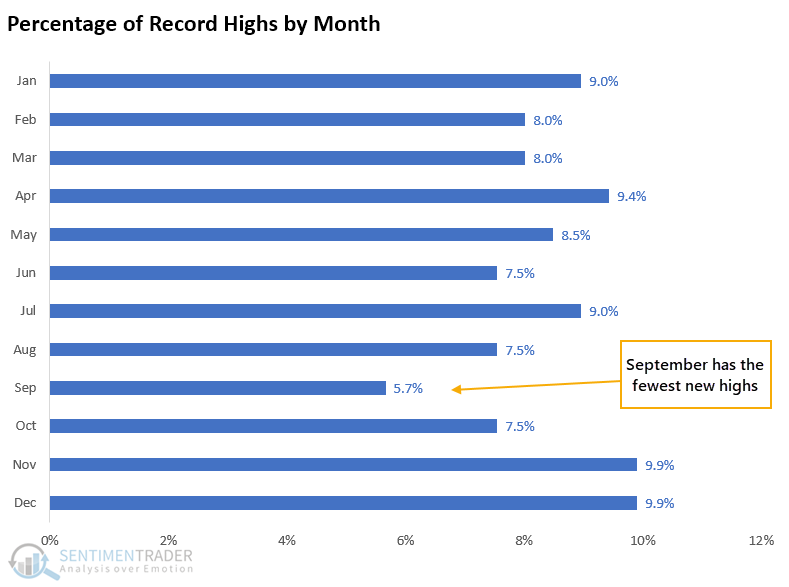
It's relatively unusual for the S&P 500 to close at a record high in August. It would be even more unusual if it did it in September.

Since 1928, there have been 1,124 months, of which 212 closed at a record high. Out of those, only 12 occurred in September.

A SHORT-TERM WARNING

Stocks have rolled right over every possible negative in 2021, and seasonality is a tertiary factor anyway. So maybe we need to take the following table with a big grain of salt. It shows returns in the S&P 500 after it closes the month of August at an all-time high, and it's a sea of red.

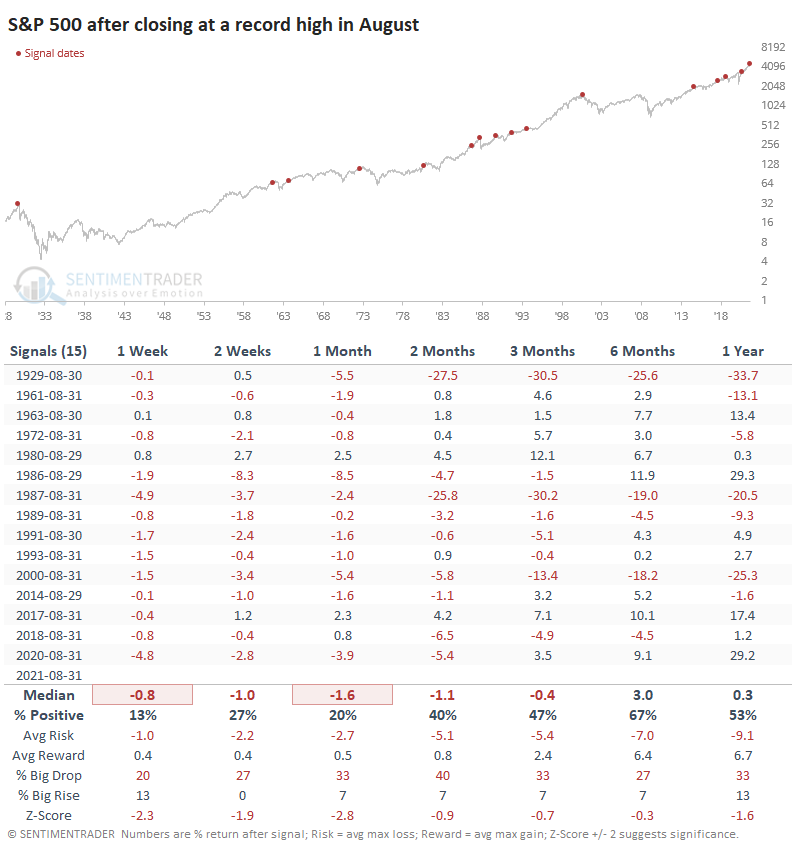
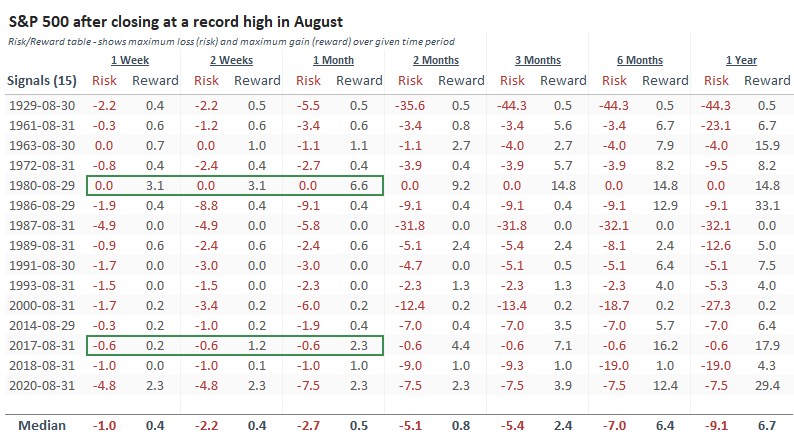
Even though by definition, momentum was strong, the S&P had an incredibly hard time holding onto its gains over the next month. Most remarkably, the Risk/Reward Table shows that only two signals saw more reward than risk during the next month.

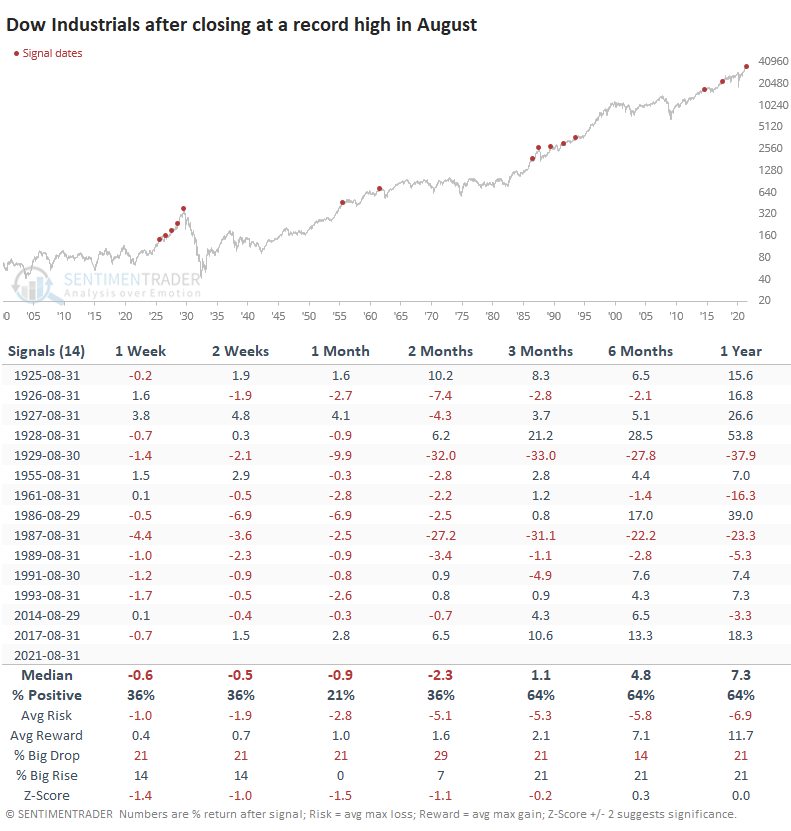
THE S&P WAS THE WORST

Looking at the other major indexes, the Dow Industrials also closed August at an all-time high. It, too, had a strong tendency to see some backing-and-filling over the next month or so, with an extremely poor risk/reward ratio up to two months later.

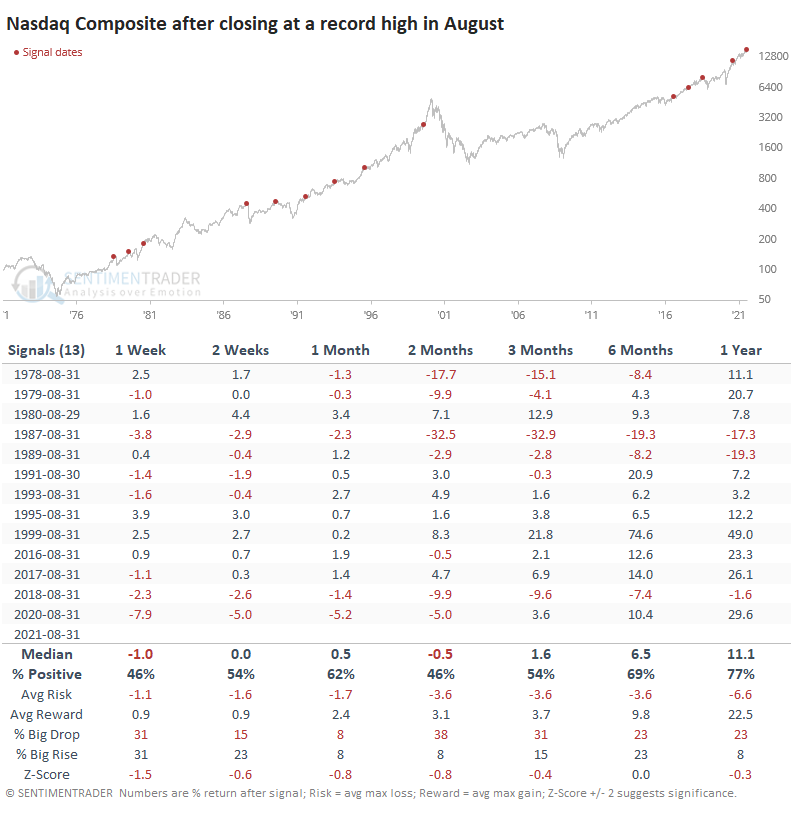
The Nasdaq Composite often does its own thing, and we can see from the table below that it had less of a tendency to see weakness after a new high in August. The last two signals saw a wicked pullback for traders, for what that's worth.

This has been a historic year for momentum in stocks, and when it is high-quality, momentum usually rolls over every other factor until it stops for whatever random reason. There is zero evidence that's going to be the case any time soon. Breadth has been questionable, which puts a dent in the "high-quality momentum" argument, but then there was an incredibly impressive thrust last week, so maybe that's moot. Buyers have been able to make doubters look like fools in 2021, and based on September's tendency, they have their work cut out for them again.

Sorry, you don't have access to this report

Upgrade your subscription plan to get access
Go to Dasboard
PRODUCTS
SentimenTrader
Trading Tools
Indicators & Data API
‍
Strategies & Scanner
‍
Research Reports
FREE
RESOUrCES
Simple Backtest
Calculator
Simple Seasonality
Calculator
The Kelly Criterion
Calculator
Sentiment Geo Map
‍
Public Research Reports
‍
Pricing
Bundle pricing
‍
Announcements
‍
FAQ
COMPANY
‍
About
‍
In the News
‍
Testimonials
‍
Client Success Stories
CONTACT
‍
General Inquiries
‍
Media Inquiries
‍
Financial Professionals Inquiries
‍
© 2025 Sundial Capital Research Inc. All rights reserved.
Setsail Marketing
TermsPrivacyAffiliate Program
Risk Disclosure: Futures and forex trading contains substantial risk and is not for every investor. An investor could potentially lose all or more than the initial investment. Risk capital is money that can be lost without jeopardizing ones’ financial security or life style. Only risk capital should be used for trading and only those with sufficient risk capital should consider trading. Past performance is not necessarily indicative of future results.

Hypothetical Performance Disclosure: Hypothetical performance results have many inherent limitations, some of which are described below. No representation is being made that any account will or is likely to achieve profits or losses similar to those shown; in fact, there are frequently sharp differences between hypothetical performance results and the actual results subsequently achieved by any particular trading program. One of the limitations of hypothetical performance results is that they are generally prepared with the benefit of hindsight. In addition, hypothetical trading does not involve financial risk, and no hypothetical trading record can completely account for the impact of financial risk of actual trading. for example, the ability to withstand losses or to adhere to a particular trading program in spite of trading losses are material points which can also adversely affect actual trading results. There are numerous other factors related to the markets in general or to the implementation of any specific trading program which cannot be fully accounted for in the preparation of hypothetical performance results and all which can adversely affect trading results.

Testimonial Disclosure: Testimonials appearing on this website may not be representative of other clients or customers and is not a guarantee of future performance or success.