Headlines
|
|
Tech's Relative Weakness Suggests More To Come:
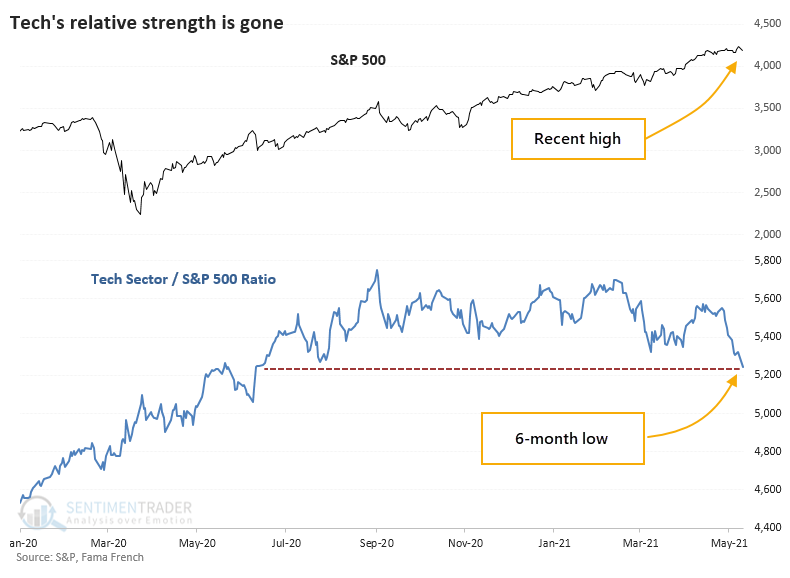
Even though the S&P 500 was just at a record high, the ratio of the Technology sector to the S&P just fell to a 6-month low. Similar behavior preceded weak returns in Tech stocks, especially relative to the S&P.
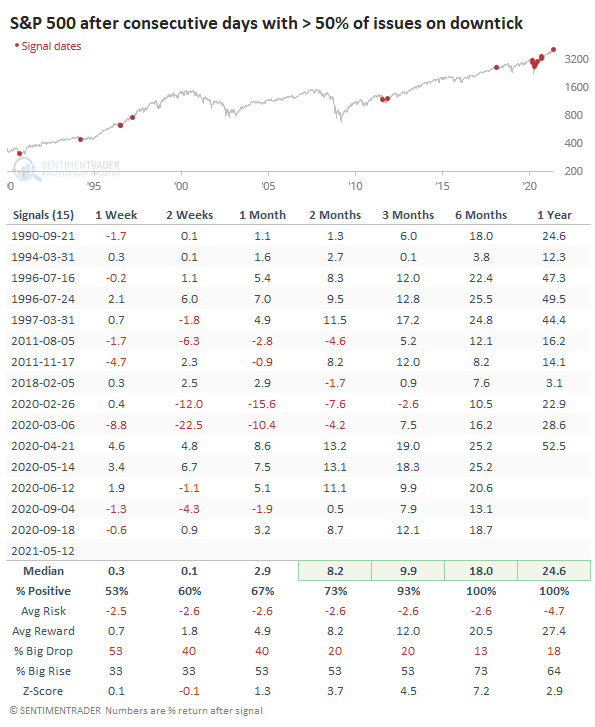
TICK season: Soon after the open on Tuesday, stocks suffered the worst bout of concentrated selling pressure in history. On Wednesday afternoon, more sell programs hit. There haven't been too many times in the past 30+ years when more than half of the securities trading on the NYSE downtick at the same time. It didn't mean too much in the short-term (which we'd put more weight on given that it's a short-term indicator), but there were no losses over the next 6-12 months.
Bottom Line:
See the Outlook & Allocations page for more details on these summaries STOCKS: Weak sell
The speculative frenzy in February is getting wrung out. Internal dynamics have mostly held up, with some recent exceptions. Most of our studies show a poor risk/reward over the short- to medium-term, with a more positive skew longer-term. BONDS: Hold
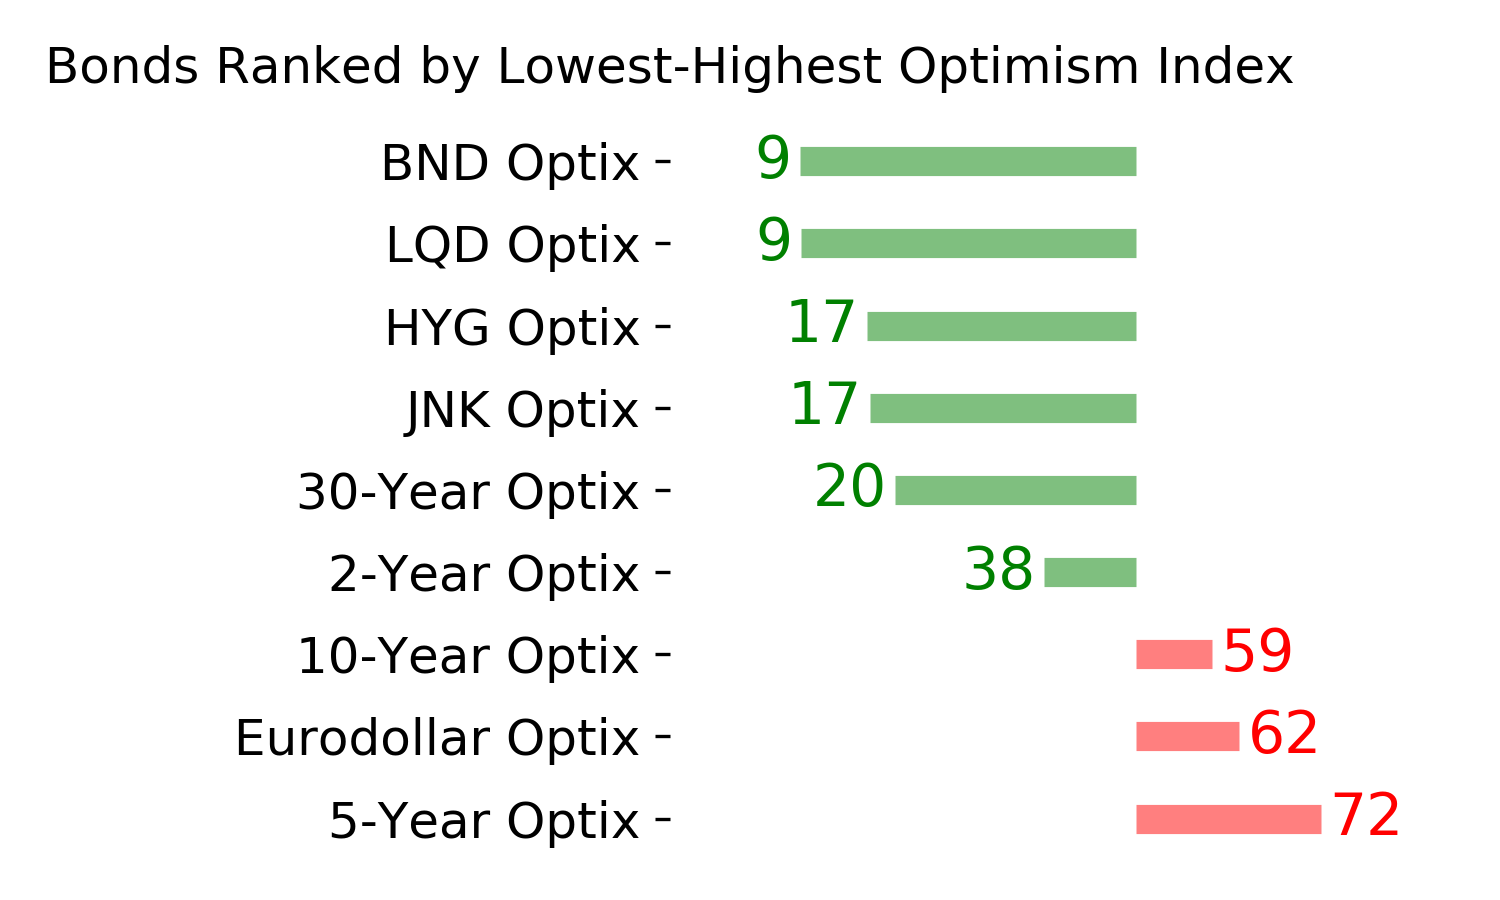
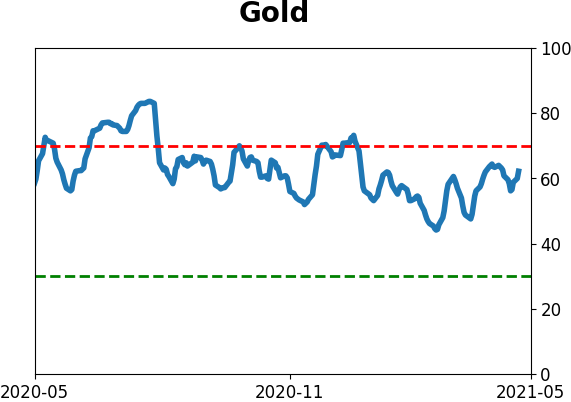
Various parts of the market got hit in March, with the lowest Bond Optimism Index we usually see during healthy environments. After a shaky couple of weeks, the broad bond market has modestly recovered. Not a big edge here either way. GOLD: Weak buy
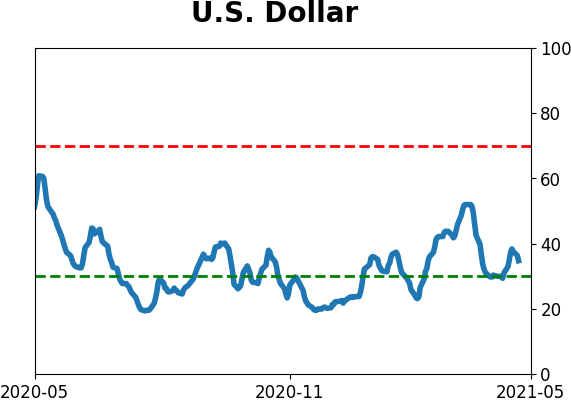
The dollar keeps failing on bulls' hopes that it's finally going to turn a corner, so that's been good for gold and miners. Studies from recent months remain in effect, with a modest positive bias.
|
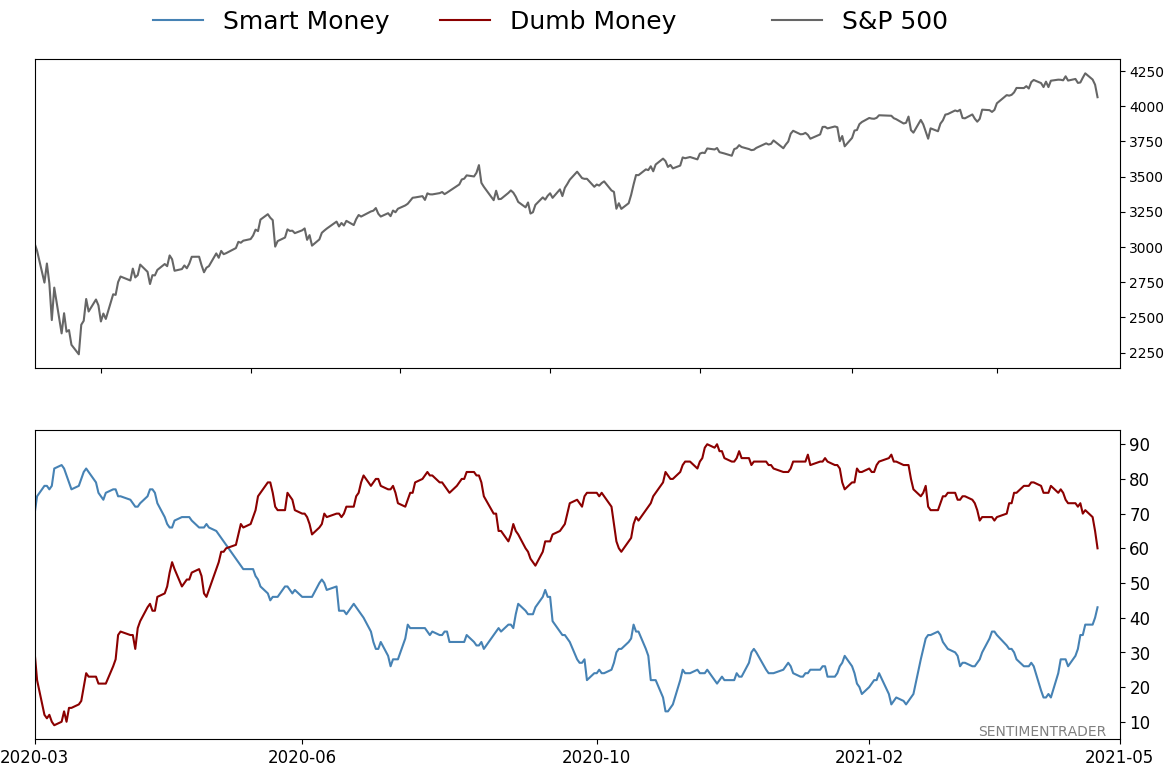
Smart / Dumb Money Confidence
|
Smart Money Confidence: 43%
Dumb Money Confidence: 60%
|
|
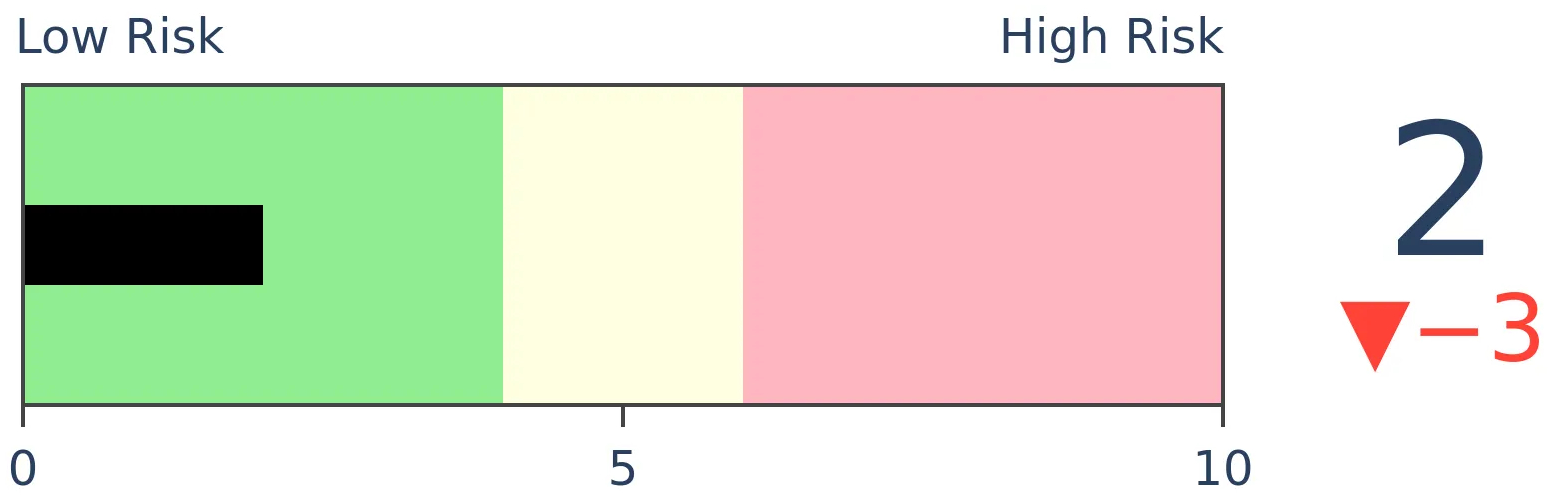
Risk Levels
Stocks Short-Term
|
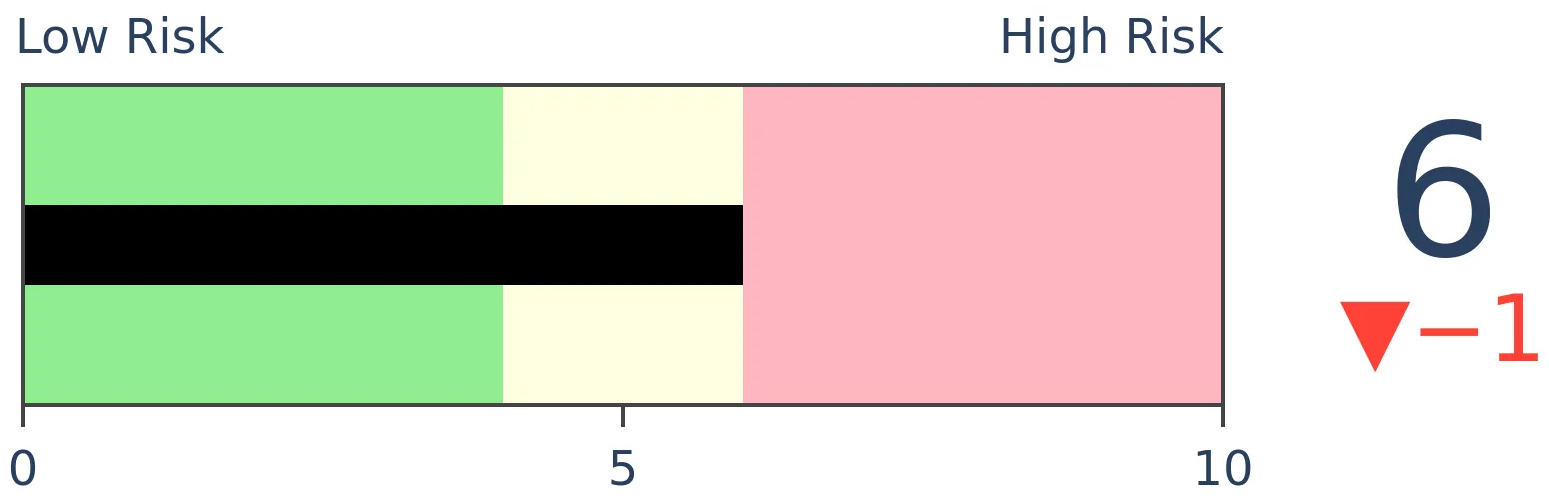
Stocks Medium-Term
|
|
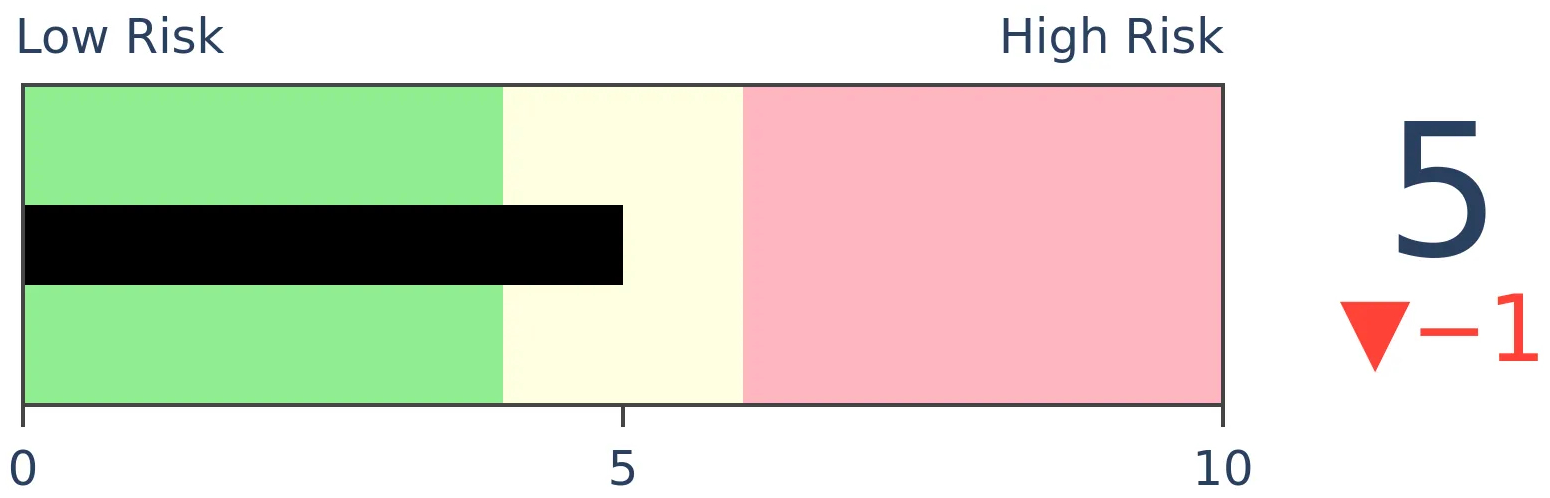
Bonds
|
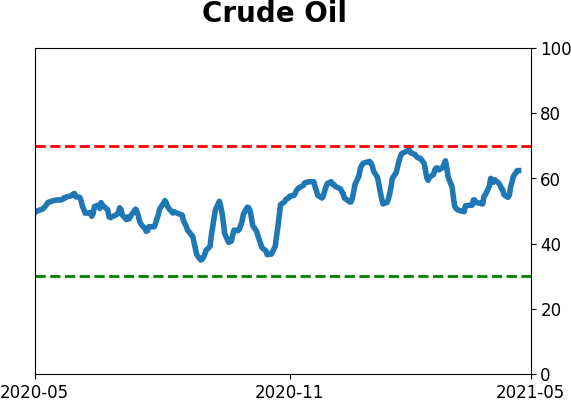
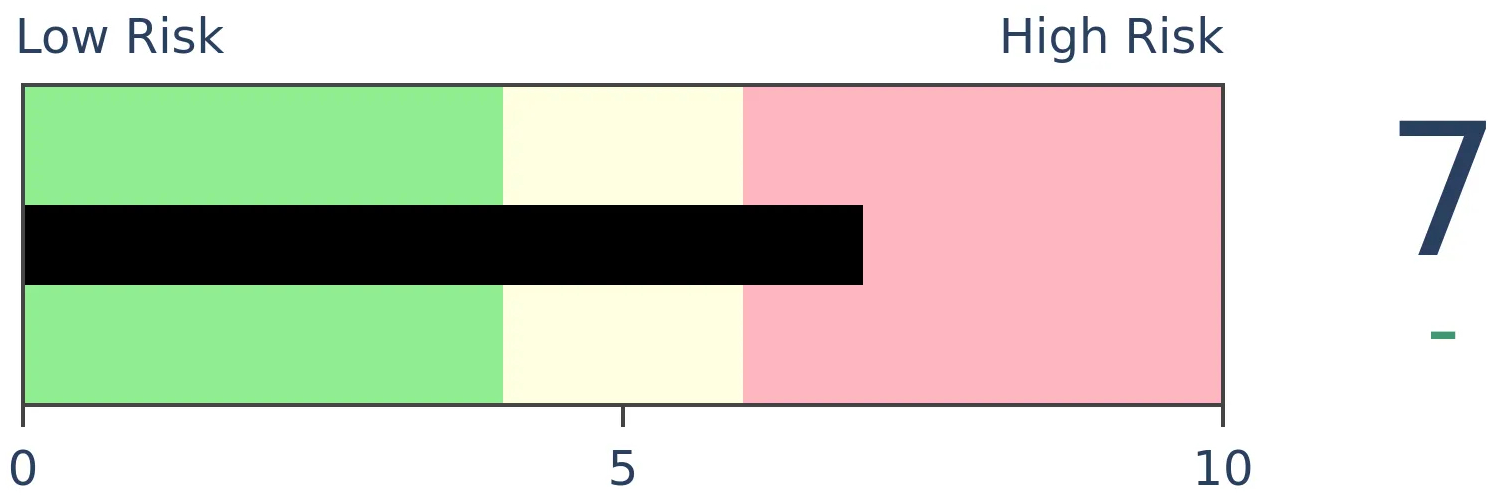
Crude Oil

|
|
Gold

|
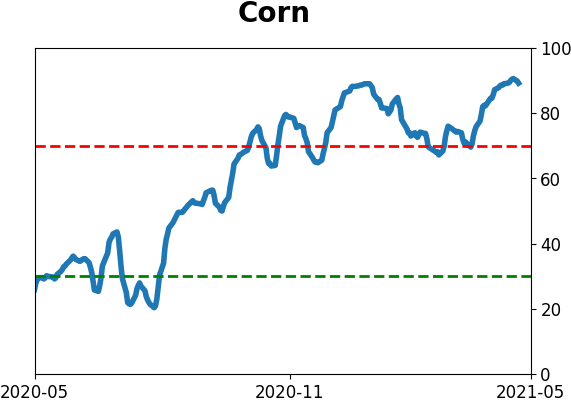
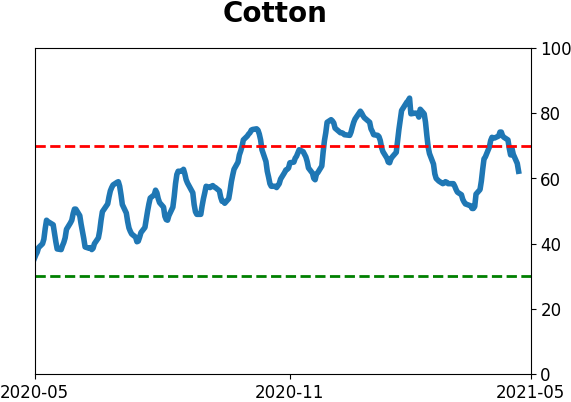
Agriculture
|
|
Research
BOTTOM LINE
Even though the S&P 500 was just at a record high, the ratio of the Technology sector to the S&P just fell to a 6-month low. Similar behavior preceded weak returns in Tech stocks, especially relative to the S&P.
FORECAST / TIMEFRAME
None
|
Tech was in the driver's seat for much of the past year. After an option-fueled blowoff in February, those stocks have treaded water, at best, while other parts of the market recover enough to trigger a nearly 80-year extreme in new highs.
This relative weakness in tech stocks has been enough to push the ratio between them and broader indexes nearly to the lowest level in a year. This does not often happen when indexes like the S&P 500 were sitting at all-time highs a few short days ago.
FUTURE RETURNS WERE CHALLENGED
Whenever the S&P 500 had been at a 52-week high, then within 3 days, the ratio of Tech to the S&P fell to a 6-month low, the S&P showed weak short-term returns, but it didn't have much of a consistent impact beyond that.
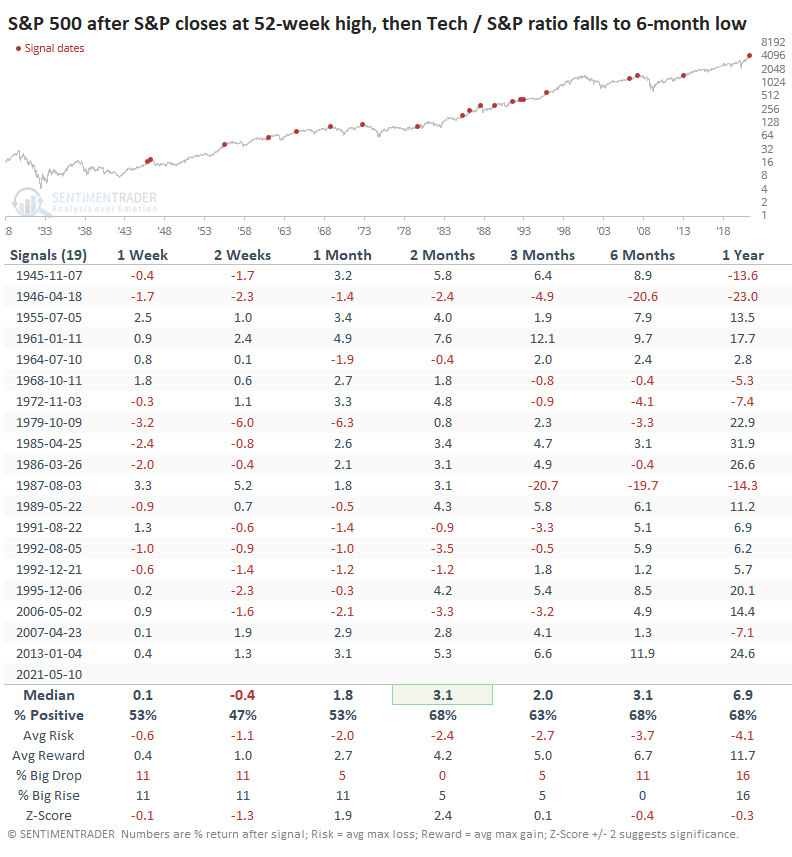
The last two instances, in 2007 and 2013, didn't lead to anything nefarious. Before that, though, the last 6 signals all preceded short- to medium-term losses.
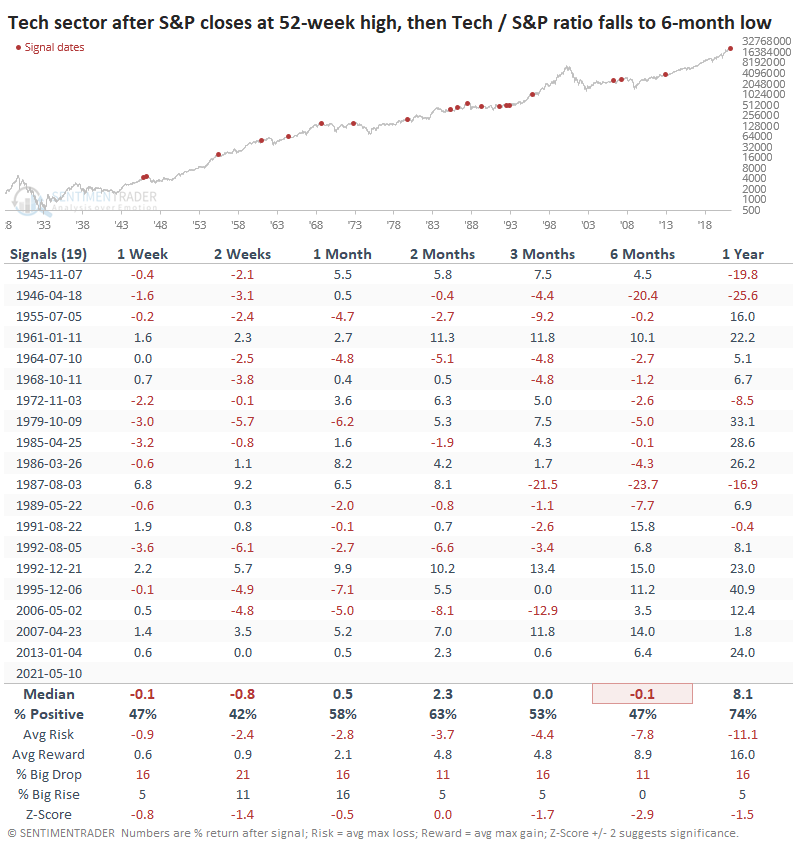
It was a considerably worse sign for the Technology sector, though. Over the next 6 months, it showed a negative average return, was positive less than half the time and suffered risk about equal to reward.
TECH USUALLY DIDN'T RESUME LEADERSHIP
The tendency for Tech to show weaker returns means that the ratio of Tech to the S&P showed a consistently negative bias.
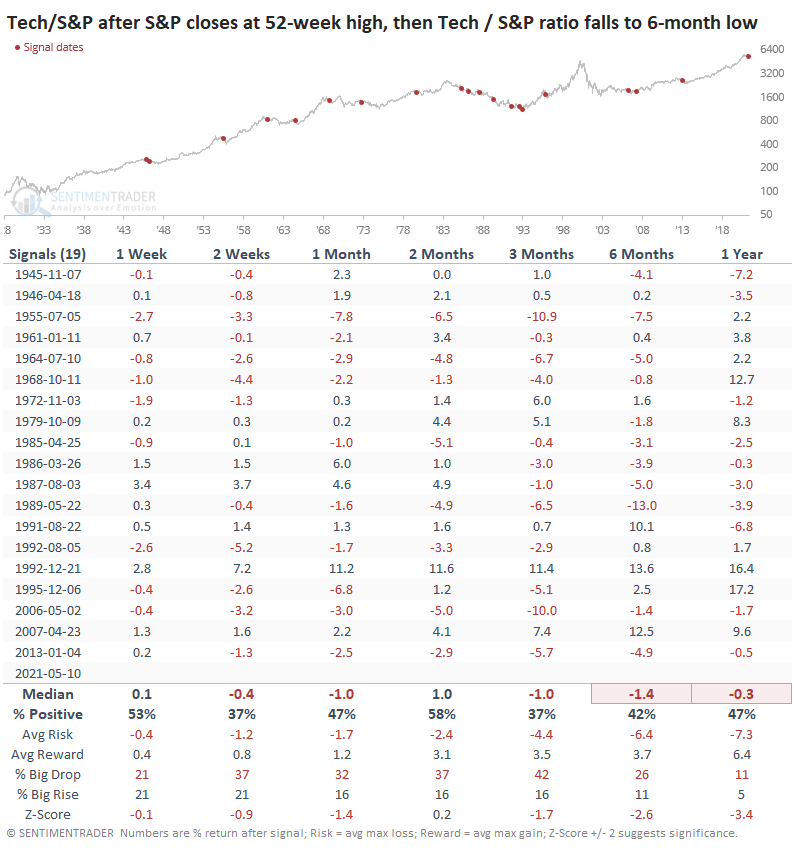
Across almost all time frames, the ratio was negative, and significantly so over the medium- to long-term. Over the past 30 years, there were only 2 exceptions when Tech managed to turn itself around from relative weakness and become a leader again. The others all failed.
A common market tactic is to focus longs on leading groups and shorts on trailing ones. That works, except for those major turning points when the relationships hit an extreme and mean-revert. There isn't much we see lately that suggests Tech is at that point, so we should continue to see these stocks underperform a broader basket.
Active Studies
| Time Frame | Bullish | Bearish | | Short-Term | 0 | 0 | | Medium-Term | 1 | 11 | | Long-Term | 11 | 4 |
|
Indicators at Extremes
Portfolio
| Position | Description | Weight % | Added / Reduced | Date | | Stocks | RSP | 0.0 | Reduced 4.9% | 2021-04-22 | | Bonds | 30.0% BND, 8.8% SCHP | 37.9 | Added 15.1% | 2021-02-18 | | Commodities | GCC | 2.5 | Reduced 2.1%
| 2020-09-04 | | Precious Metals | GDX | 9.8 | Added 0.1% | 2021-02-18 | | Special Situations | 4.3% XLE, 2.2% PSCE | 6.5 | Reduced 5.6% | 2021-04-22 | | Cash | | 43.3 | | |
|
Updates (Changes made today are underlined)
I've made no adjustments for months, as the situation remained essentially stuck - energy was doing what it should, sentiment in the broader market was ridiculously stretched but with no major warning signs, and sentiment toward gold and bonds appeared overdone on the pessimistic side. Those conditions have started to reverse a bit, so I further reduced my risk. There are still no major warning signs, but I'm getting increasingly uncomfortable and would prefer to sit safely in cash and wait for better risk/reward opportunities. RETURN YTD: 8.1% 2020: 8.1%, 2019: 12.6%, 2018: 0.6%, 2017: 3.8%, 2016: 17.1%, 2015: 9.2%, 2014: 14.5%, 2013: 2.2%, 2012: 10.8%, 2011: 16.5%, 2010: 15.3%, 2009: 23.9%, 2008: 16.2%, 2007: 7.8%
|
|
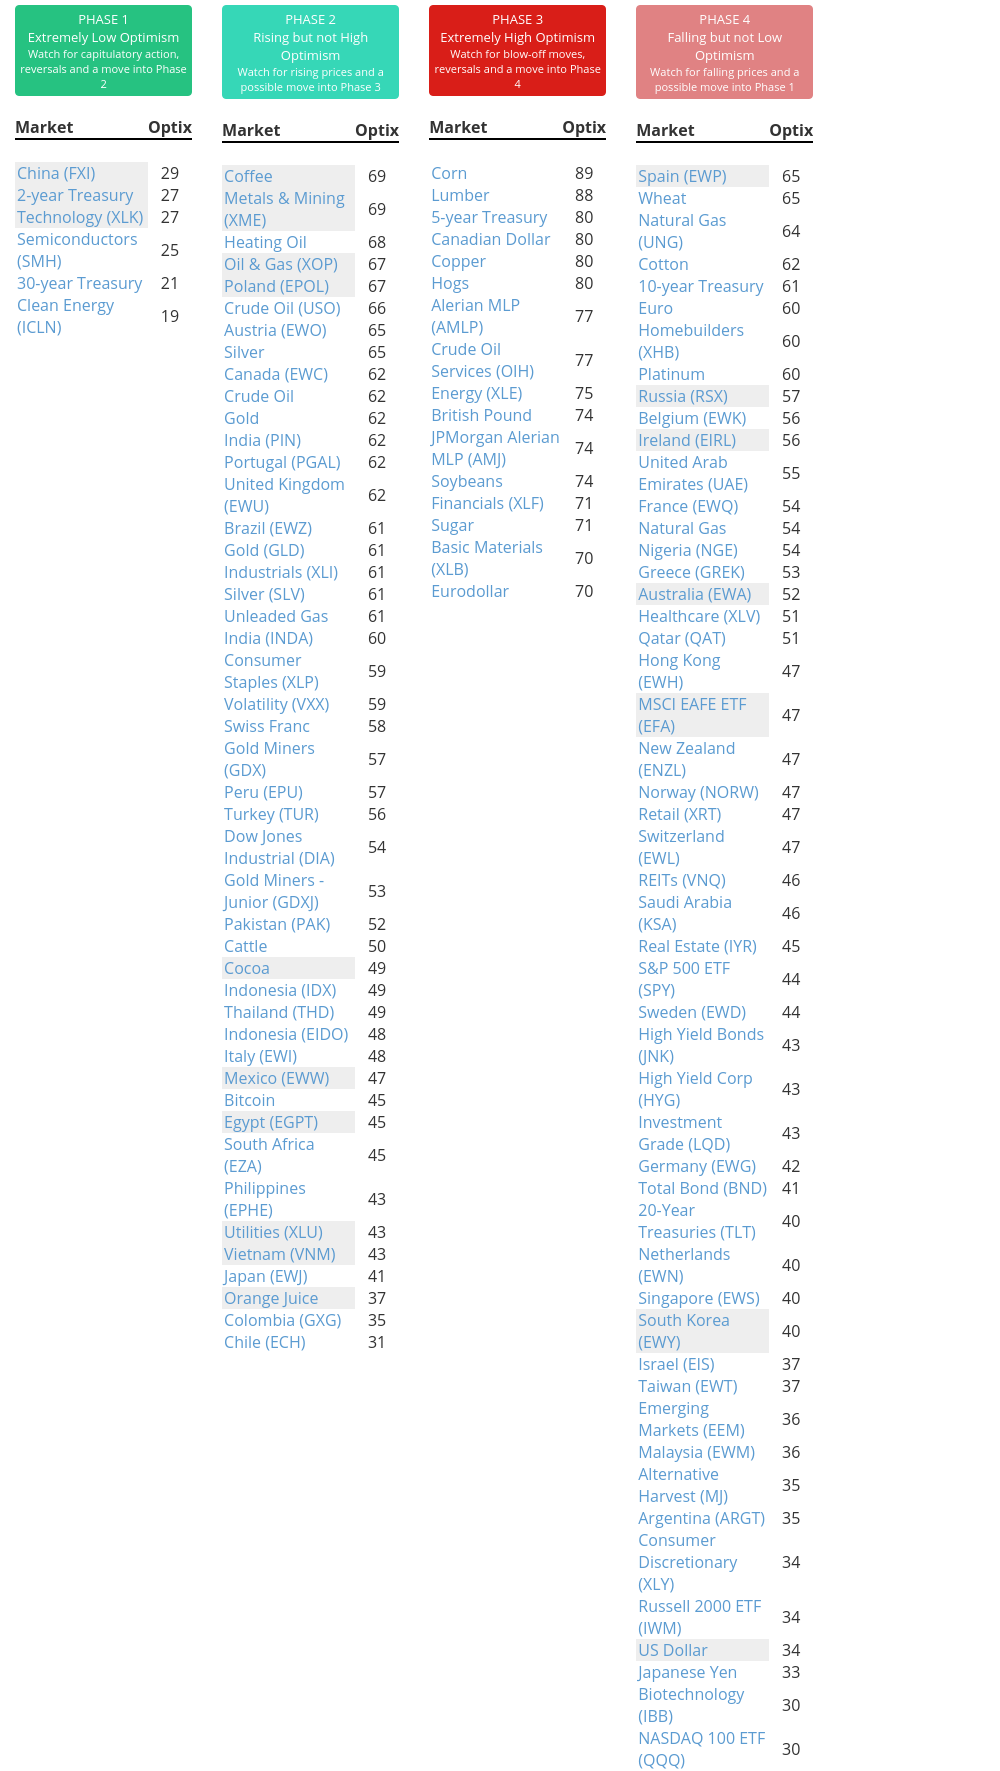
Phase Table
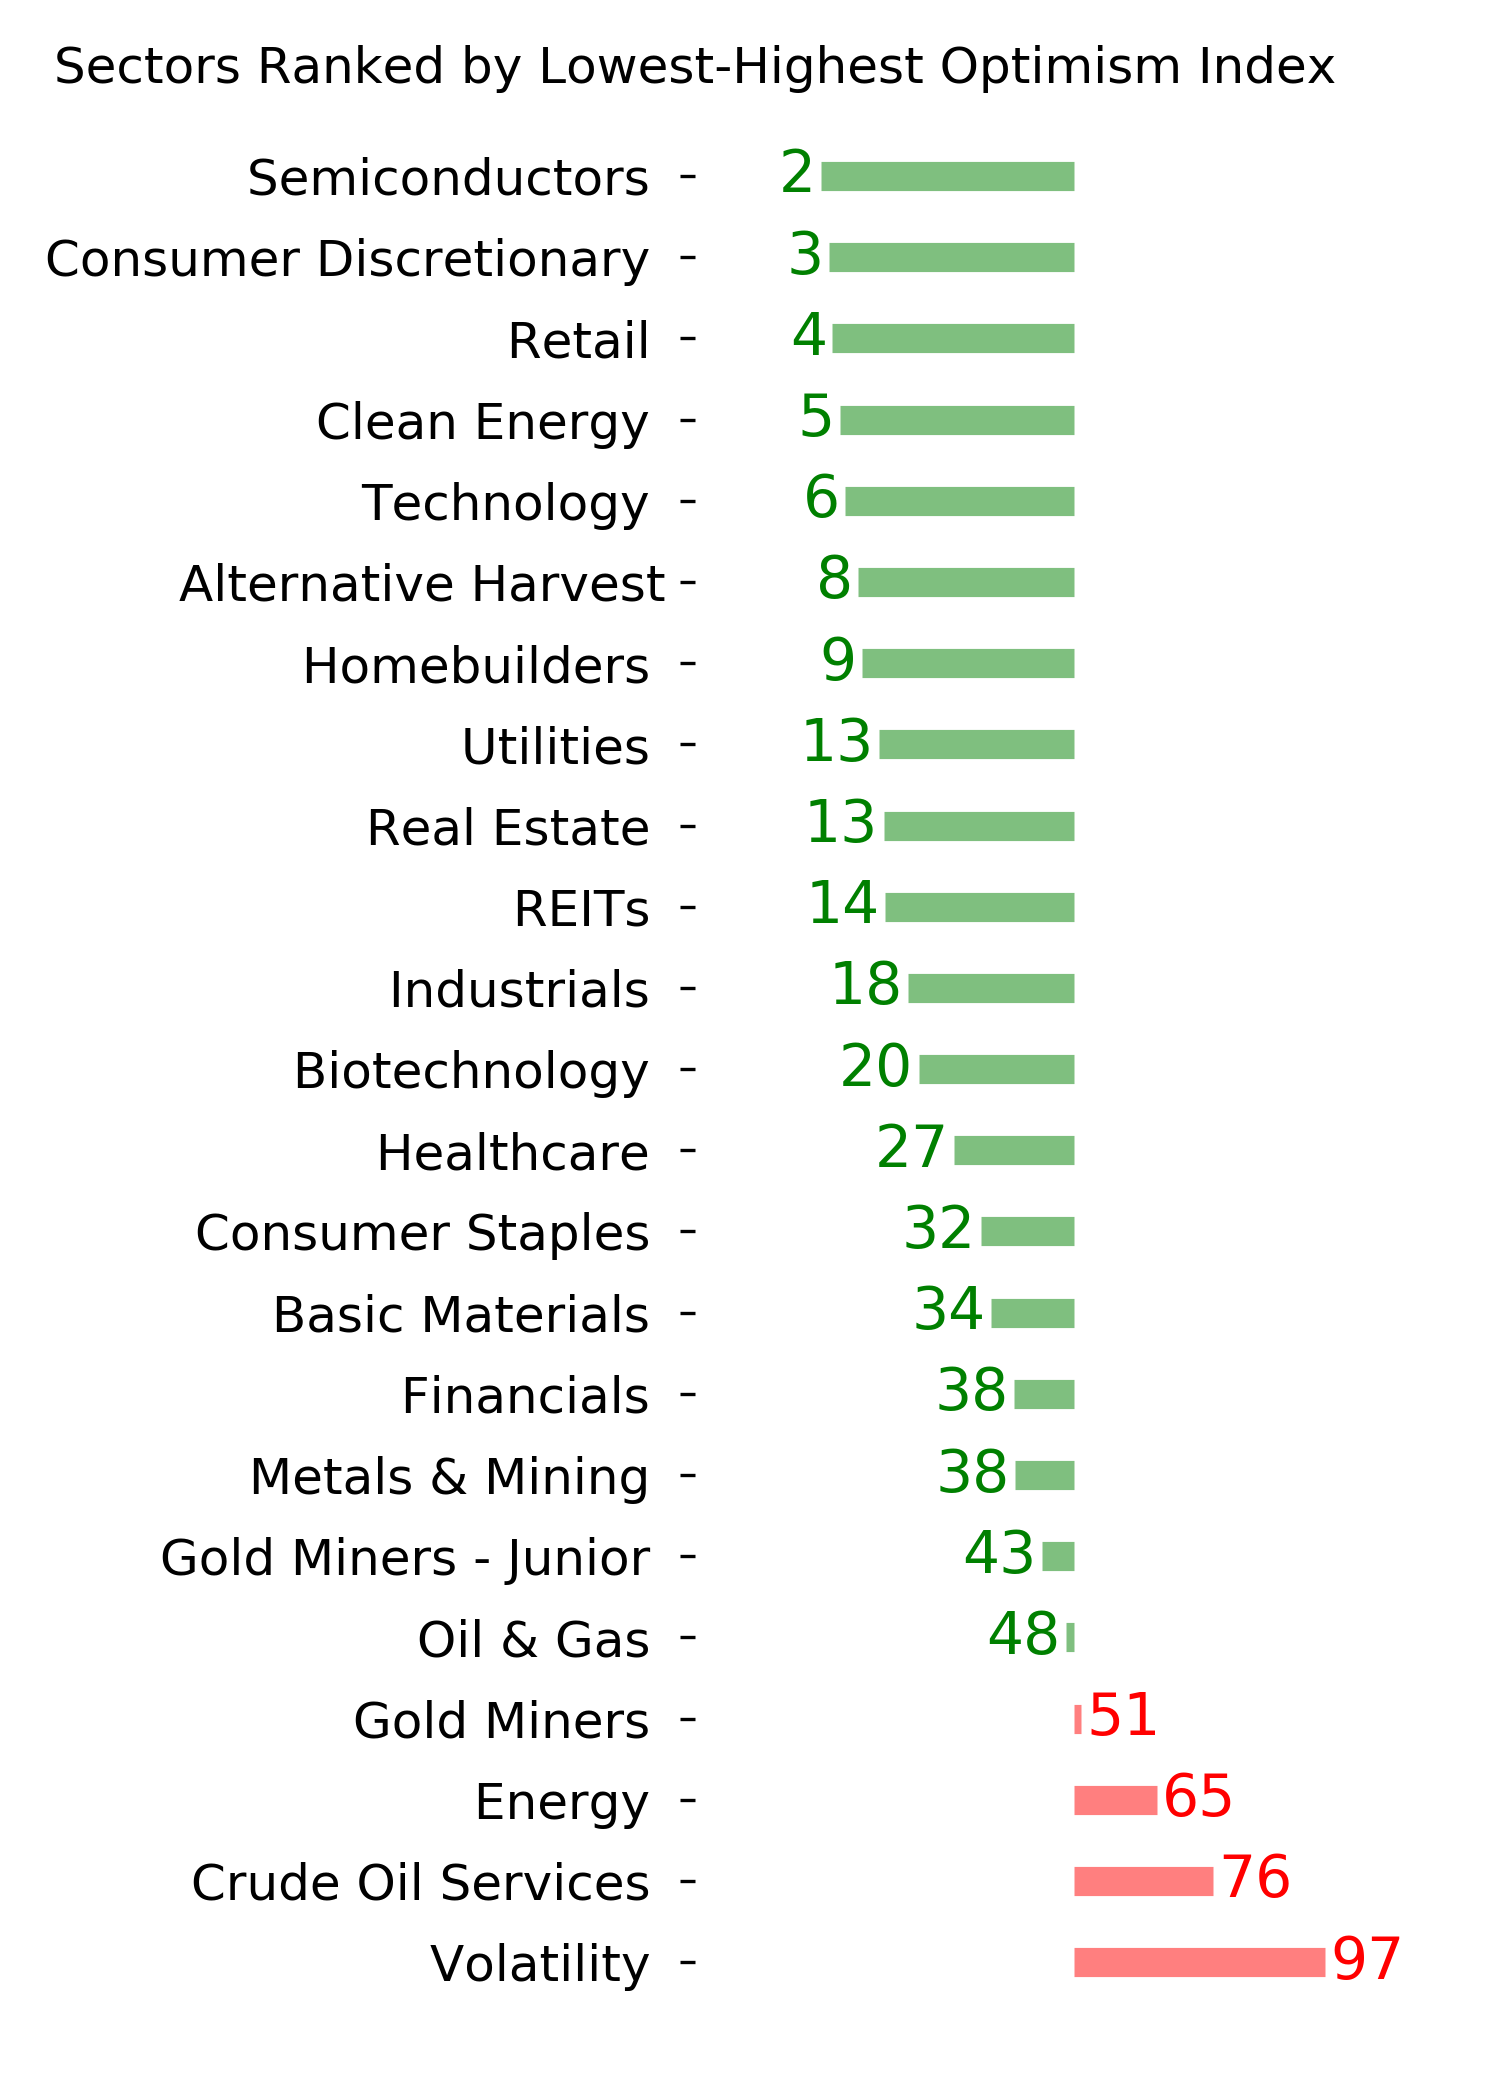
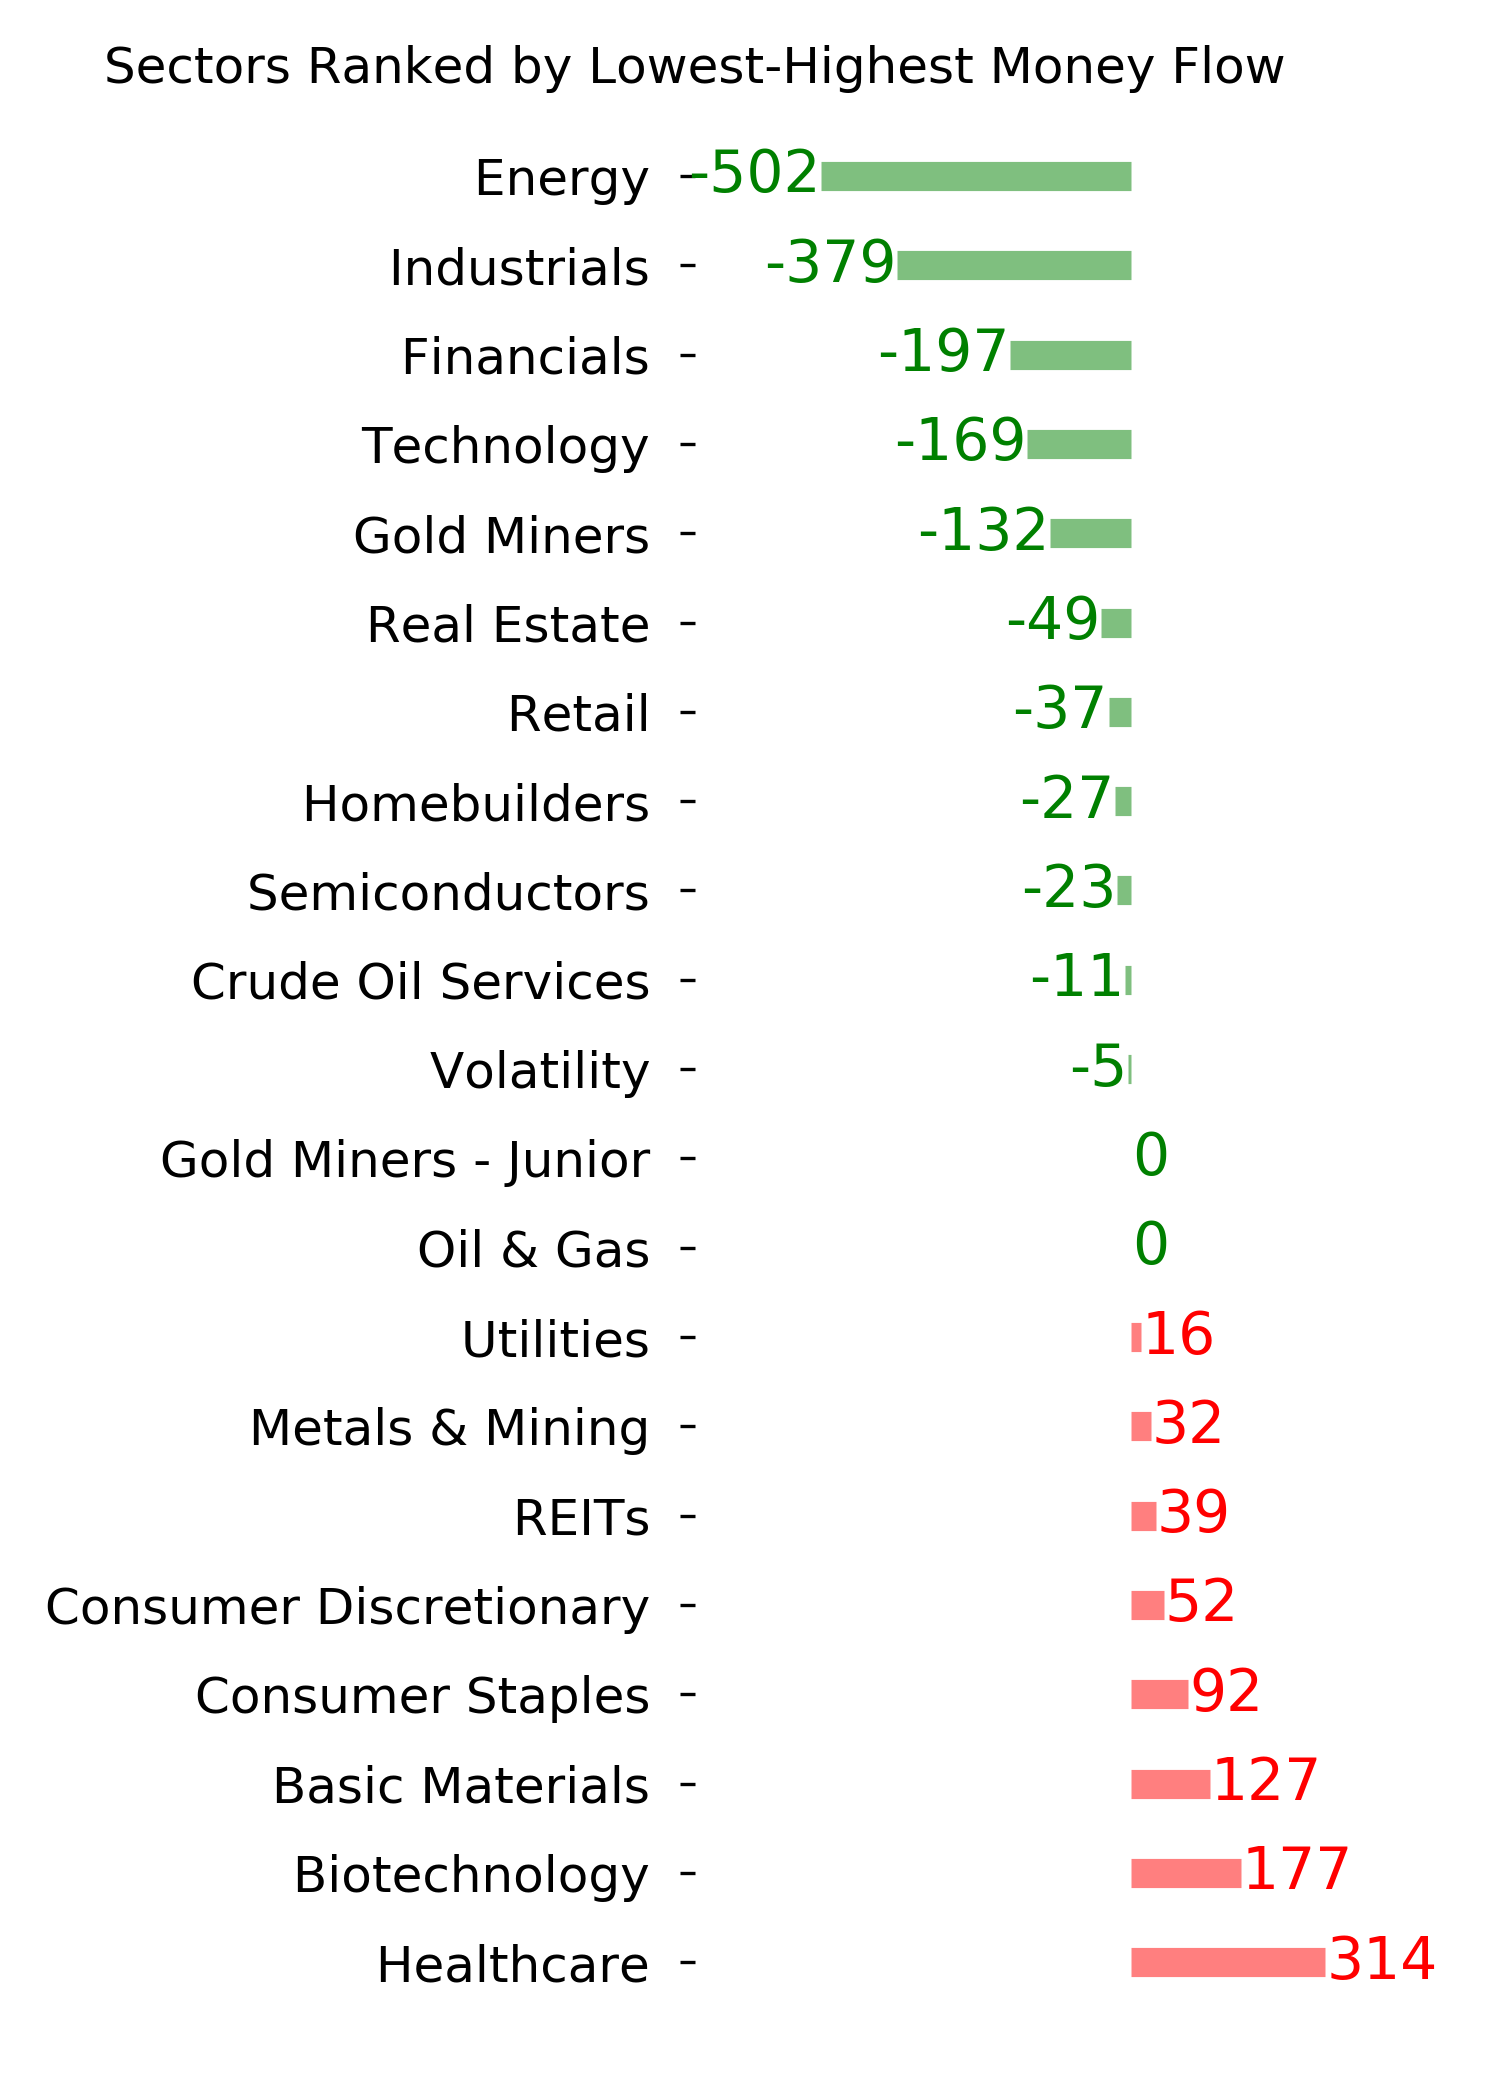
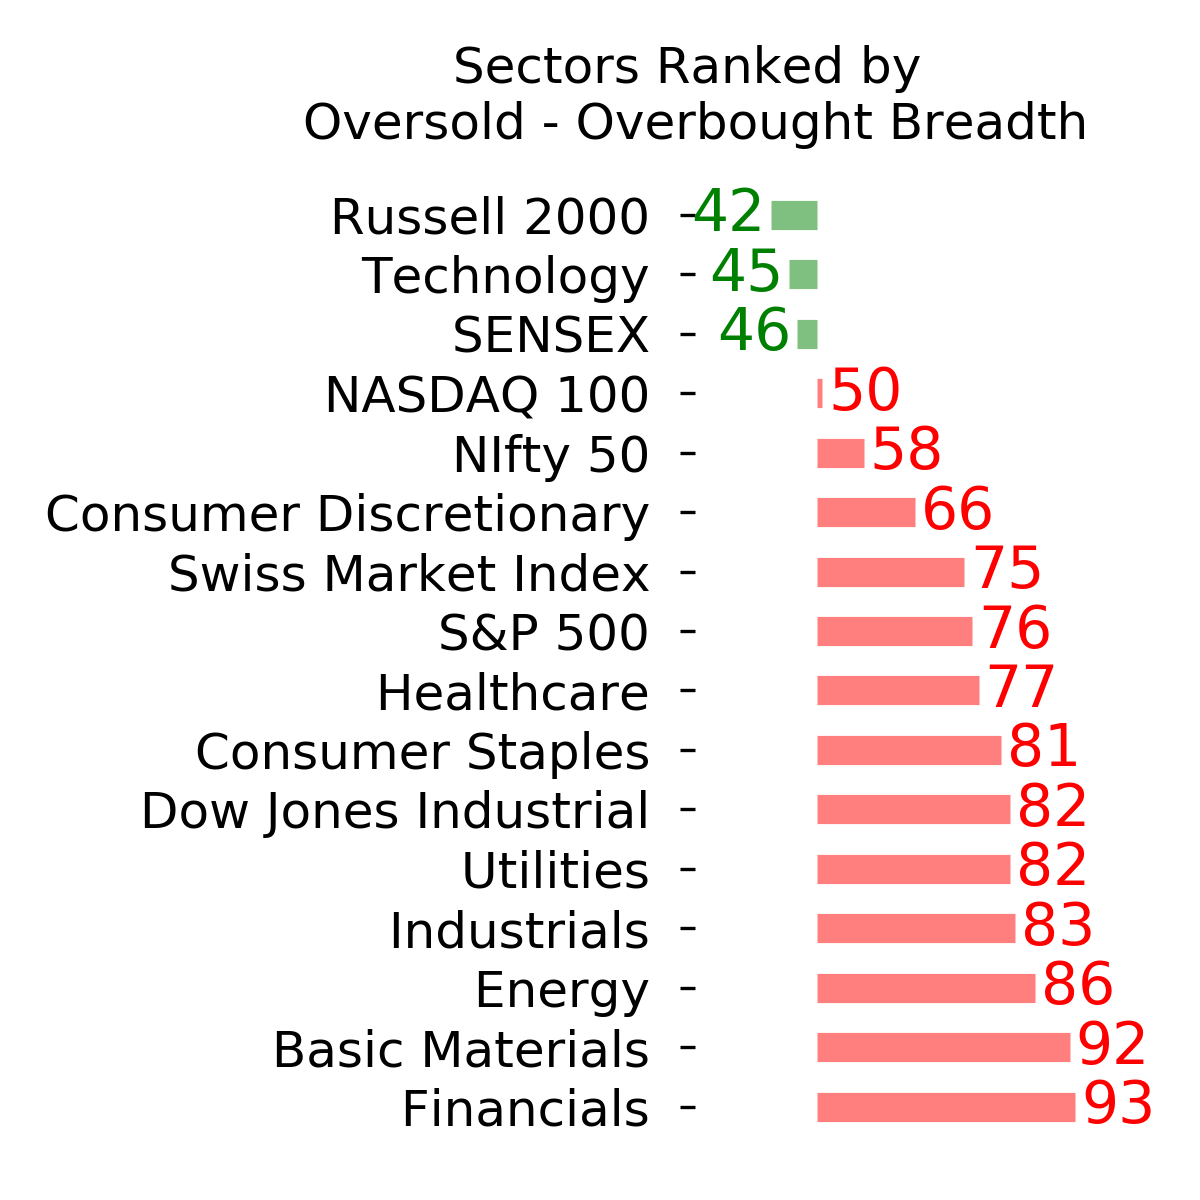
Ranks
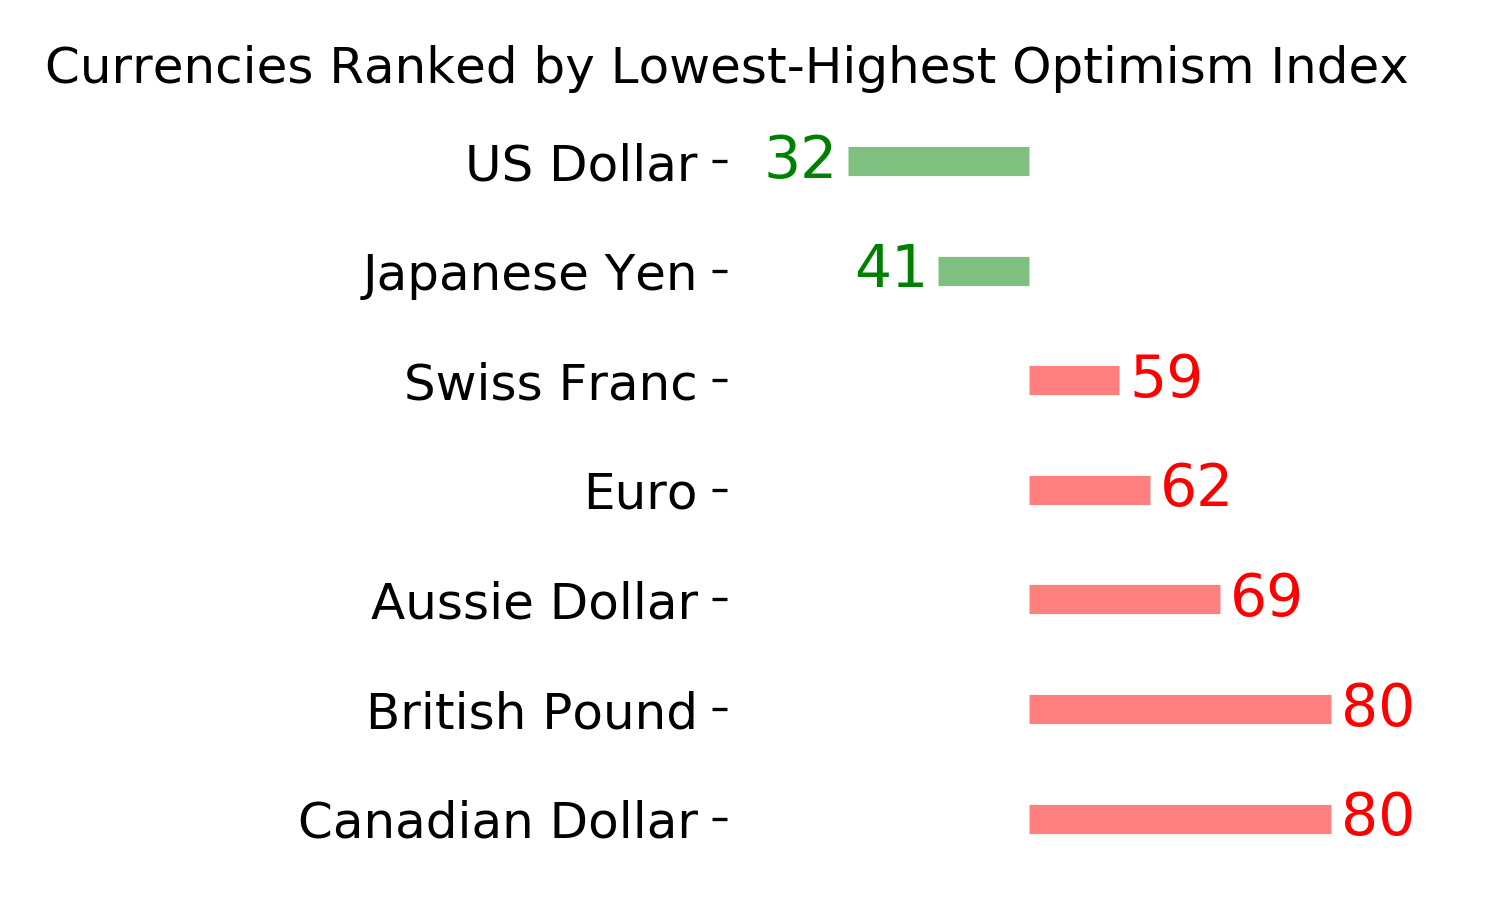
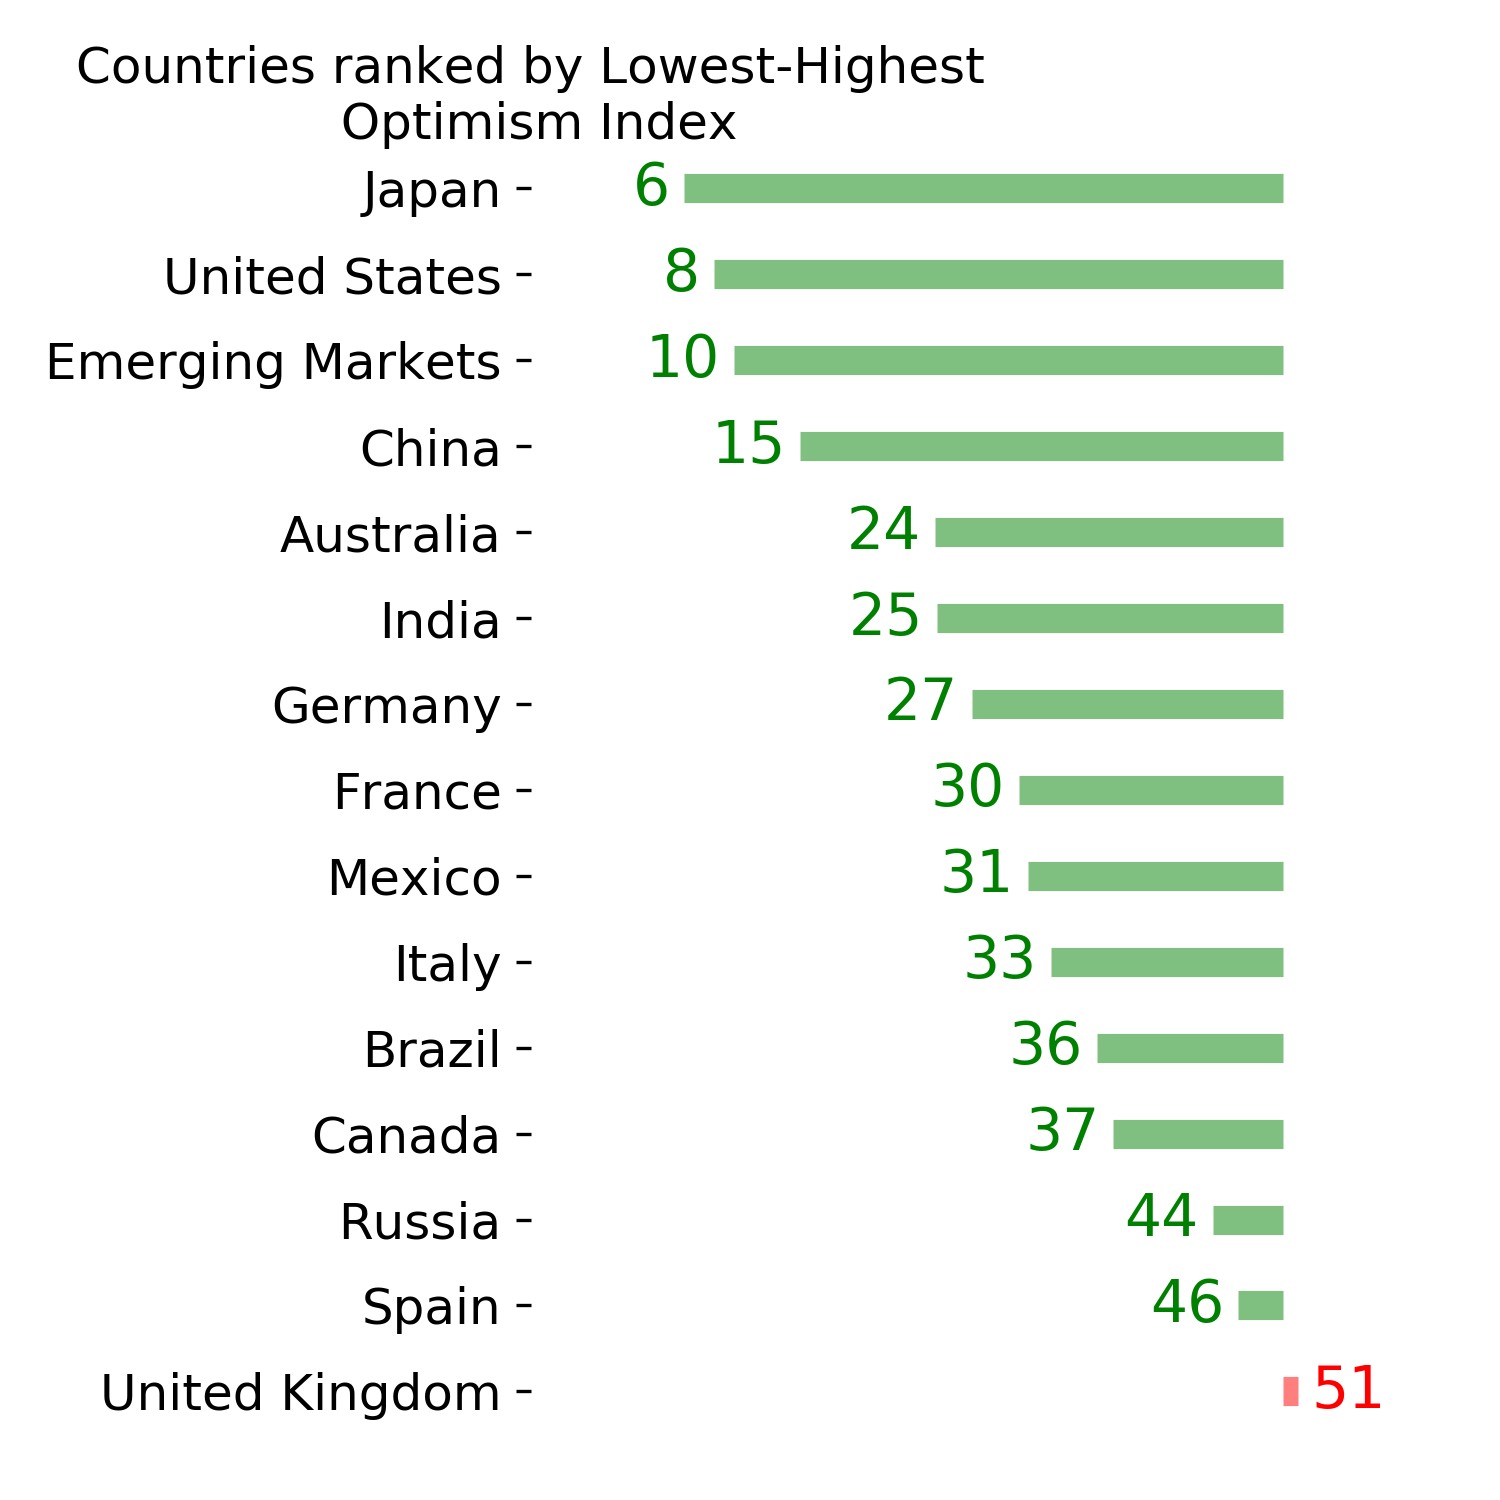
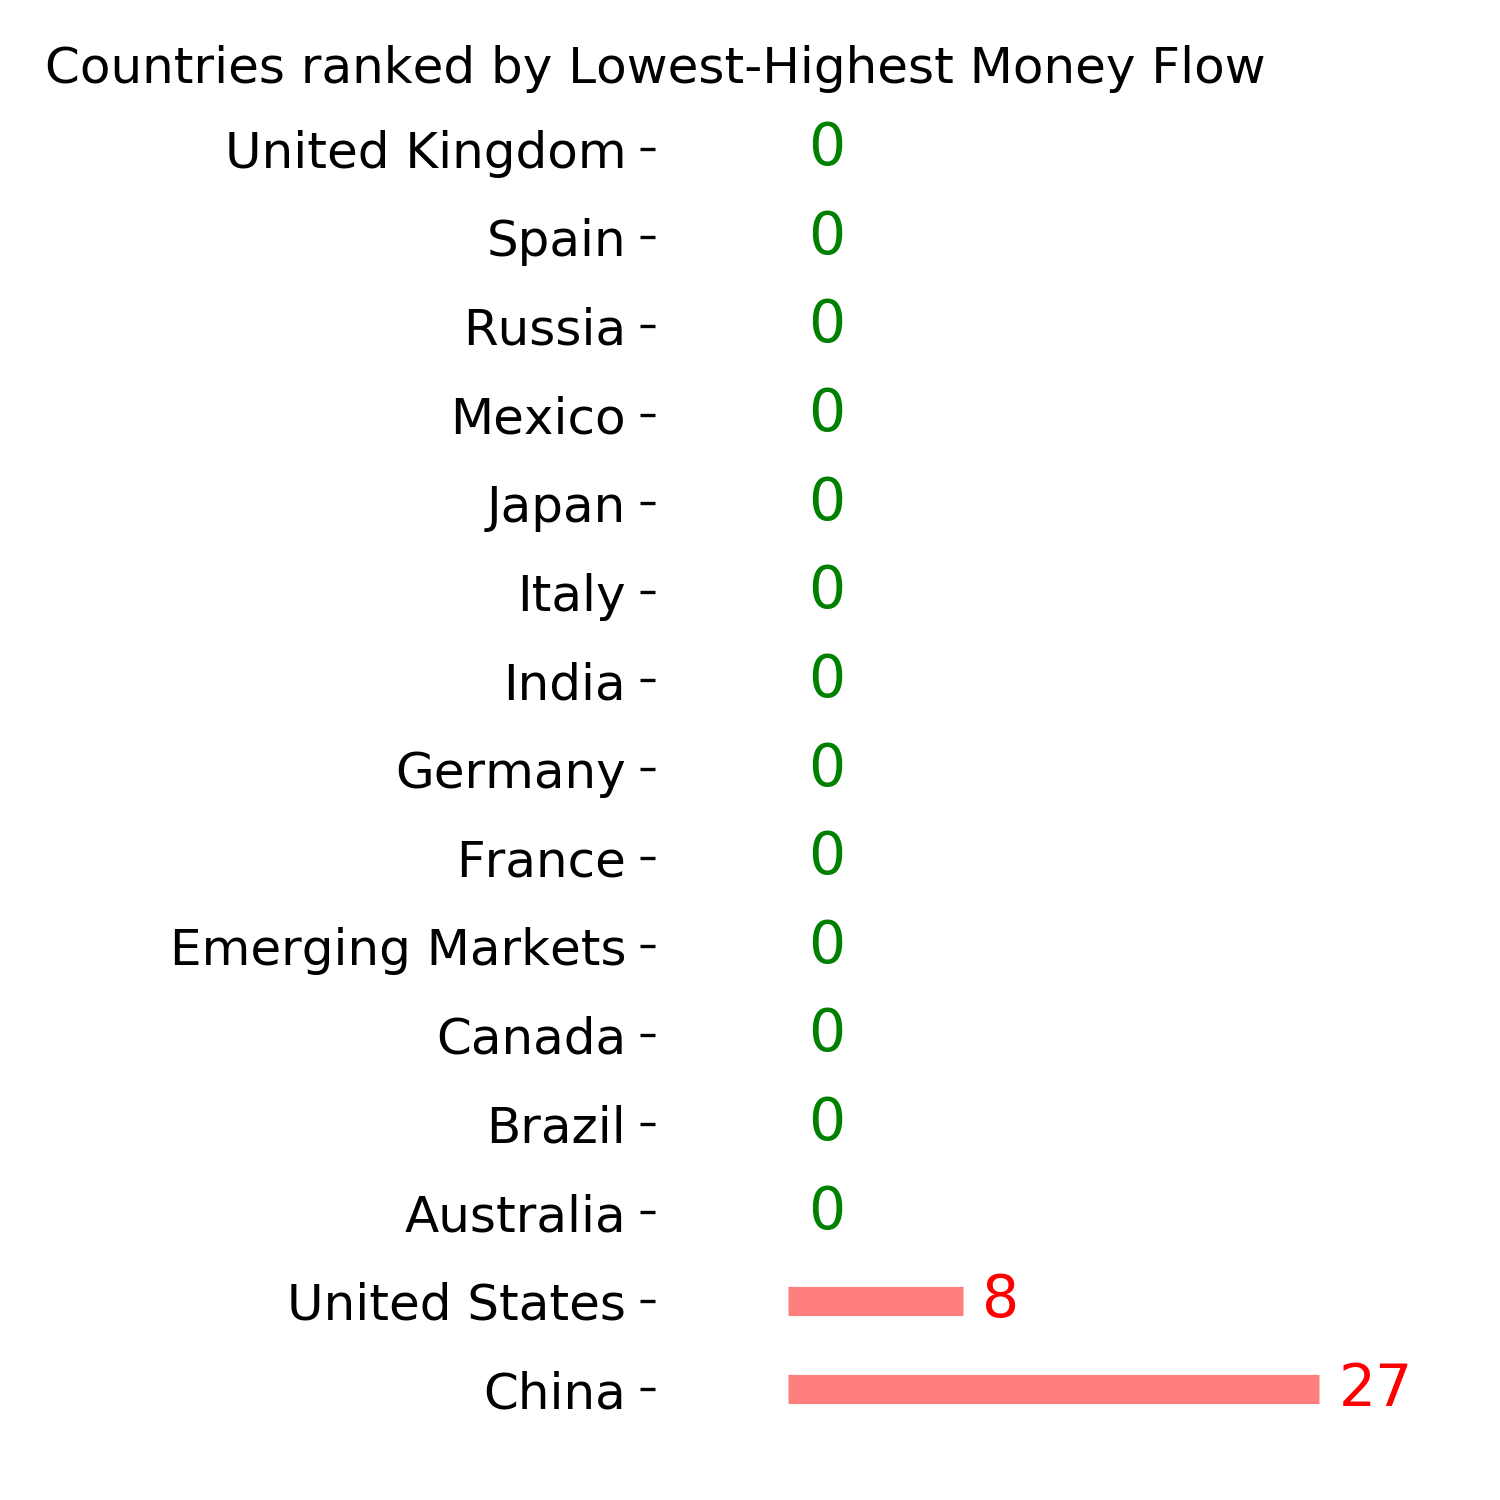
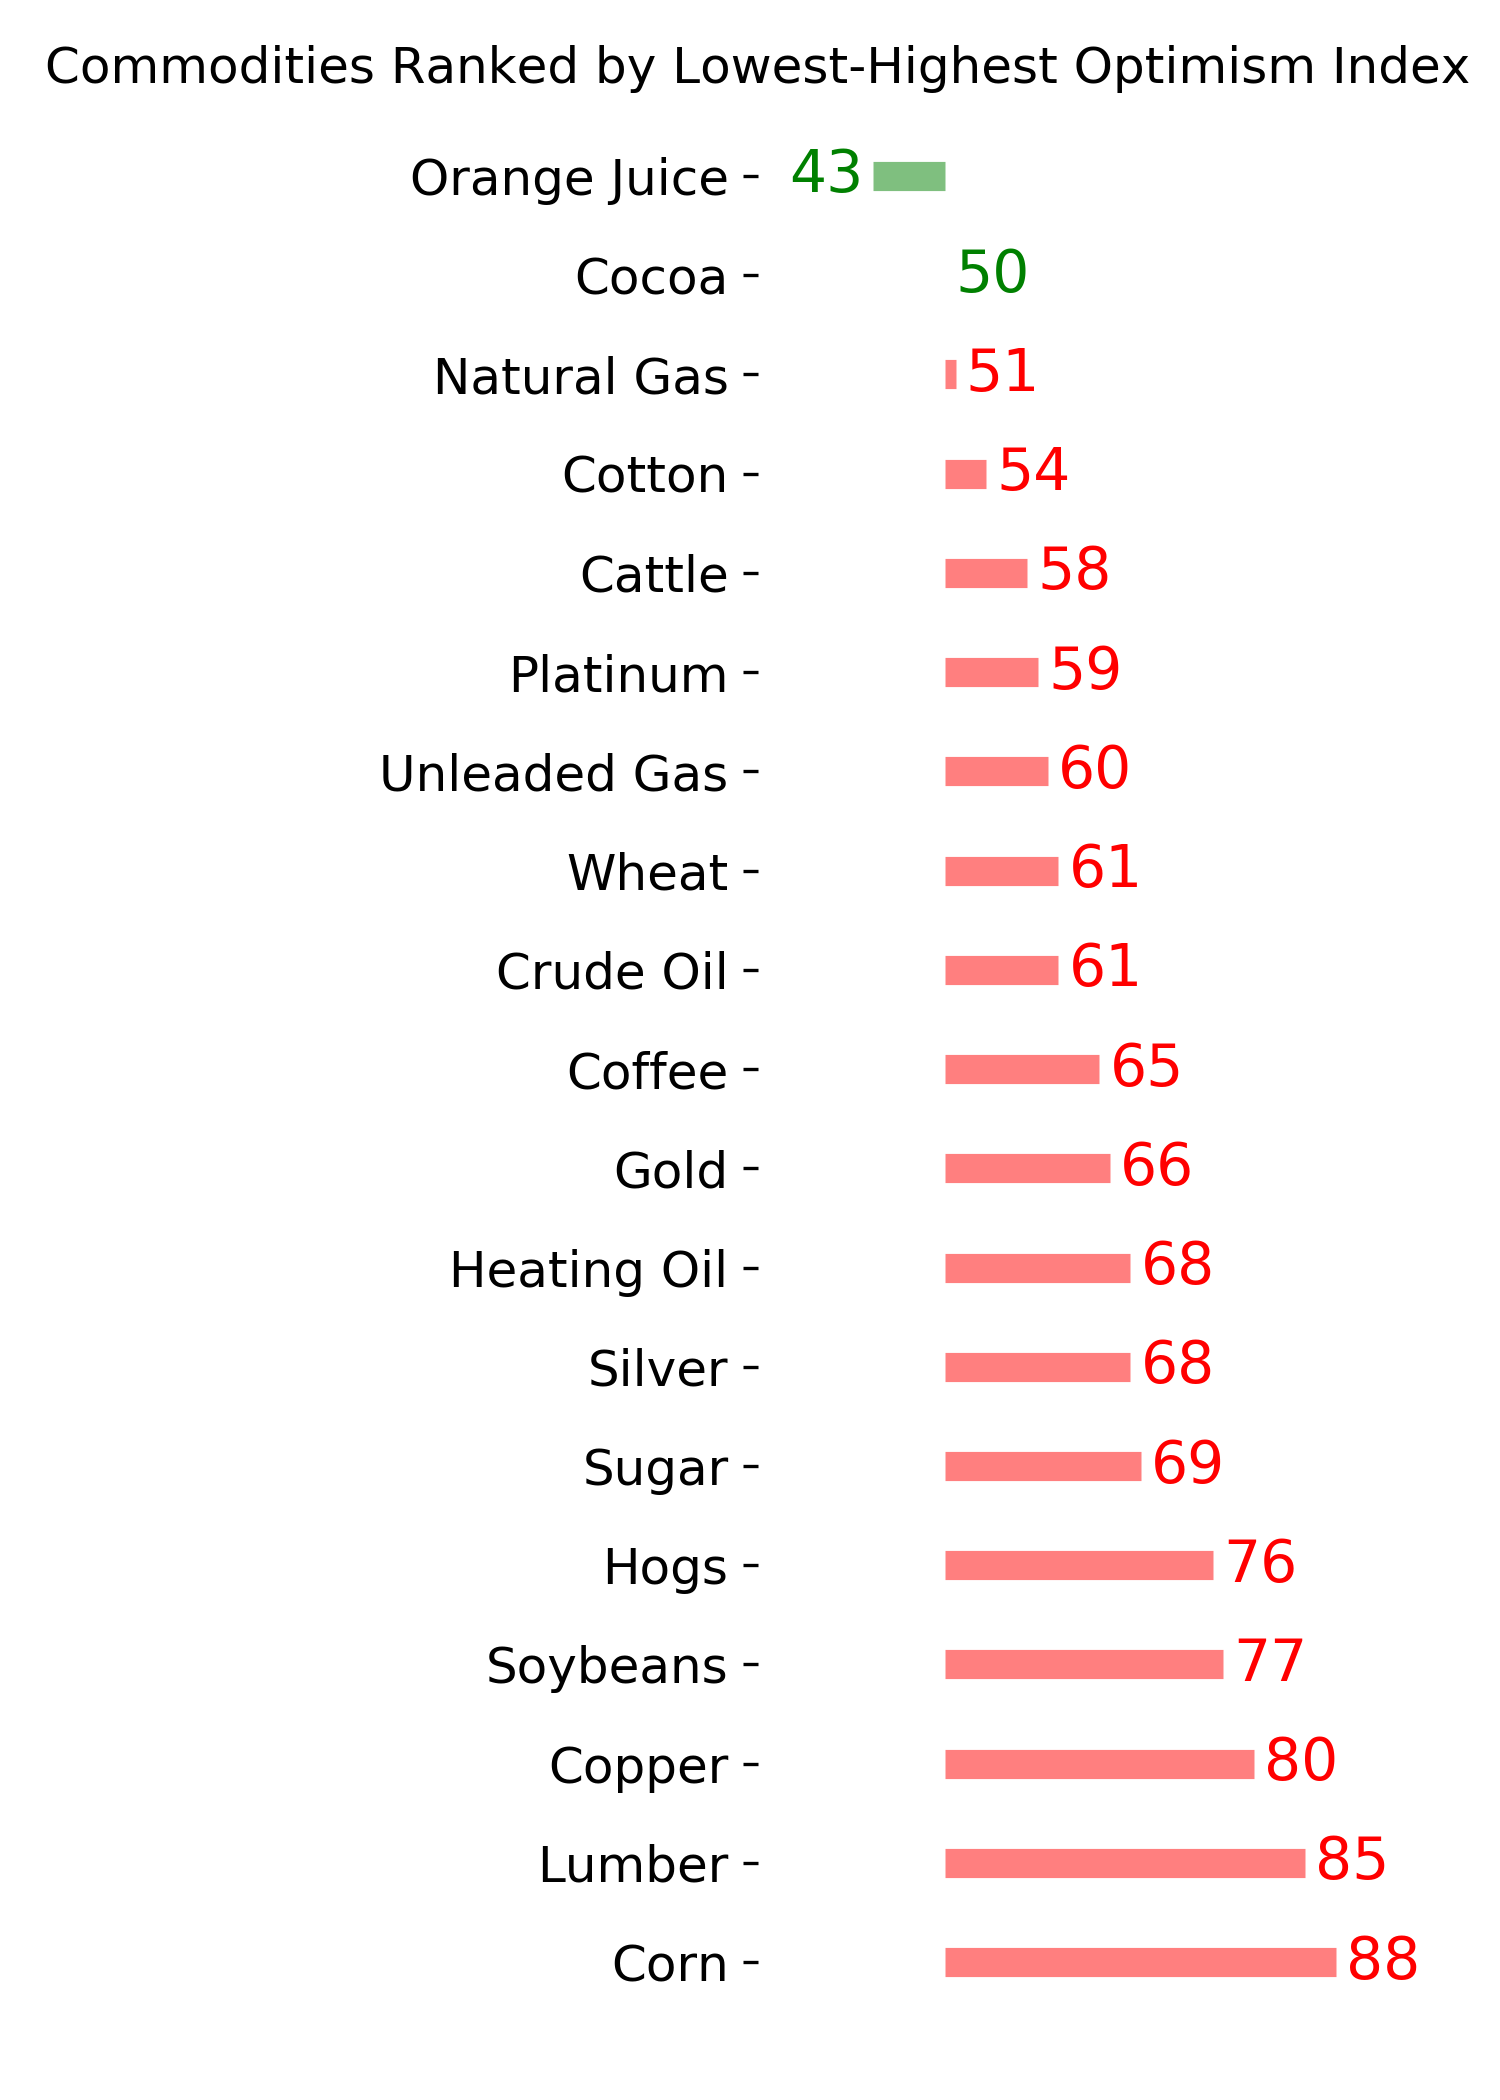
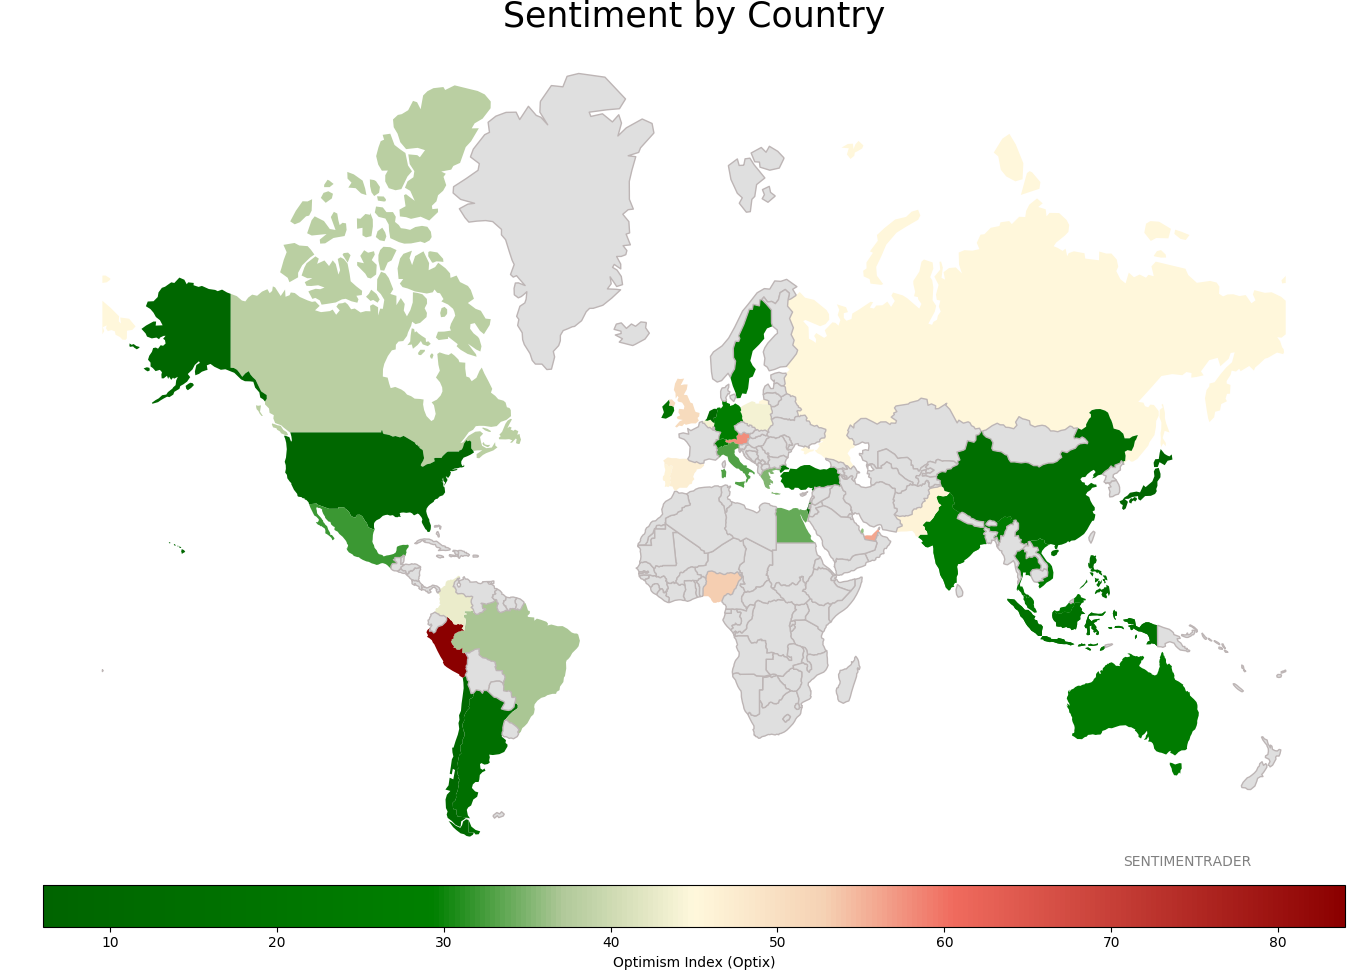
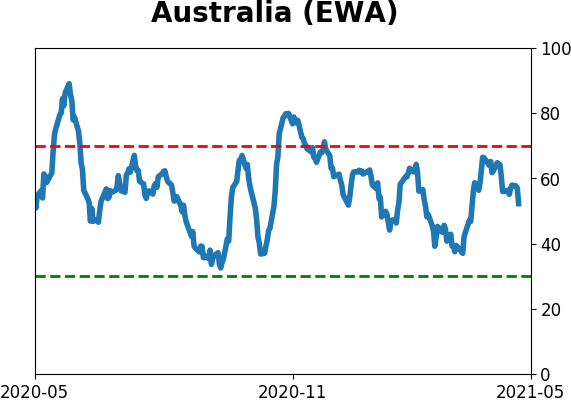
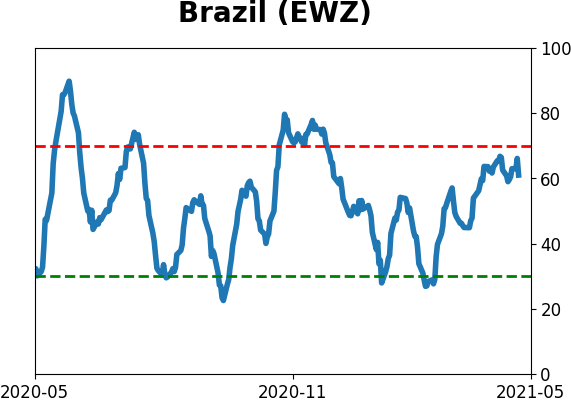
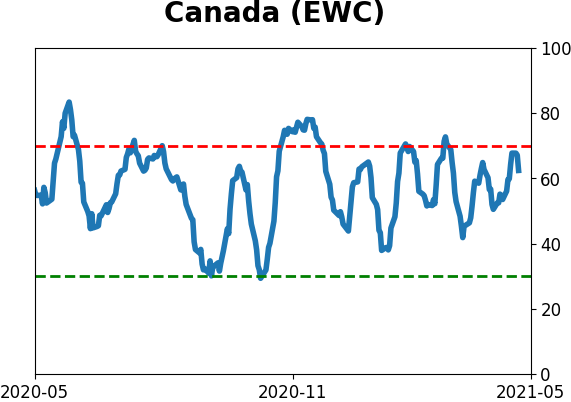
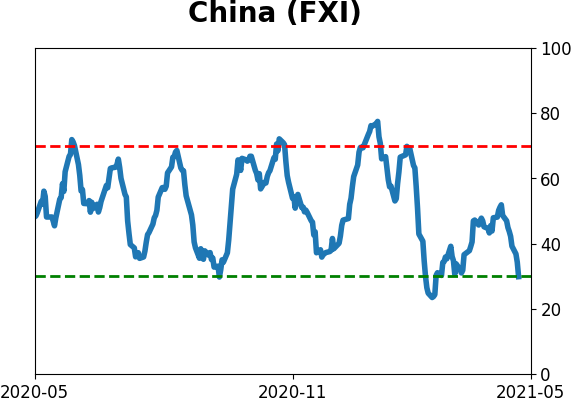
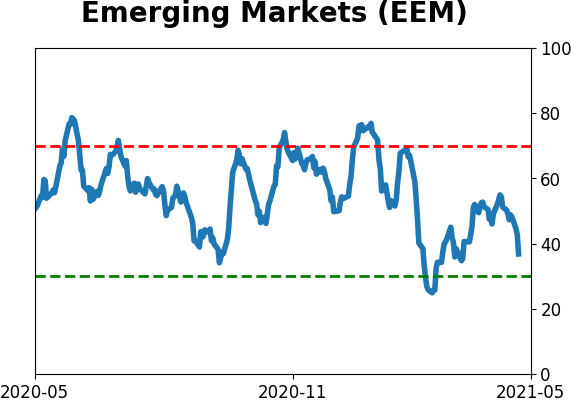
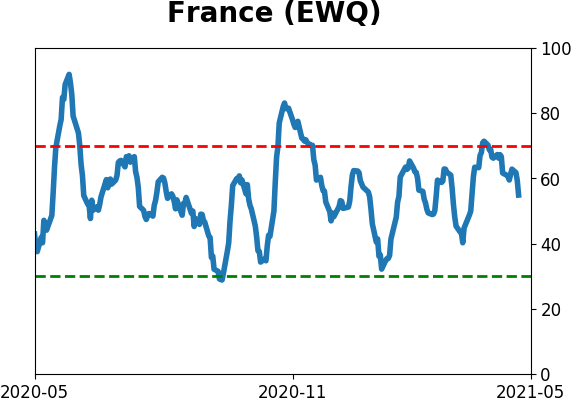
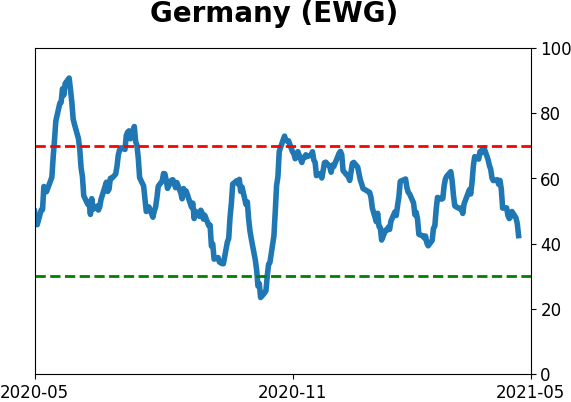
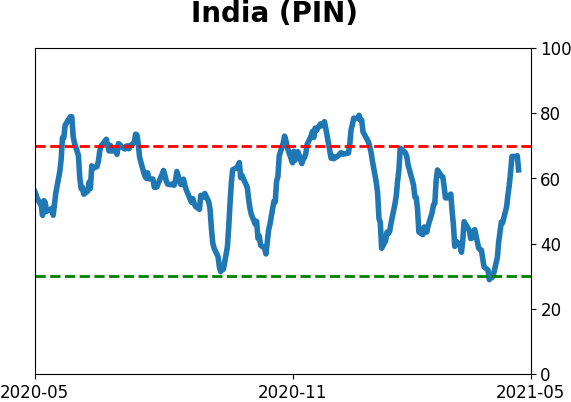
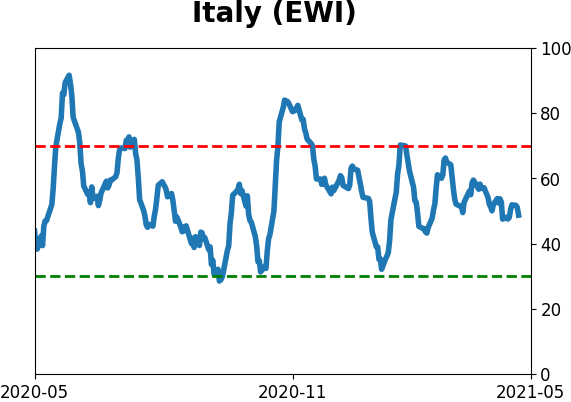
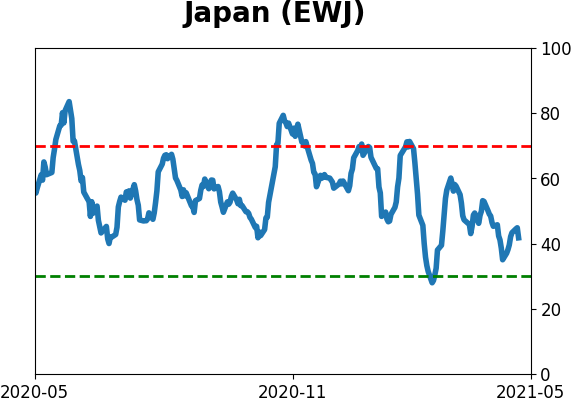
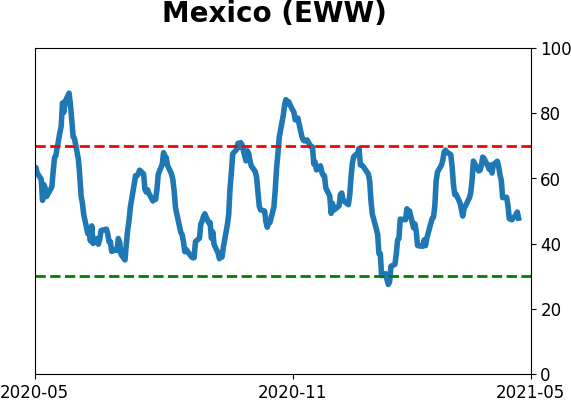
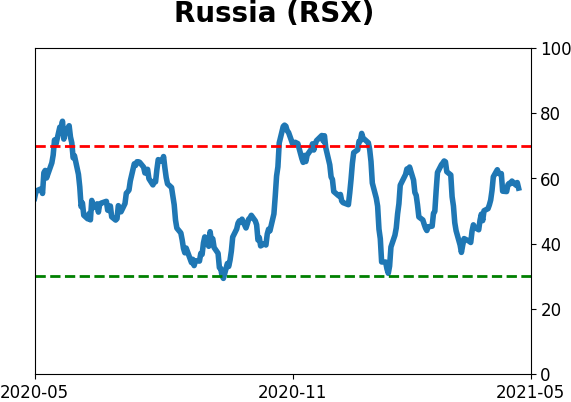
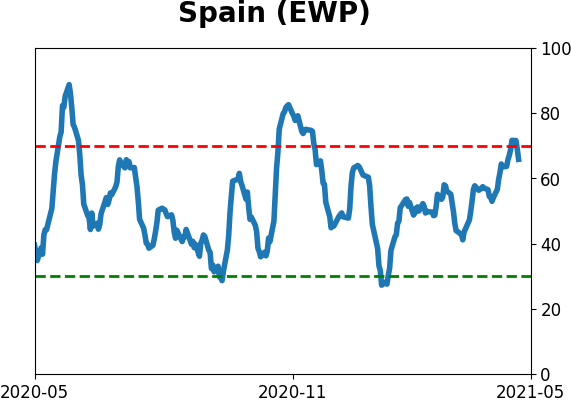
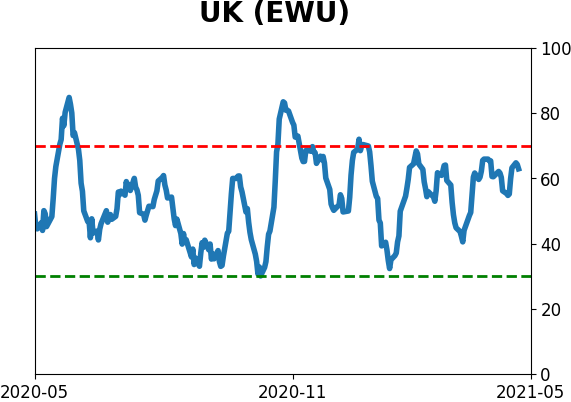
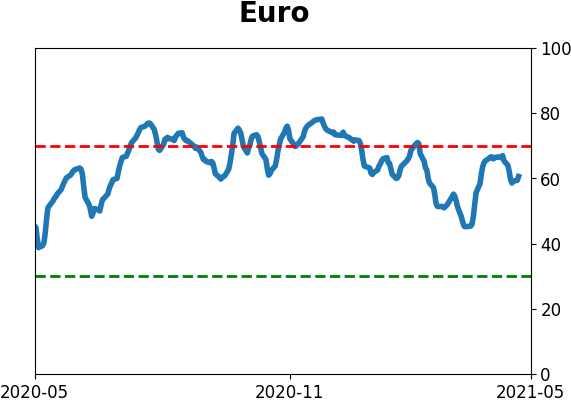
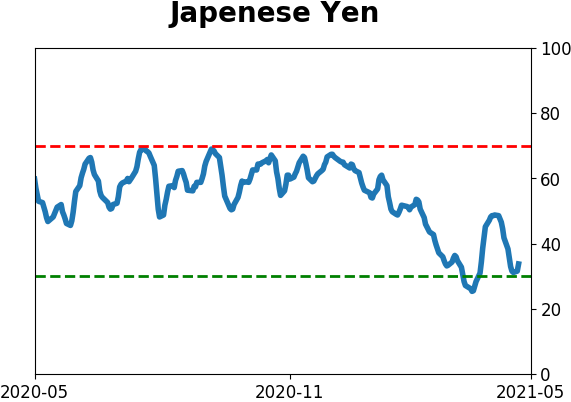
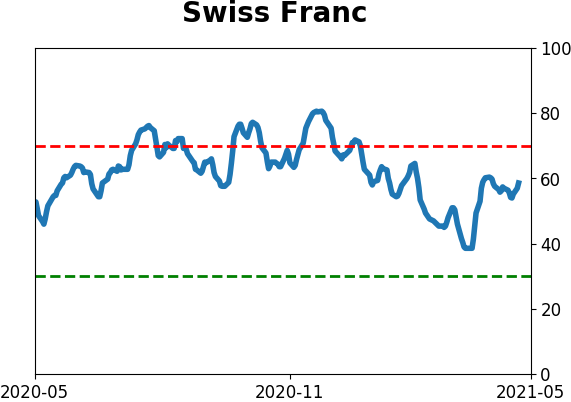
Sentiment Around The World
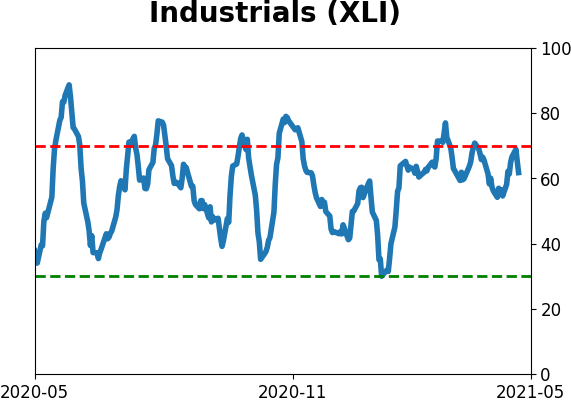
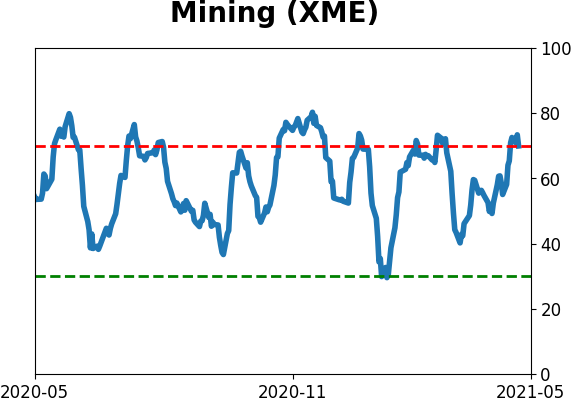
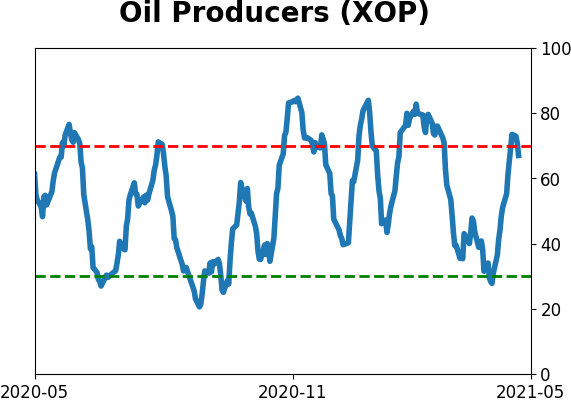
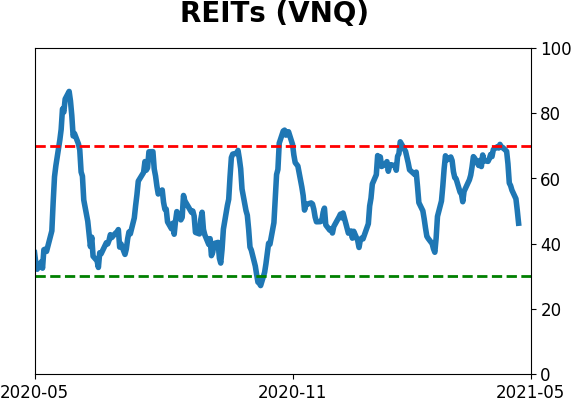
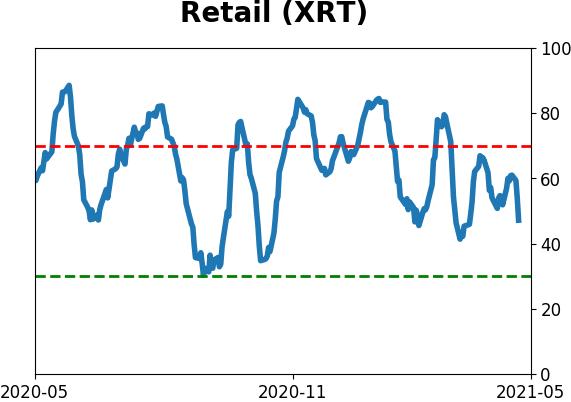
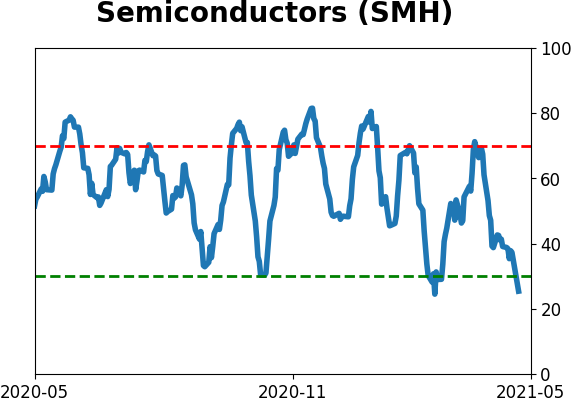
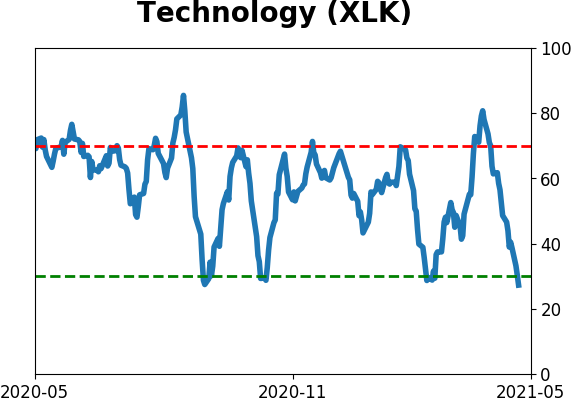
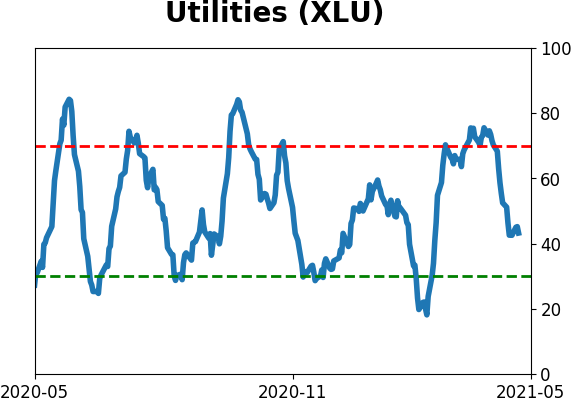
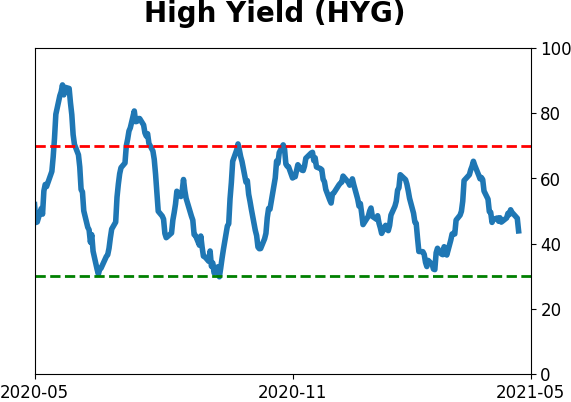
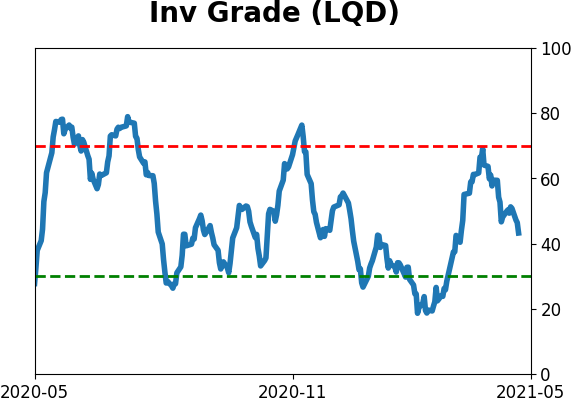
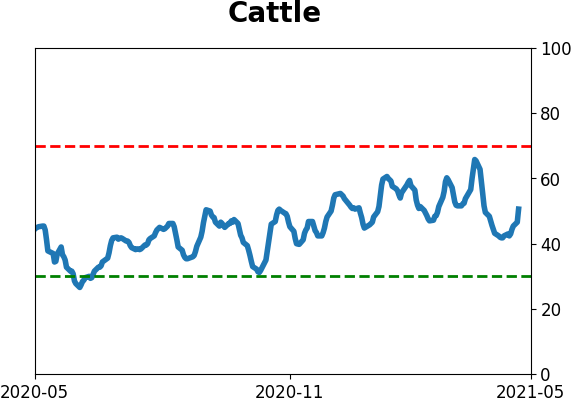
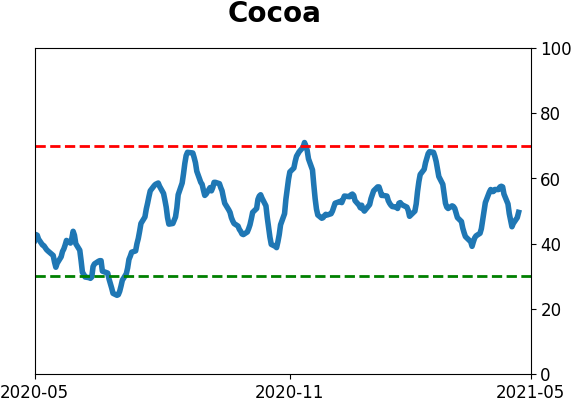
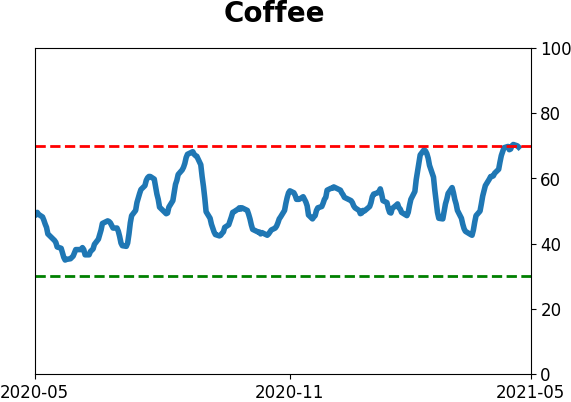
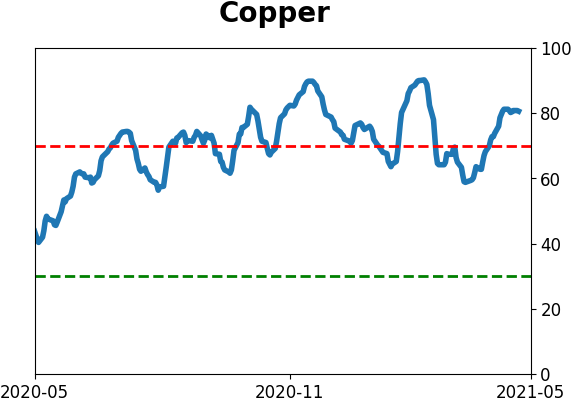
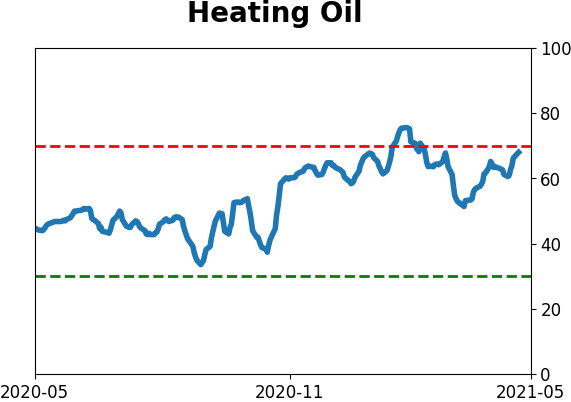
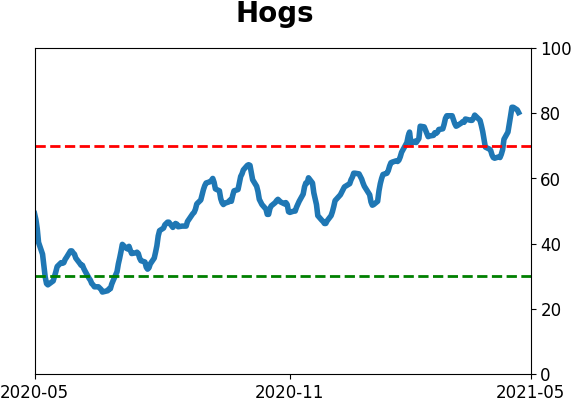
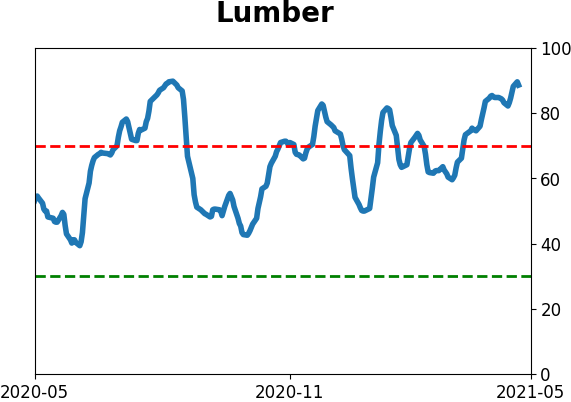
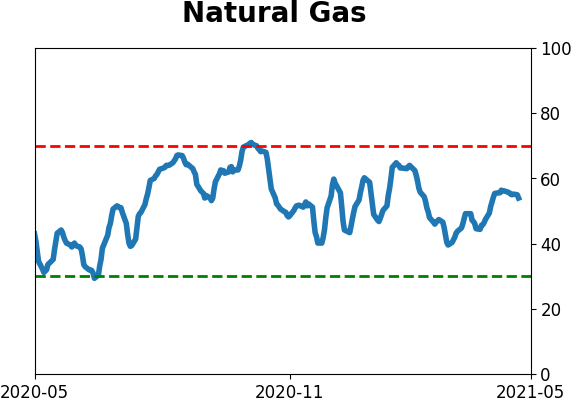
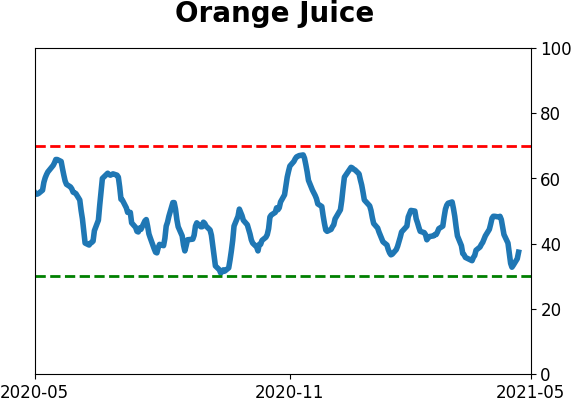
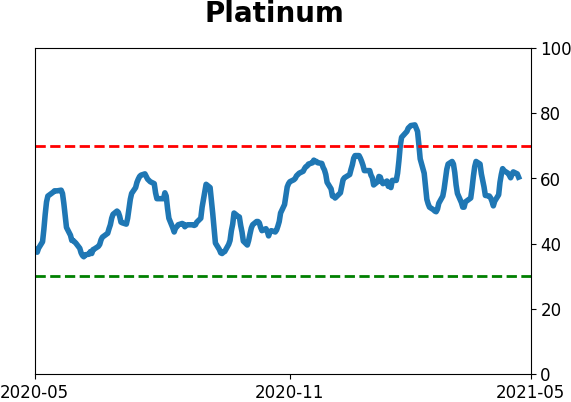
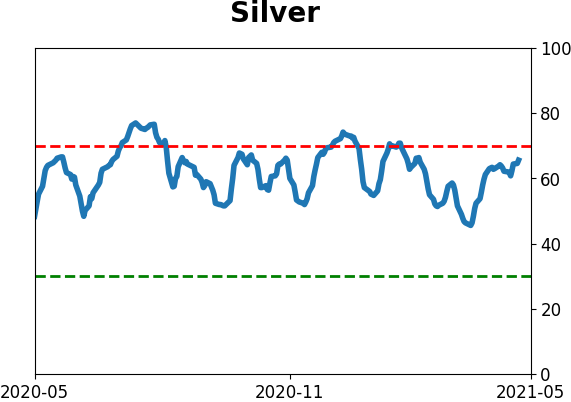
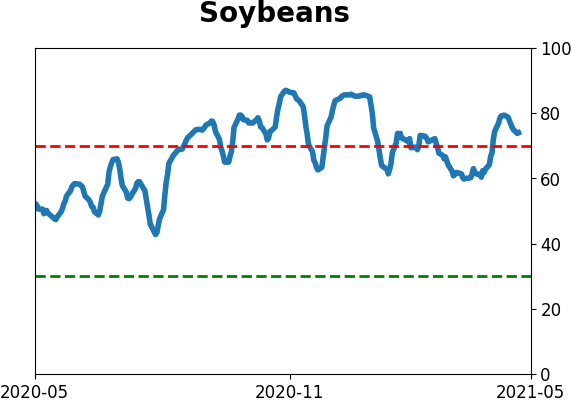
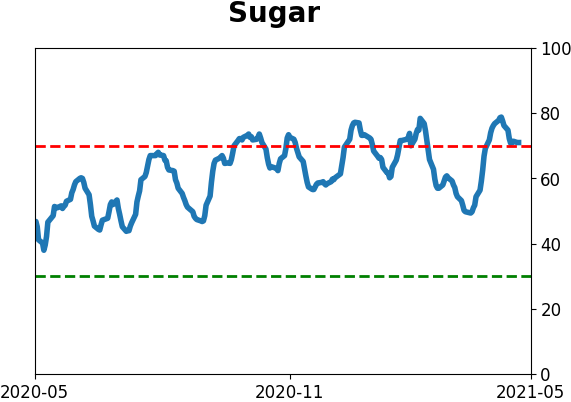
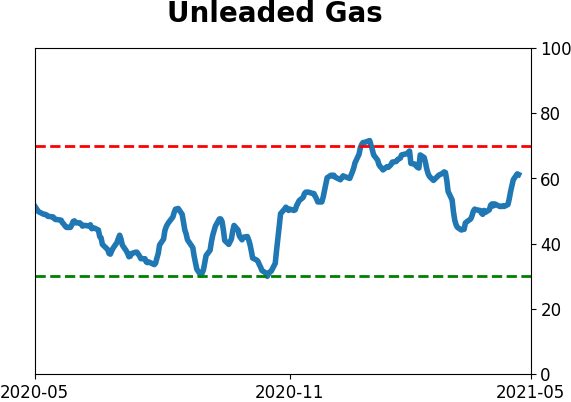
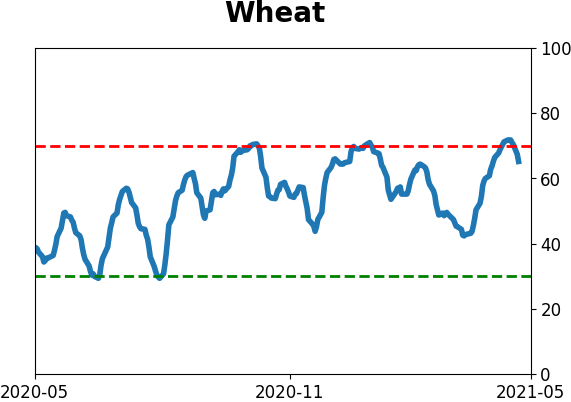
Optimism Index Thumbnails
|
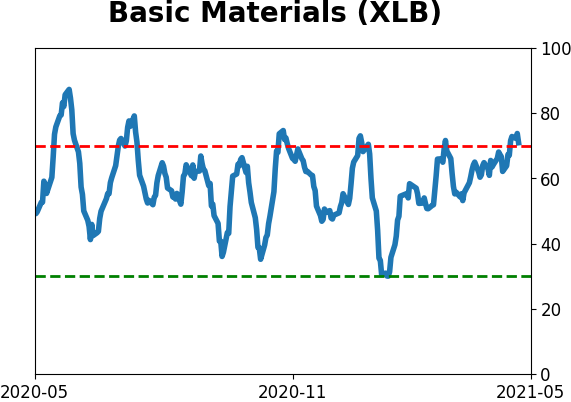
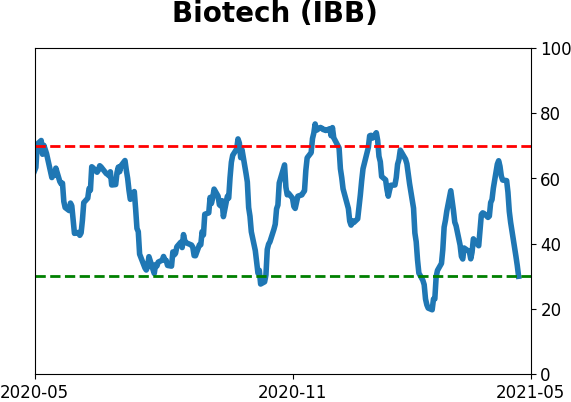
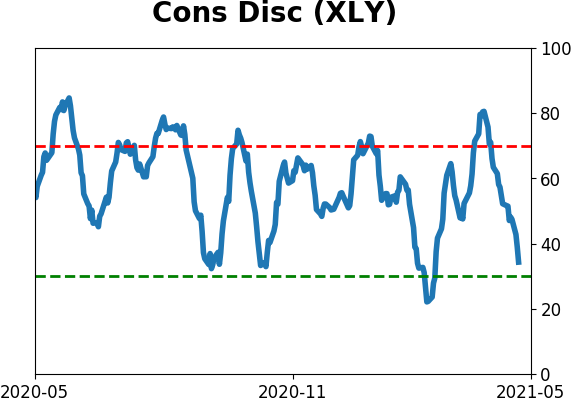
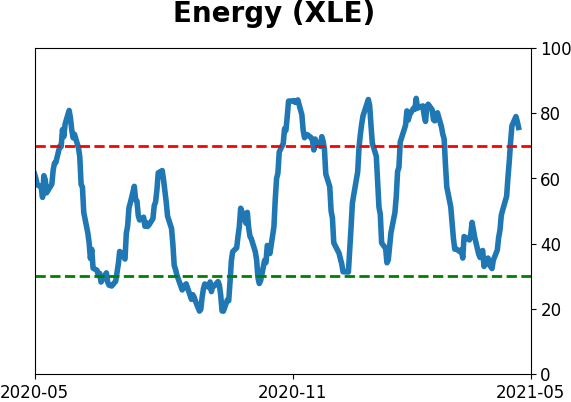
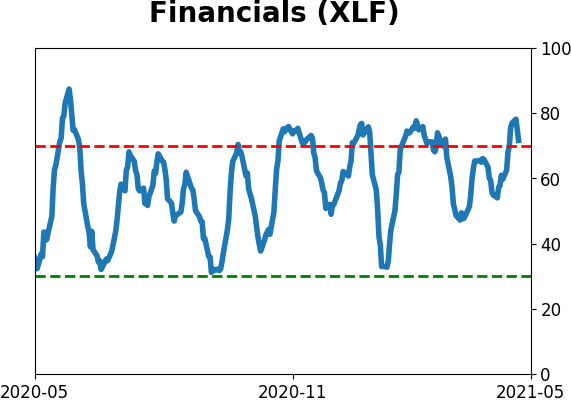
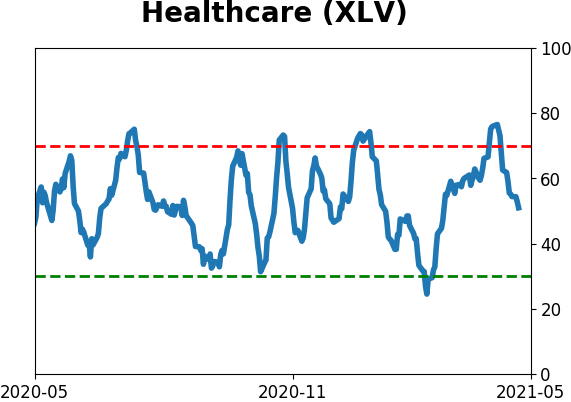
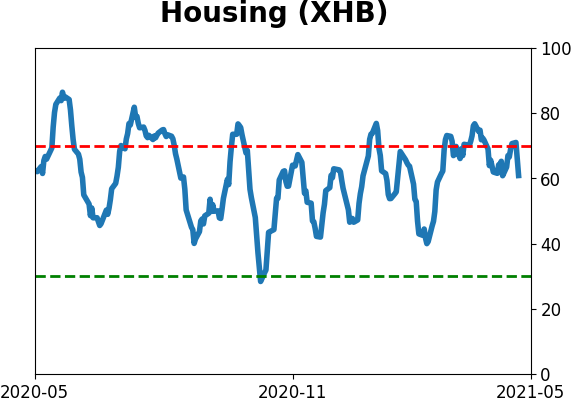
Sector ETF's - 10-Day Moving Average
|
|
|
Country ETF's - 10-Day Moving Average
|
|
|
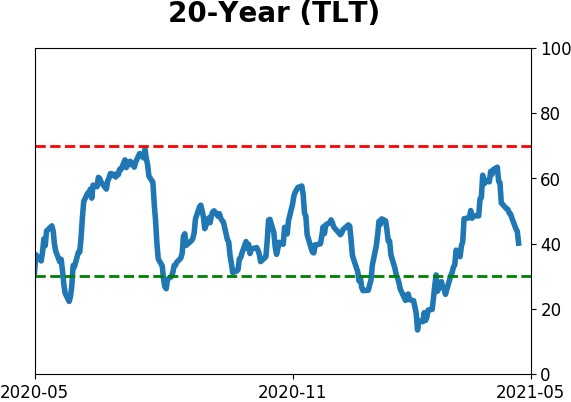
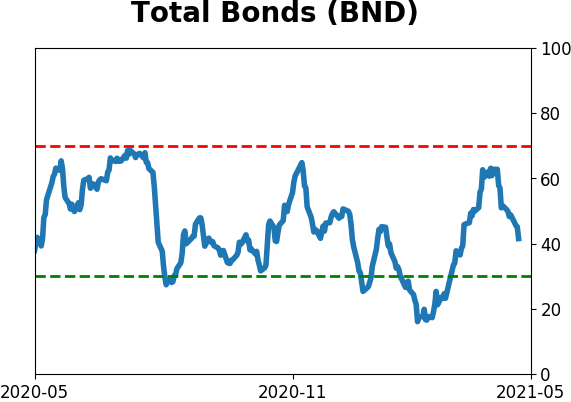
Bond ETF's - 10-Day Moving Average
|
|
|
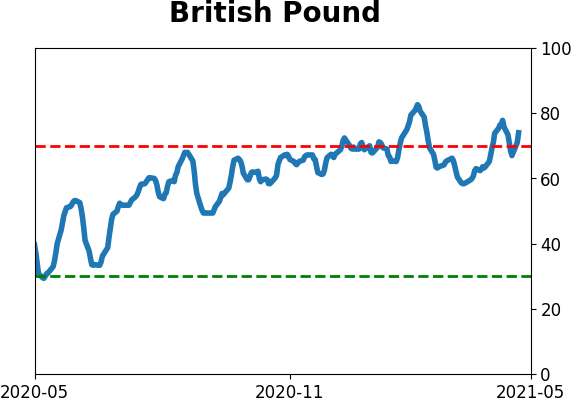
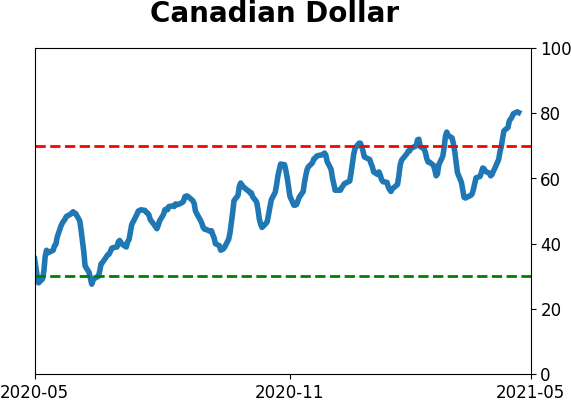
Currency ETF's - 5-Day Moving Average
|
|
|
Commodity ETF's - 5-Day Moving Average
|
|