Headlines
|
|
Overseas fund exodus nears 2008 crisis low:
Every week for the past 12 weeks, investors have pulled money from overseas equity mutual funds and ETFs. It's on a scale now that rivals the worst of the 2008 financial crisis. Domestic funds have seen less outflow on a relative basis.
Stocks have been trapped between time frames:
The S&P 500 has been stuck in a range for a month, above its medium-term 50-day moving average but below its long-term 200-day average. Based on other long streaks of being stuck between time frames, there has been a higher likelihood it will break the streak by falling below its 50-day average. But future returns were weak, no matter which way it broke.
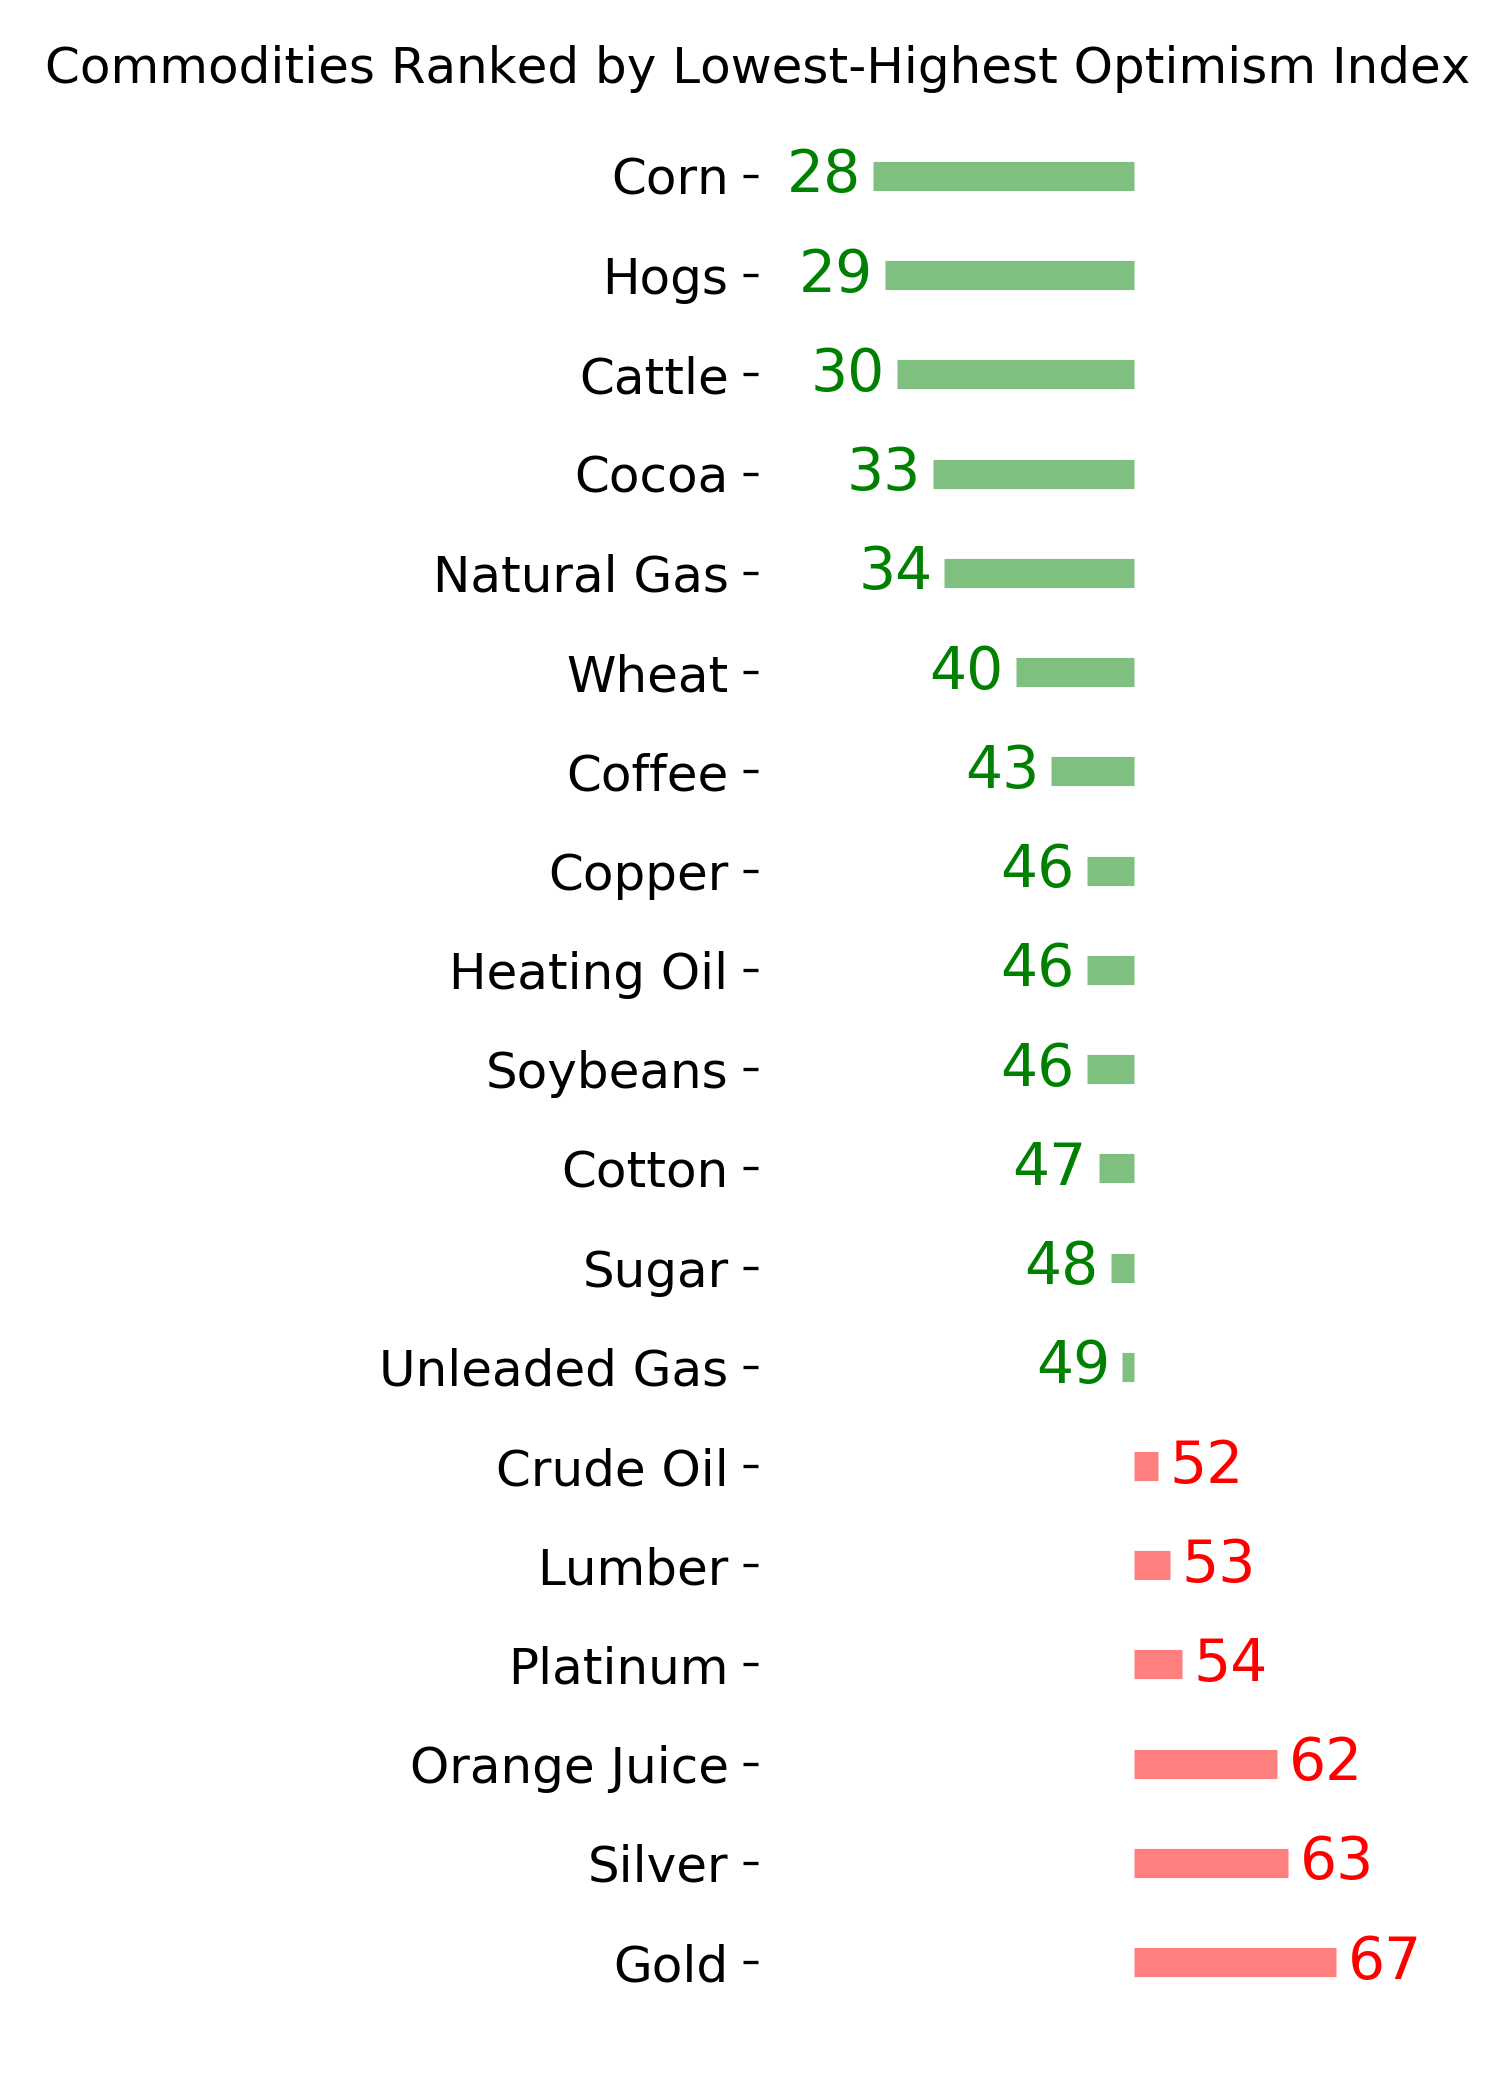
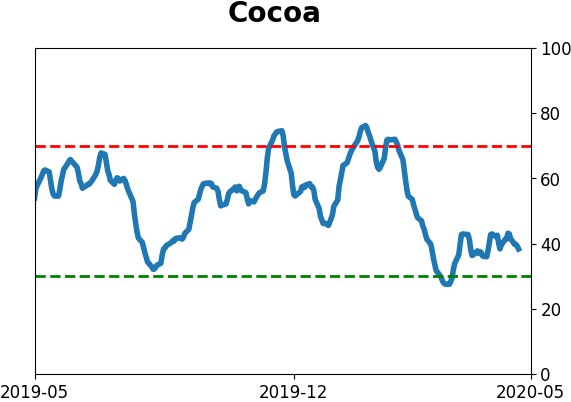
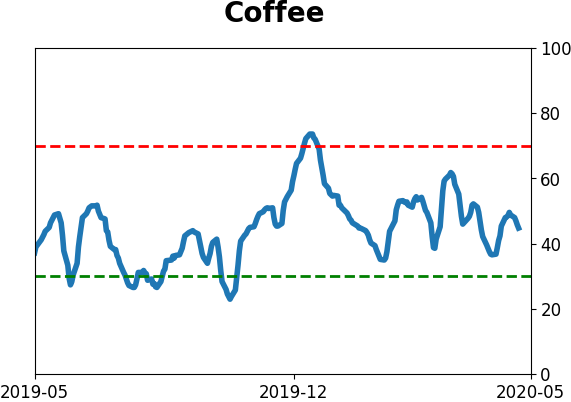
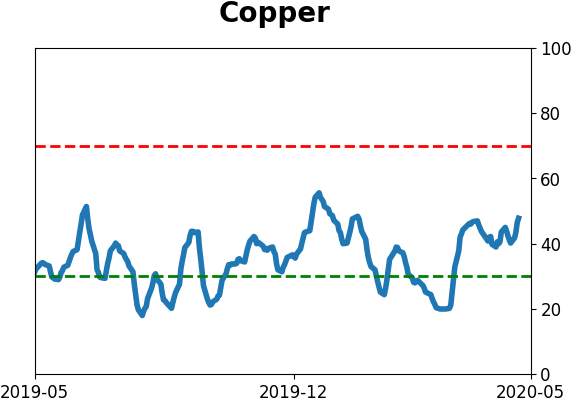
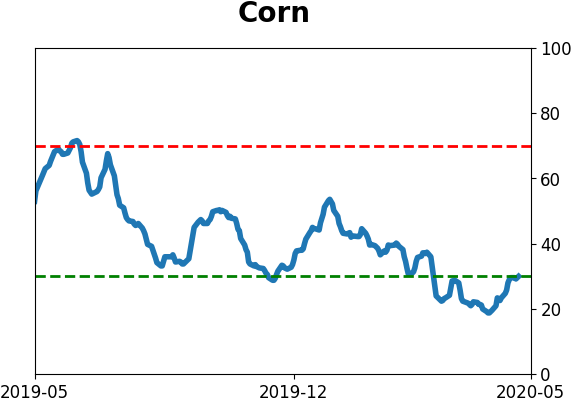
The latest Commitments of Traders data was released, covering positions through Tuesday: The odd behavior of "smart money" hedgers in equities continues. Yet again this week, they increased their record net long exposure to the major equity index futures, now holding more than $47 billion worth of contracts. Over the past 10 years, this has been phenomenally bullish for stocks. The biggest caveats are that it didn't work prior to 2010, and it's odd that they keep buying, hinting that something is different. The other times they did this over the past decade, they were selling as stocks rose, which is normal. They weren't in a hurry during the initial rally in 2019, so that's a kinda-sorta precedent, but it's getting to the point where it's so odd it's a little unnerving. The only other extreme of note is in corn, where they're holding the most net long contracts since 2014. They still haven't established a compelling extreme in the broader agriculture complex though.
|
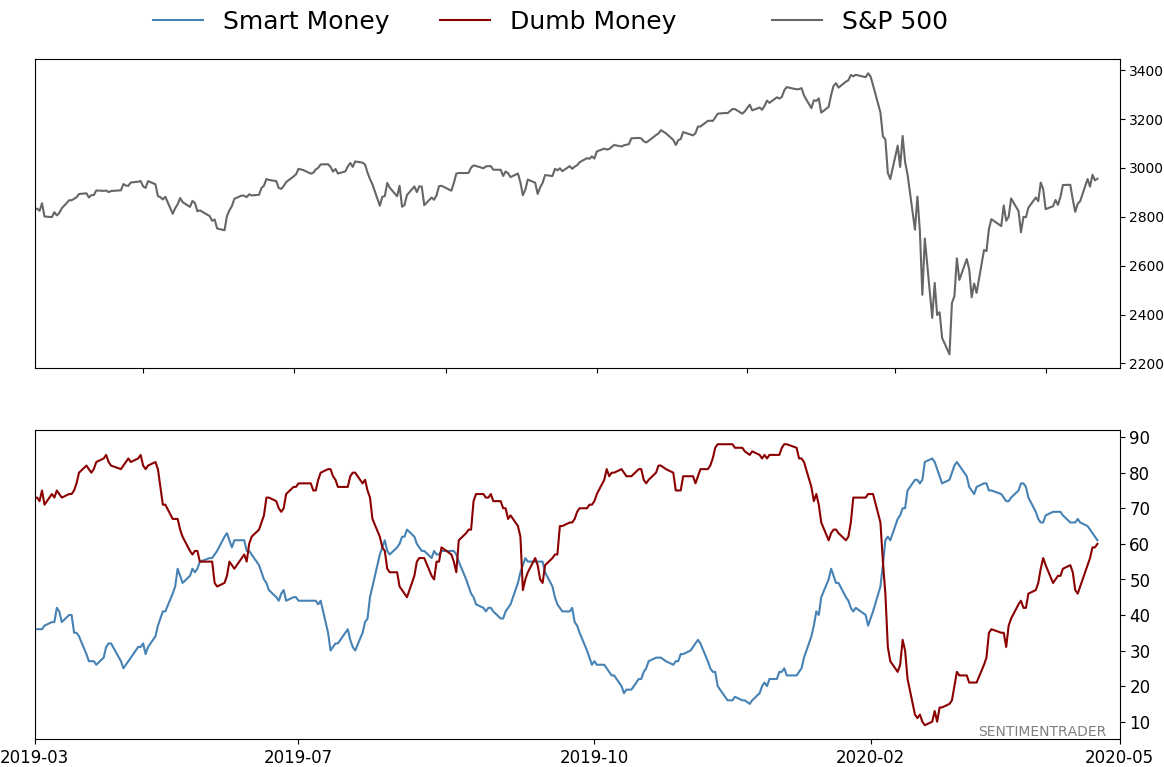
Smart / Dumb Money Confidence
|
Smart Money Confidence: 61%
Dumb Money Confidence: 60%
|
|
Risk Levels
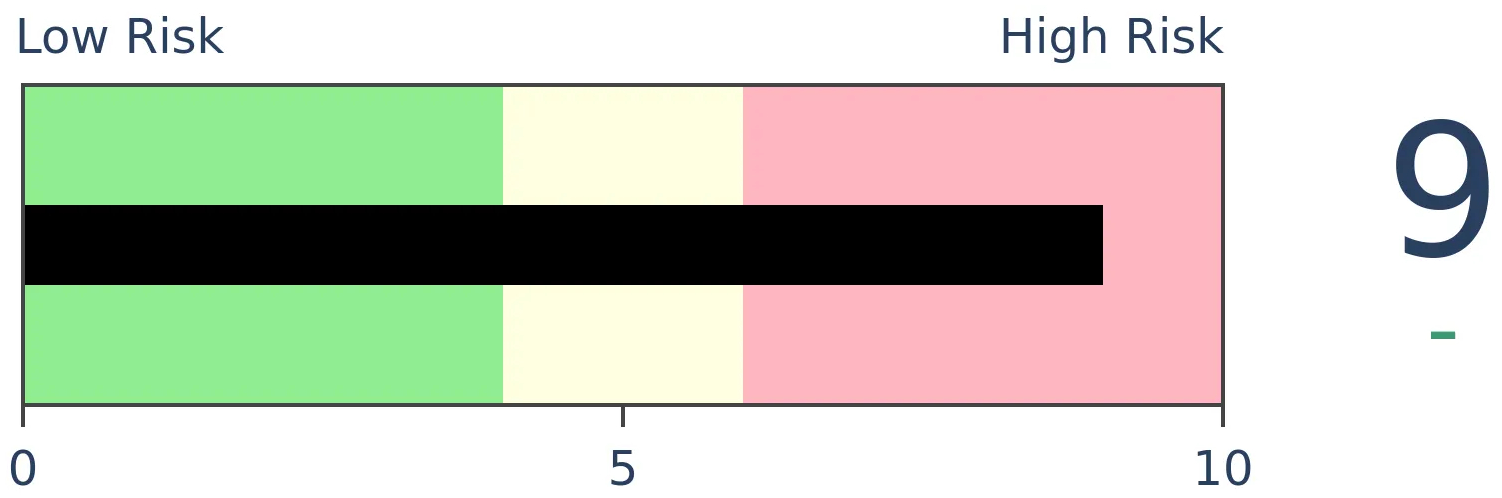
Stocks Short-Term

|
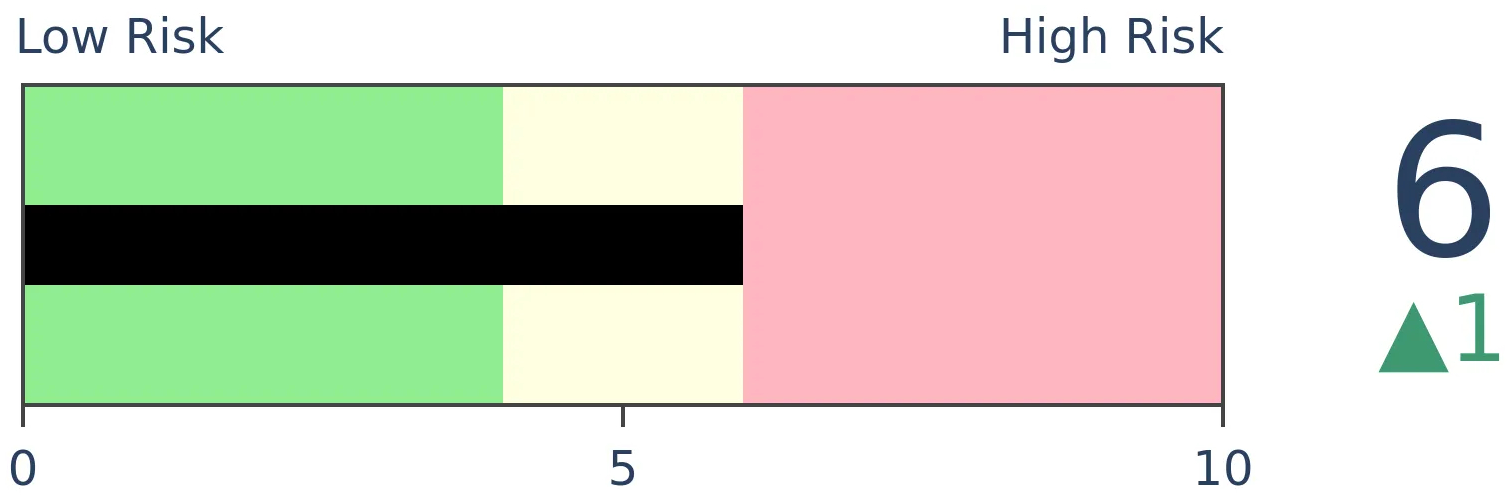
Stocks Medium-Term
|
|
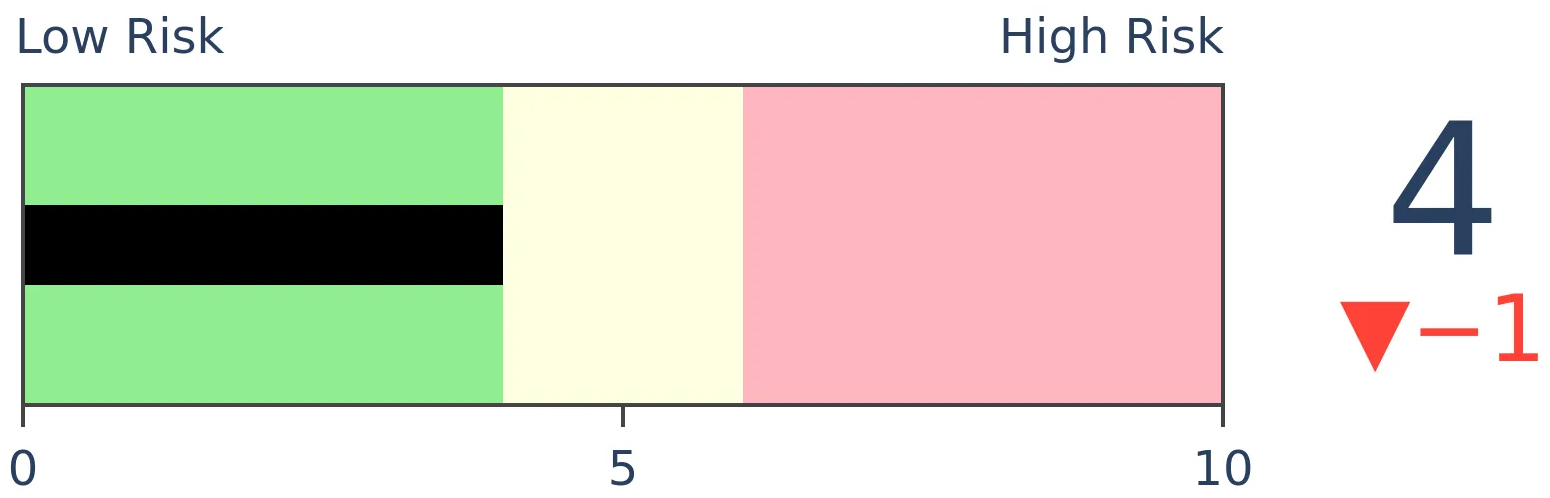
Bonds
|
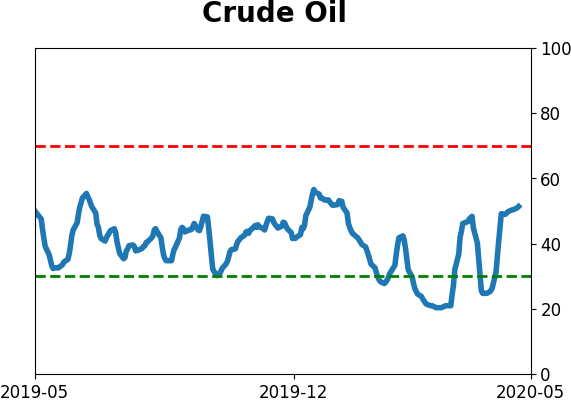
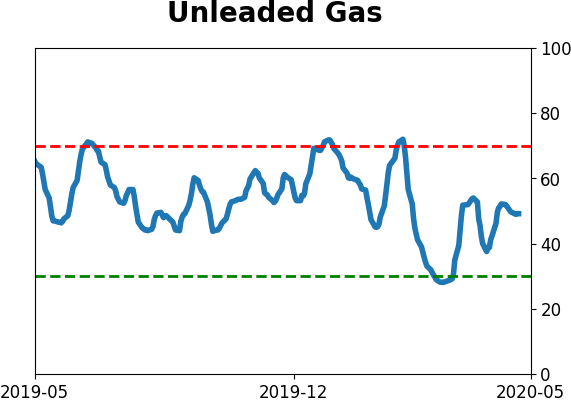
Crude Oil
|
|
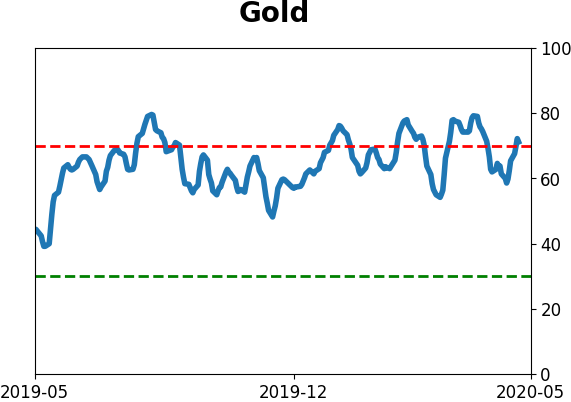
Gold
|
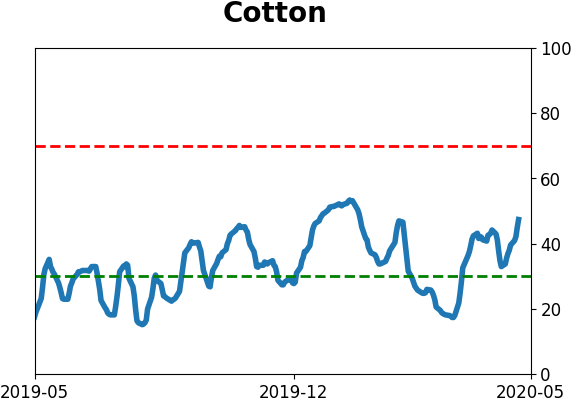
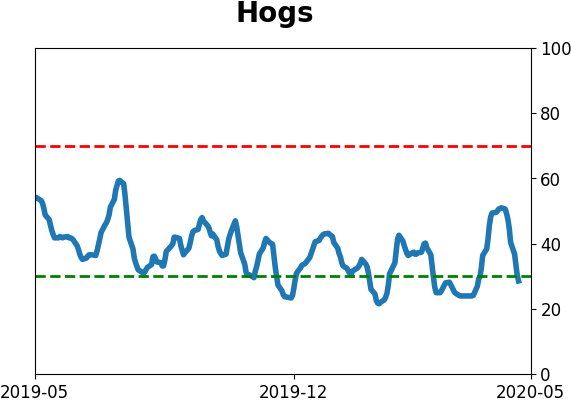
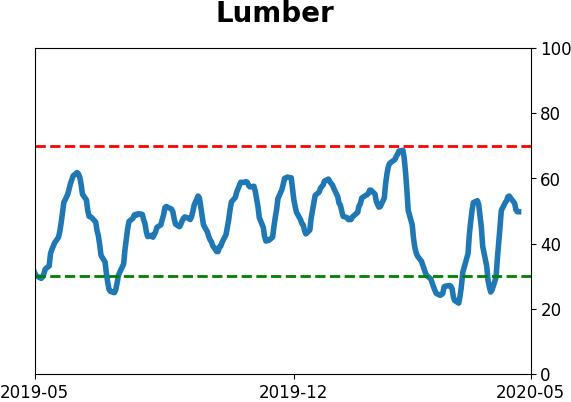
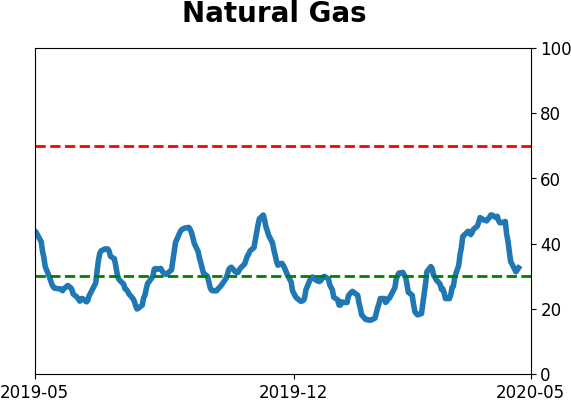
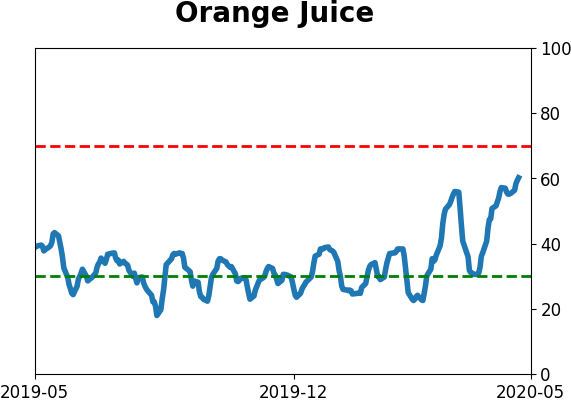
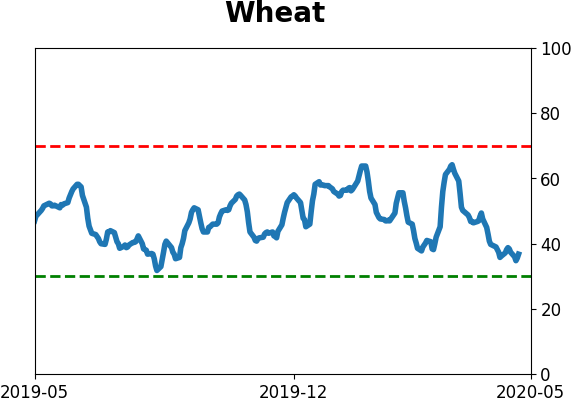
Agriculture
|
|
Research
BOTTOM LINE
Every week for the past 12 weeks, investors have pulled money from overseas equity mutual funds and ETFs. It's on a scale now that rivals the worst of the 2008 financial crisis. Domestic funds have seen less outflow on a relative basis.
FORECAST / TIMEFRAME
None
|
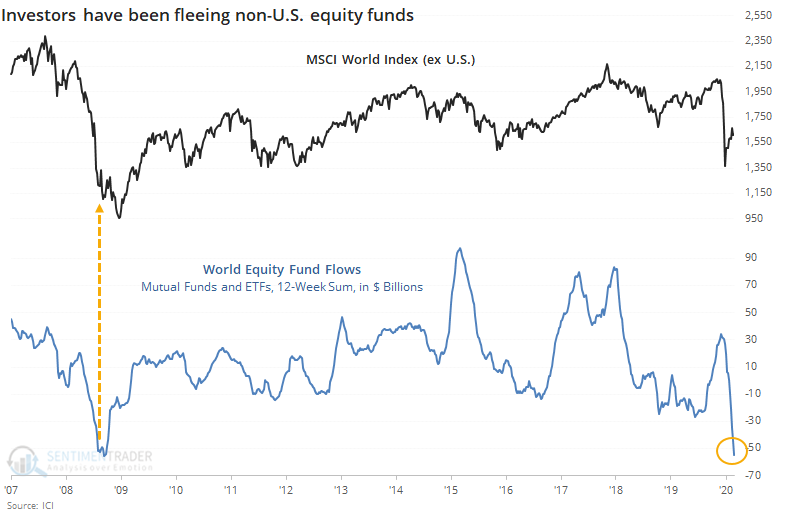
The latest weekly data from the Investment Company Institute shows that investors continue to shun equity funds that are focused outside of the U.S., with overseas funds suffering their 12th consecutive week of outflows. That's among the longest streaks since 2007.
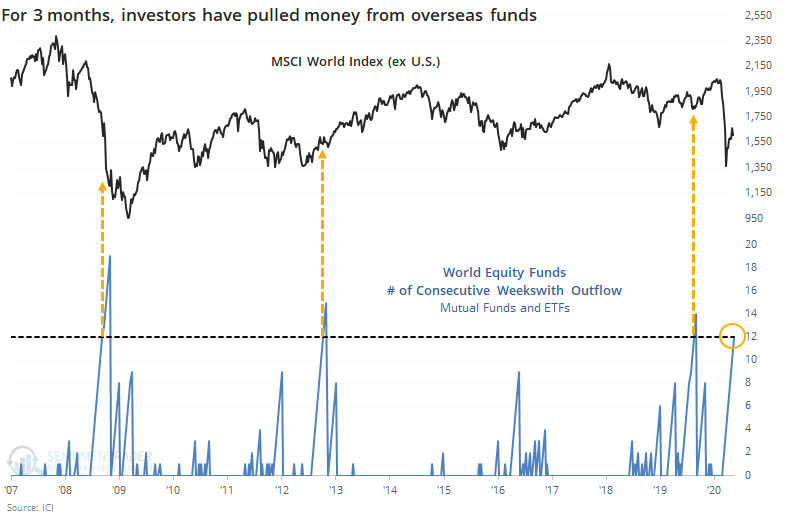
The streak went quite a bit longer in 2008 as the global financial crisis tumbled into its final phase. The other two times the streak lasted this long resulted in higher prices, though the one in August 2019 ultimately led to the current decline after 6 months of gains in the MSCI World Index (excluding the United States).
Over those 12 weeks, investors have fled more than $54 billion worth of world funds, on par with the worst of the selling in 2008. No other time period comes close.
They've also been selling domestic funds since the tumult began in March but not to the same degree as non-domestic funds. The spread between them is now among the narrowest in 13 years.
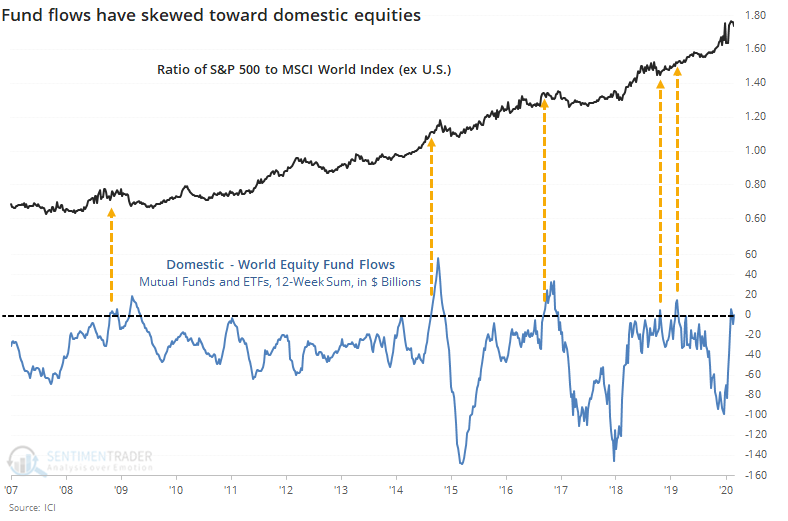
Other times when investors favored domestic versus non-domestic funds over this long of a stretch, the ratio between the S&P 500 and MSCI World Index soon peaked several times, but the last two did not.
The sample size is unfortunately limited, but from what we can see, this kind of outflow may not be enough to suggest other markets are likely to outperform the U.S. It is extreme enough to suggest a longer-term give-up among investors, and a generally positive environment outside the U.S. over the medium- to long-term.
BOTTOM LINE
The S&P 500 has been stuck in a range for a month, above its medium-term 50-day moving average but below its long-term 200-day average. Based on other long streaks of being stuck between time frames, there has been a higher likelihood it will break the streak by falling below its 50-day average. But future returns were weak, no matter which way it broke.
FORECAST / TIMEFRAME
None
|
We're stuck in post-panic churn, and the most benchmarked index in the world can't seem to get over the hump.
On Thursday, we saw that the S&P 500 hasn't been able to mount its 200-day average despite approaching it 3 weeks ago. And yet, it's still been able to hold above its rising 50-day average, which caused some to question which time frame will win out. Is it more likely for stocks to fail and fall below the 50-day average, or succeed and break out above the 200-day?
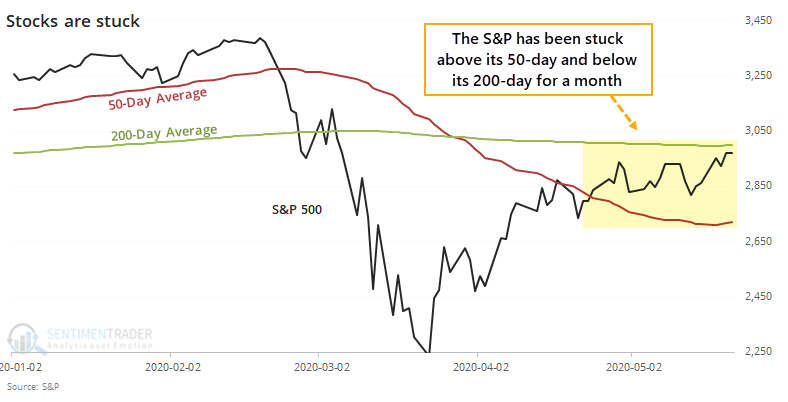
Now that its streak of being stuck has reached 20 days, it's one of the longer battles between time frames since 1928.
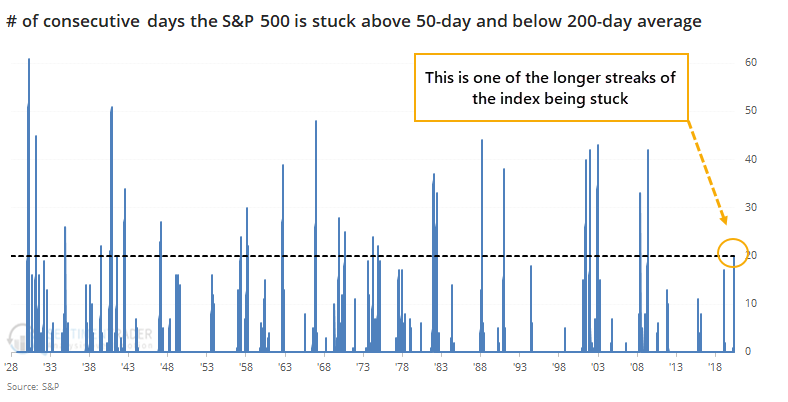
There have been 29 streaks that reached 20 days. Of those, 21 saw the streak end when the S&P fell below its 50-day average. Only 8 ended by the S&P rising above its 200-day average. So we could make the suggestion that there's about a 72% probability the index will break down.
It probably doesn't matter.
Below, we can see every time the S&P was stuck above its 50-day and below its 200-day for 20 consecutive sessions.
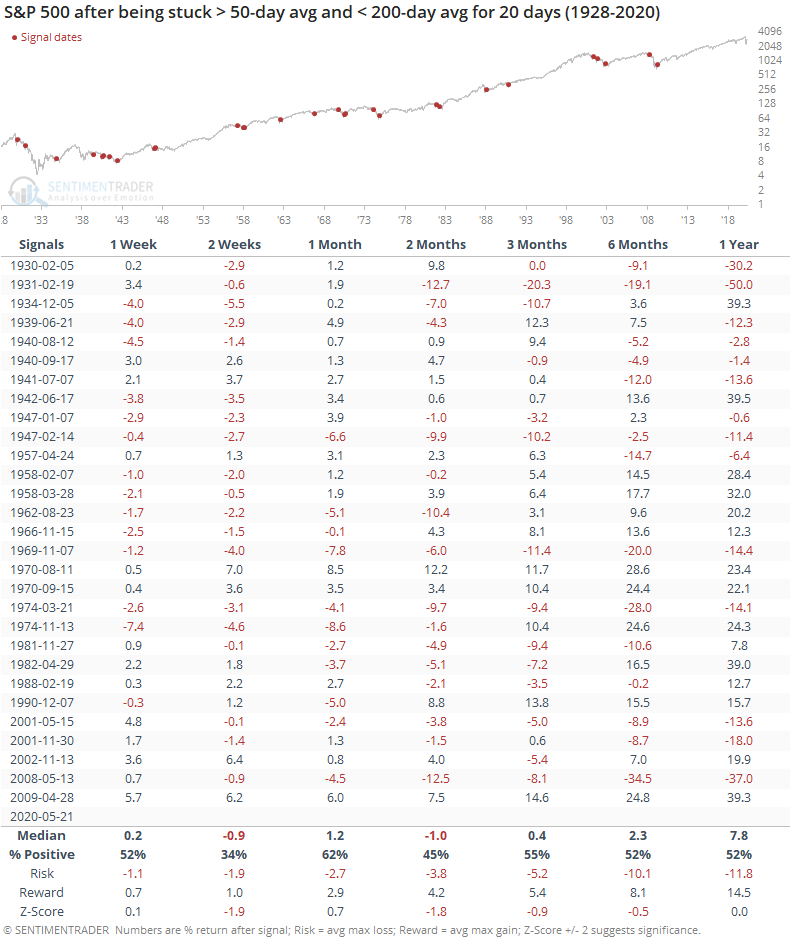
Like we saw on Thursday, when the index gets stuck below its long-term average, it has tended to resolve lower in the weeks ahead. Because of that, as noted above, there is a higher likelihood it will end the streak by falling below its 50-day average.
Here is how it performed after doing so:
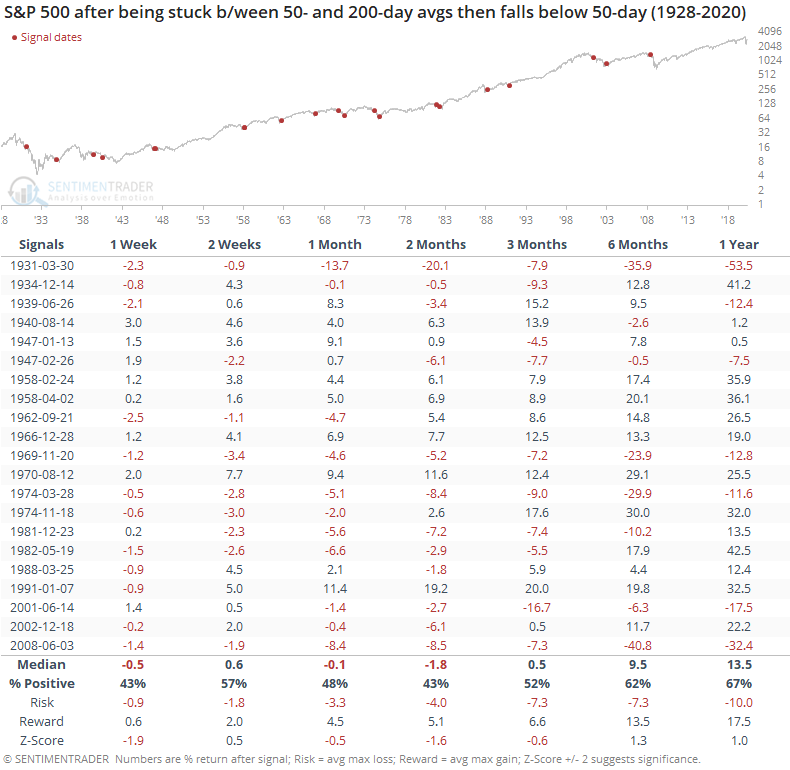
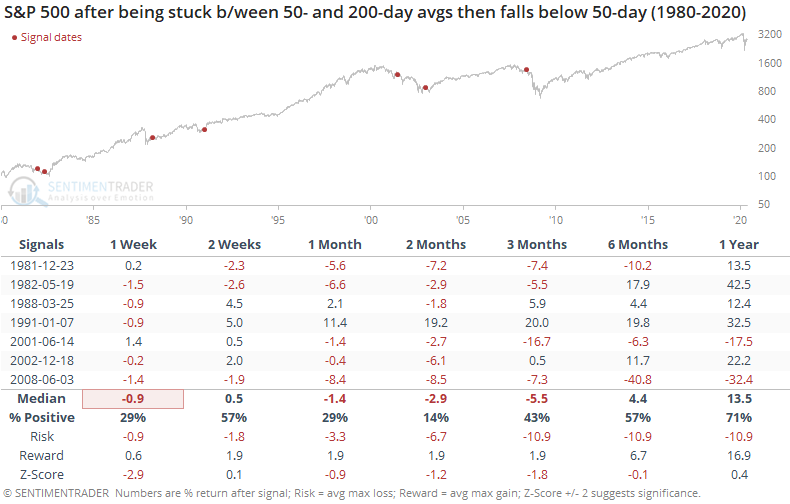
Again, the returns were poor, especially over the next two months. It has been an extremely bad sign over the past 40 years. Only one of the failures managed to quickly right itself and head higher, which ended up being a great sign for the longer-term.
So what about if the index breakouts out to the upside instead? Well, that wasn't great, either.
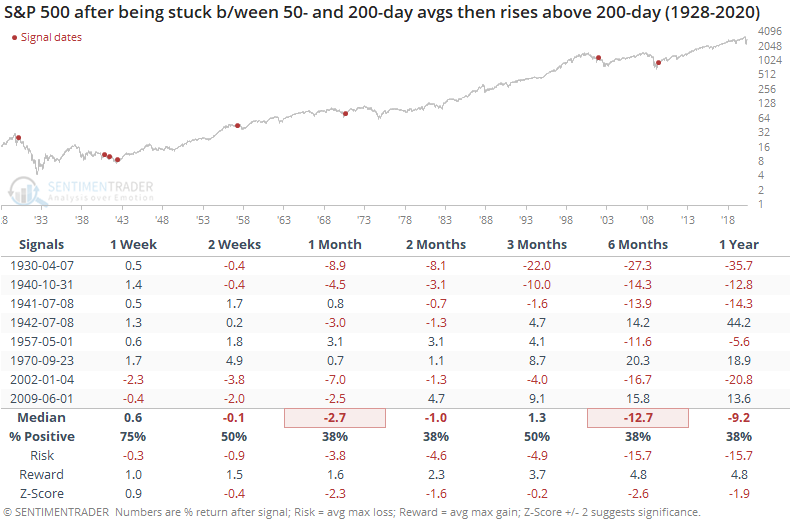
It's kind of a no-win situation. If the S&P broke down below its 50-day, then returns were bad (and terrible in recent decades). If it broke out to the upside, then returns were limited across almost all time frames, with really only one exception in 1970. All of the others either saw losses in the month(s) ahead or failed rallies.
The trouble is basically that buyers haven't shown enough oomph to make any progress lately. When that happens during downtrending markets like we've been in, with a protracted stretch near but below the 200-day average, it has indicated larger problems and that has almost always meant further weakness ahead.
Active Studies
| Time Frame | Bullish | Bearish | | Short-Term | 0 | 7 | | Medium-Term | 12 | 4 | | Long-Term | 37 | 3 |
|
Indicators at Extremes
Portfolio
| Position | Weight % | Added / Reduced | Date | | Stocks | 38.9 | Reduced 10% | 2020-05-13 | | Bonds | 0.0 | Reduced 6.7% | 2020-02-28 | | Commodities | 5.1 | Added 2.4%
| 2020-02-28 | | Precious Metals | 0.0 | Reduced 3.6% | 2020-02-28 | | Special Situations | 0.0 | Reduced 31.9% | 2020-03-17 | | Cash | 56.0 | | |
|
Updates (Changes made today are underlined)
In the first months of the year, we saw manic trading activity. From big jumps in specific stocks to historic highs in retail trading activity to record highs in household confidence to almost unbelievable confidence among options traders. All of that came amid a market where the average stock couldn't keep up with their indexes. There were signs of waning momentum in stocks underlying the major averages, which started triggering technical warning signs in late January. The kinds of extremes we saw in December and January typically take months to wear away, but the type of selling in March went a long way toward getting there. When we place the kind of moves we saw into March 23 into the context of coming off an all-time high, there has been a high probability of a multi-month rebound. After stocks bottomed on the 23rd, they enjoyed a historic buying thrust and retraced a larger amount of the decline than "just a bear market rally" tends to. While other signs are mixed that panic is subsiding, those thrusts are the most encouraging sign we've seen in years. Shorter-term, there have been some warning signs popping up and our studies have stopped showing as positively skewed returns. I reduced my exposure some in late April and was looking for a pattern of lower highs and lower lows to reduce it further. With weakness on May 12, our studies turned even more negative over the short- to medium-term so I reduced a bit more. Some short-term indicators are already nearing oversold so we may get a quick rebound but it is what it is. If we see a clear pattern of lower lows, I may reduce even further in the week(s) ahead. Long-term prospects look decent because of the thrusts we saw off the low, but I'm more comfortable in cash in the interim. I'd consider adding back if we see our indicators and studies start to skew to the upside again, or if price action turns clearly better, indicating my caution is wrong.
RETURN YTD: -7.9% 2019: 12.6%, 2018: 0.6%, 2017: 3.8%, 2016: 17.1%, 2015: 9.2%, 2014: 14.5%, 2013: 2.2%, 2012: 10.8%, 2011: 16.5%, 2010: 15.3%, 2009: 23.9%, 2008: 16.2%, 2007: 7.8%
|
|
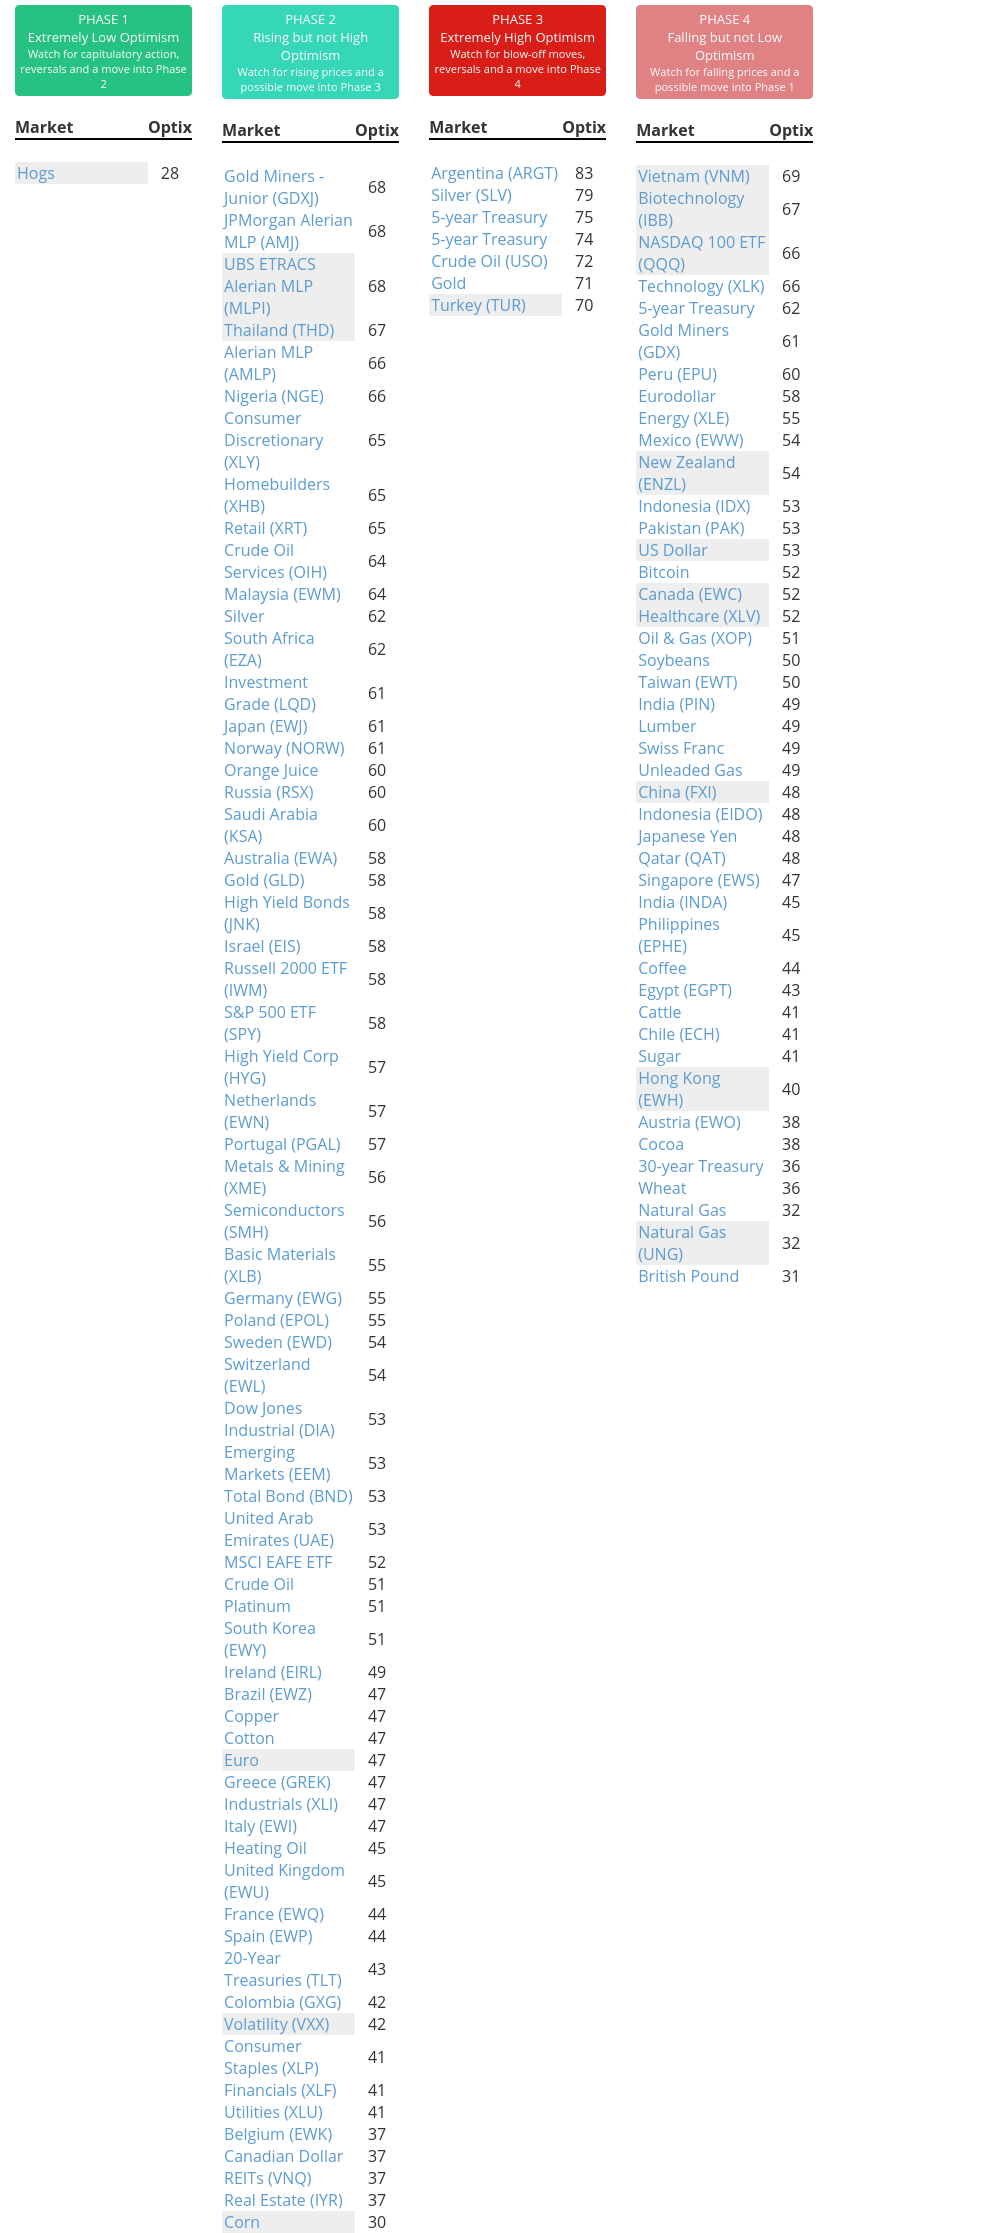
Phase Table
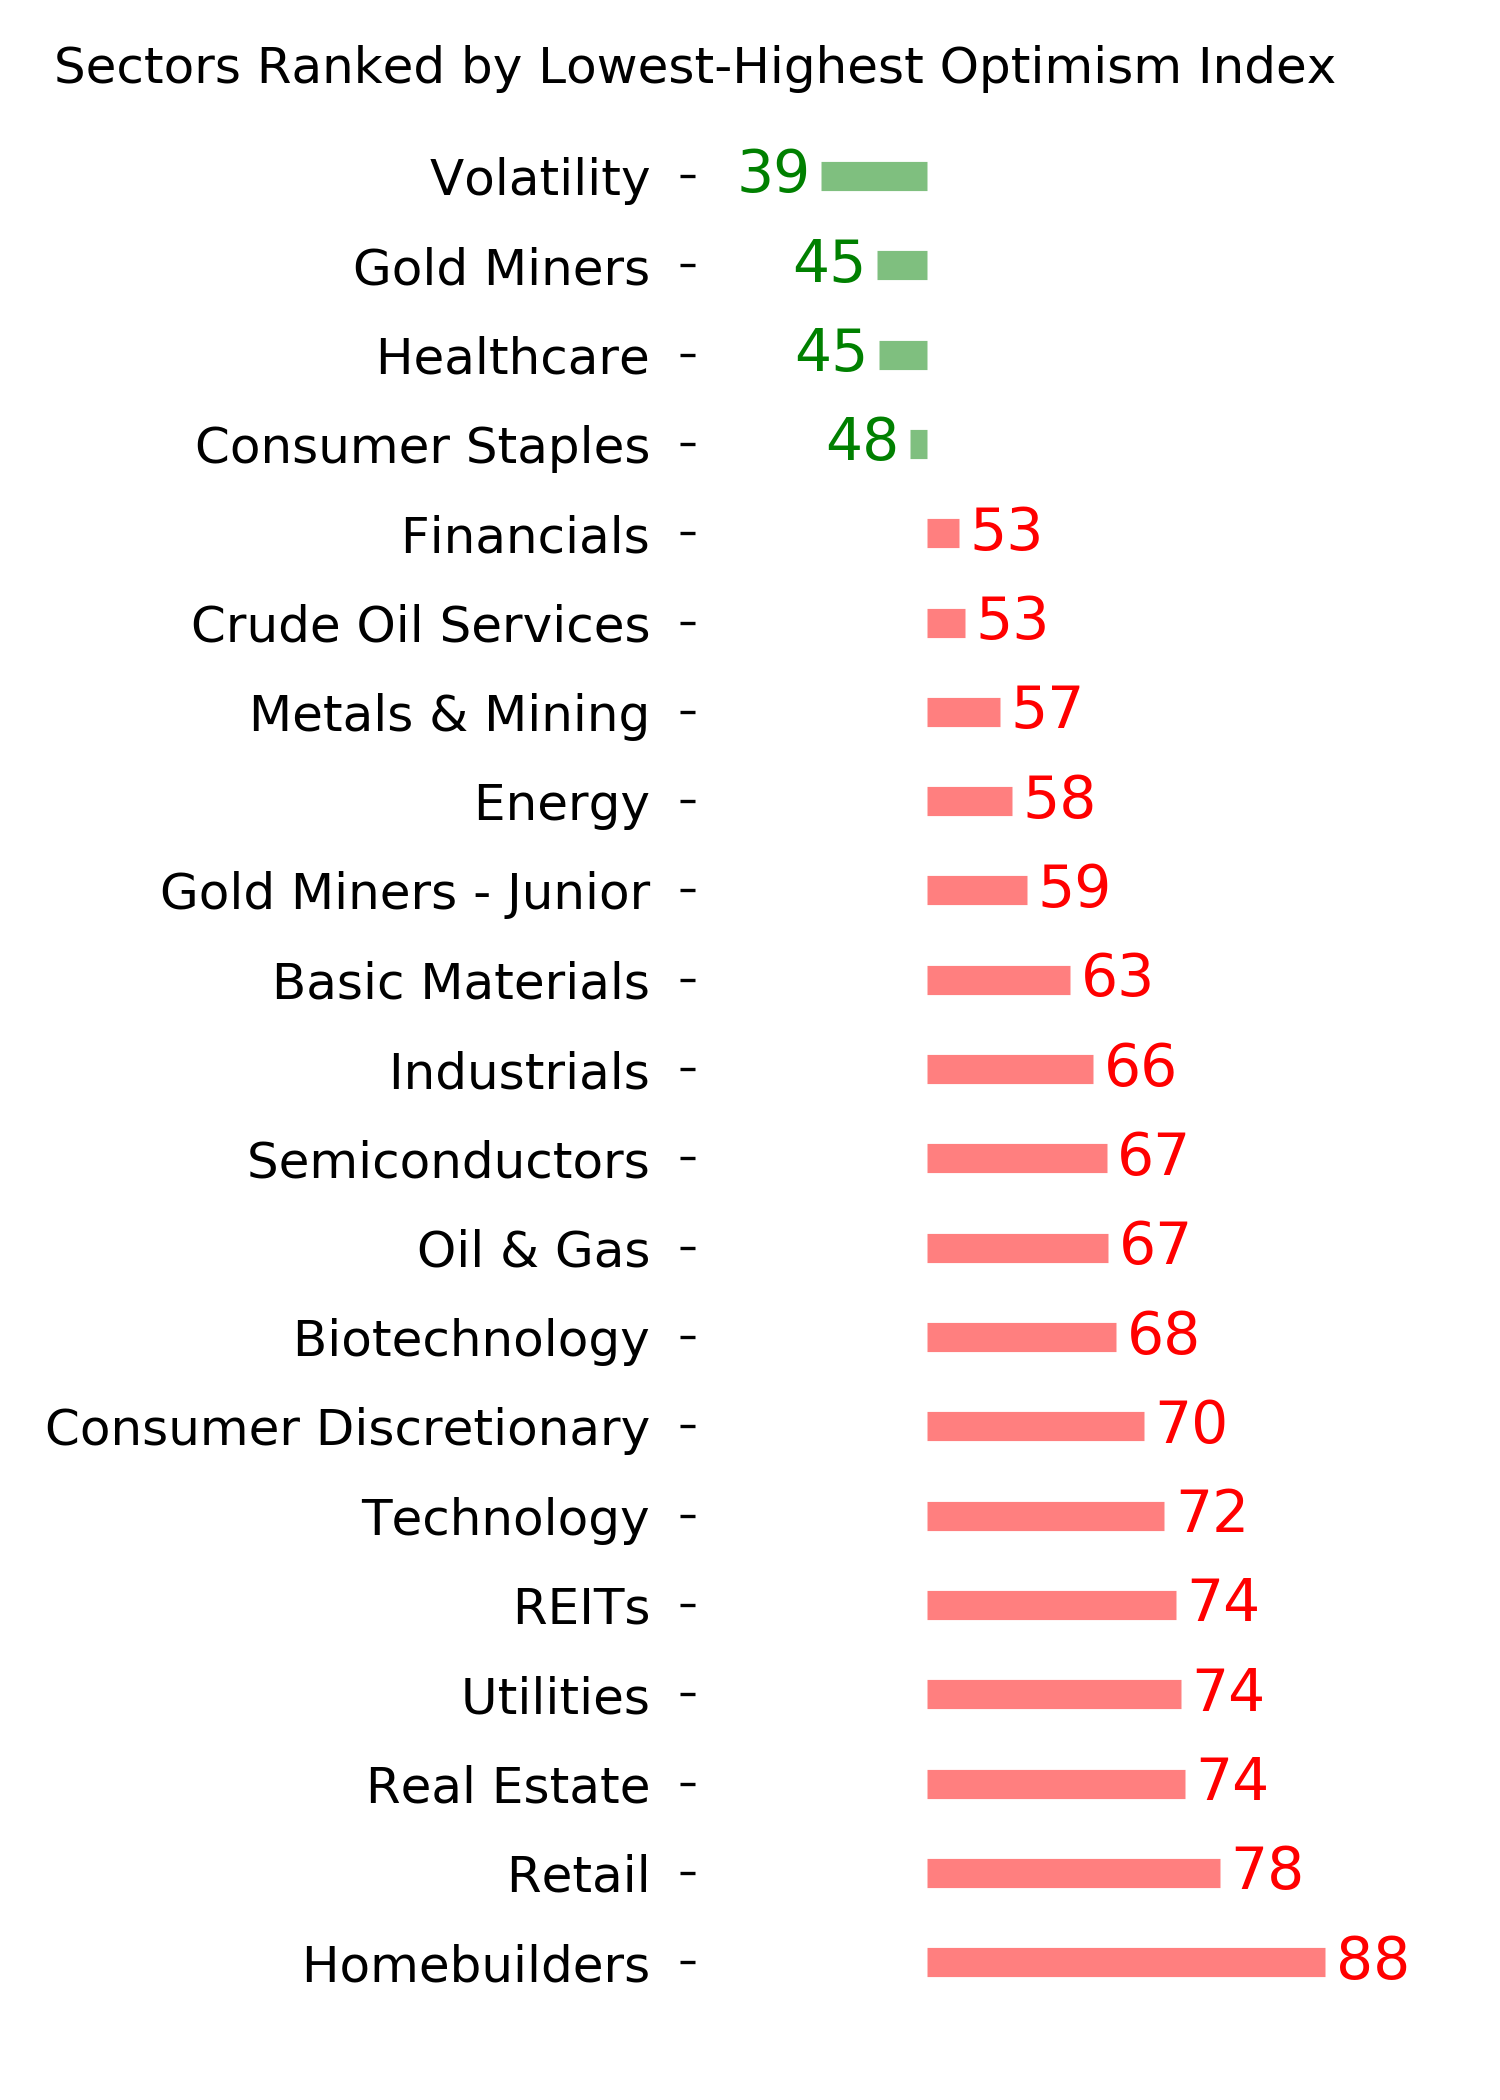
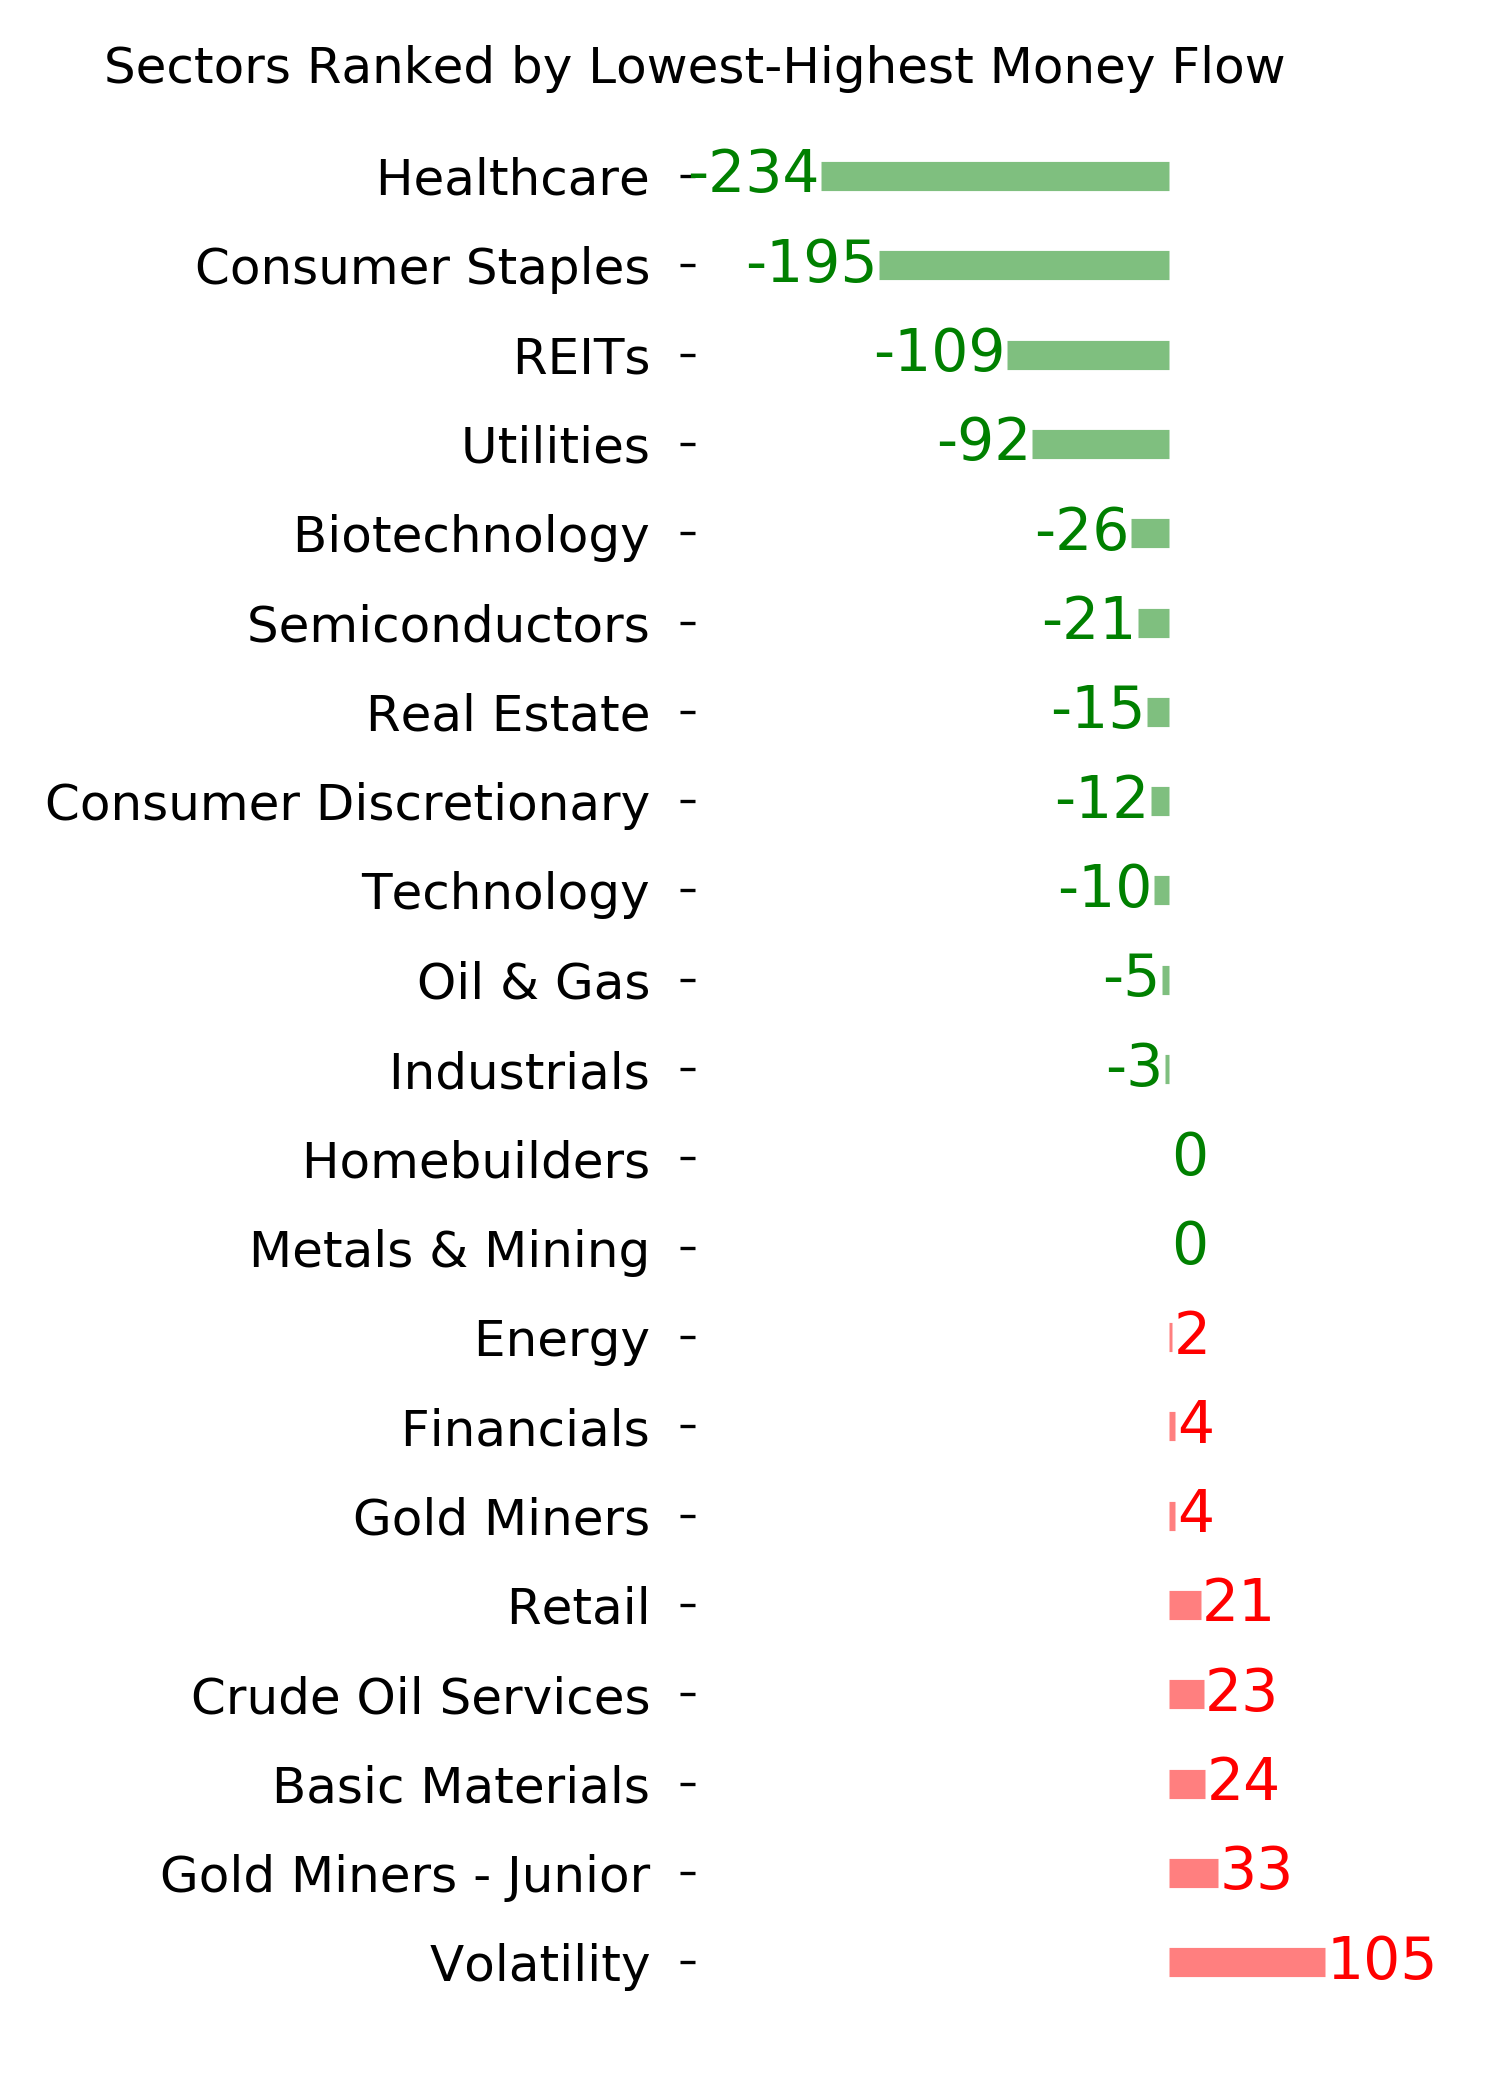
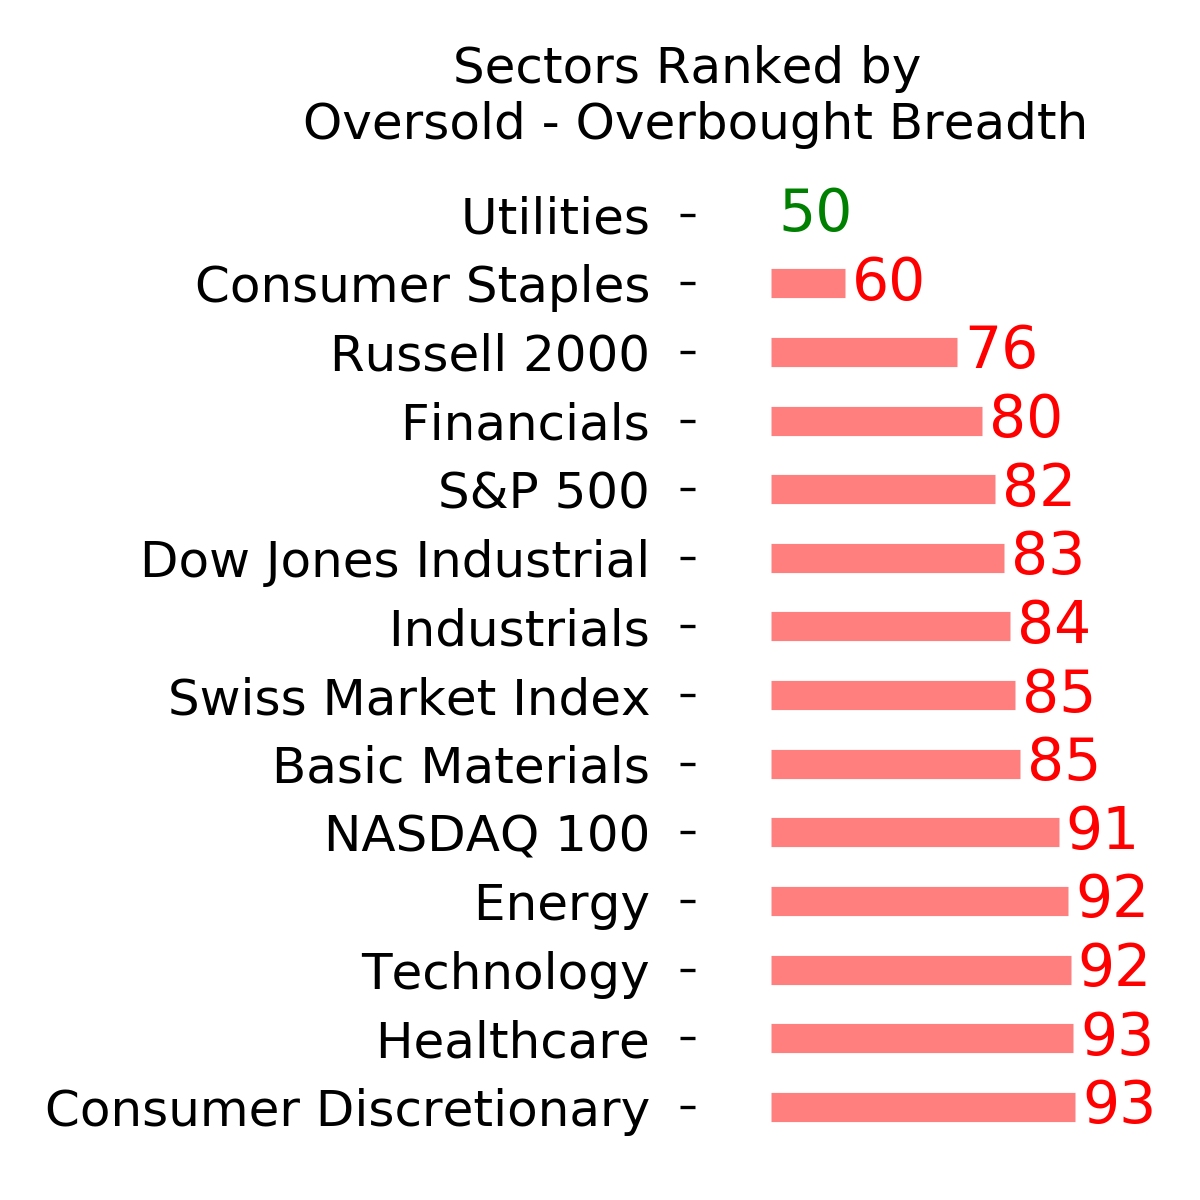
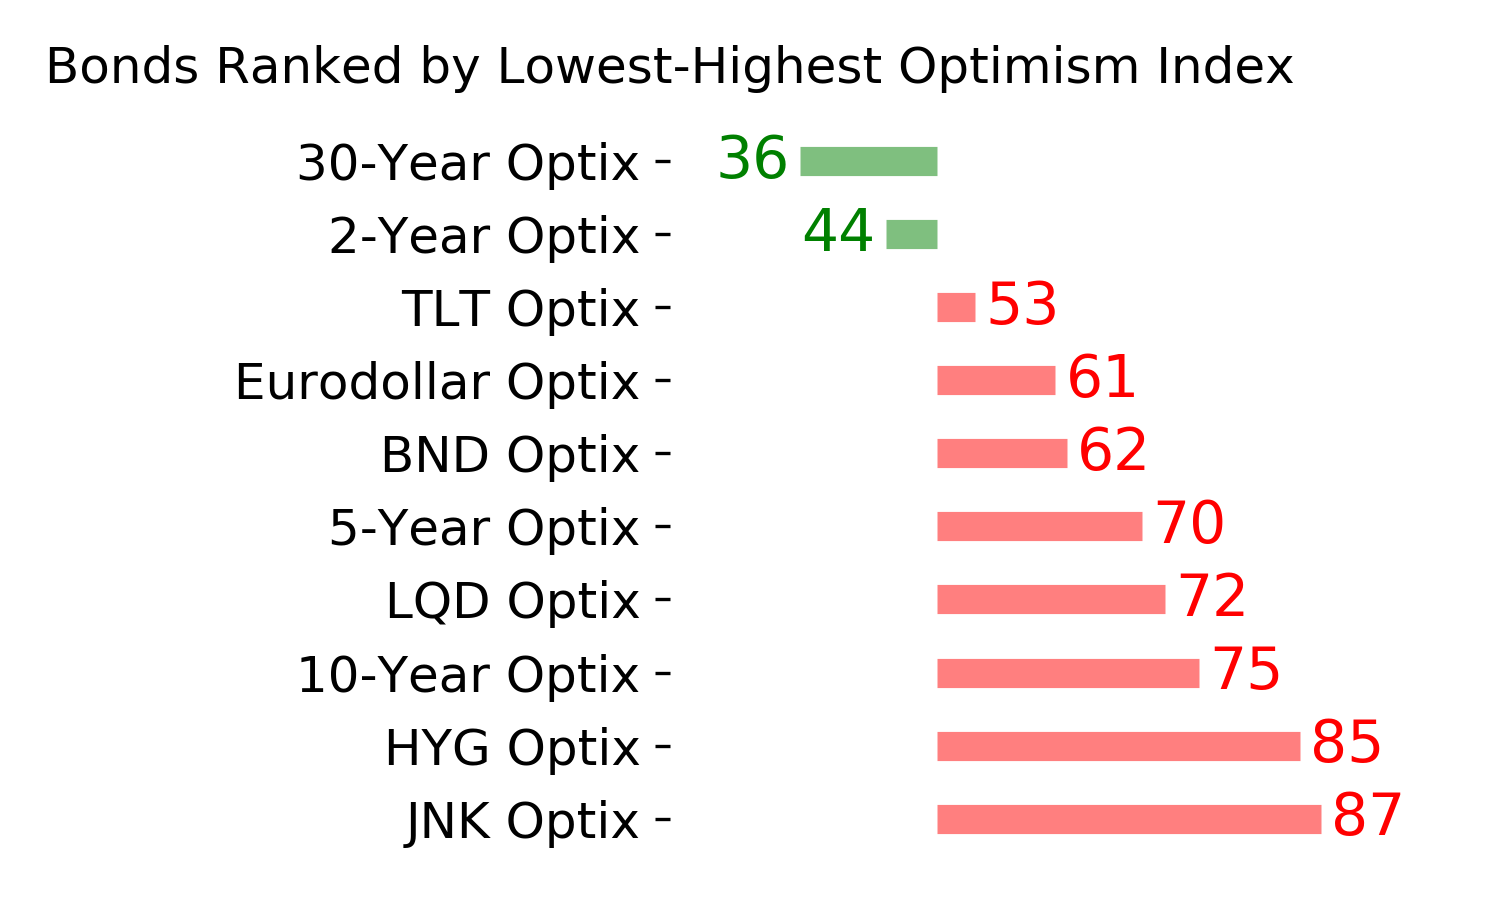
Ranks
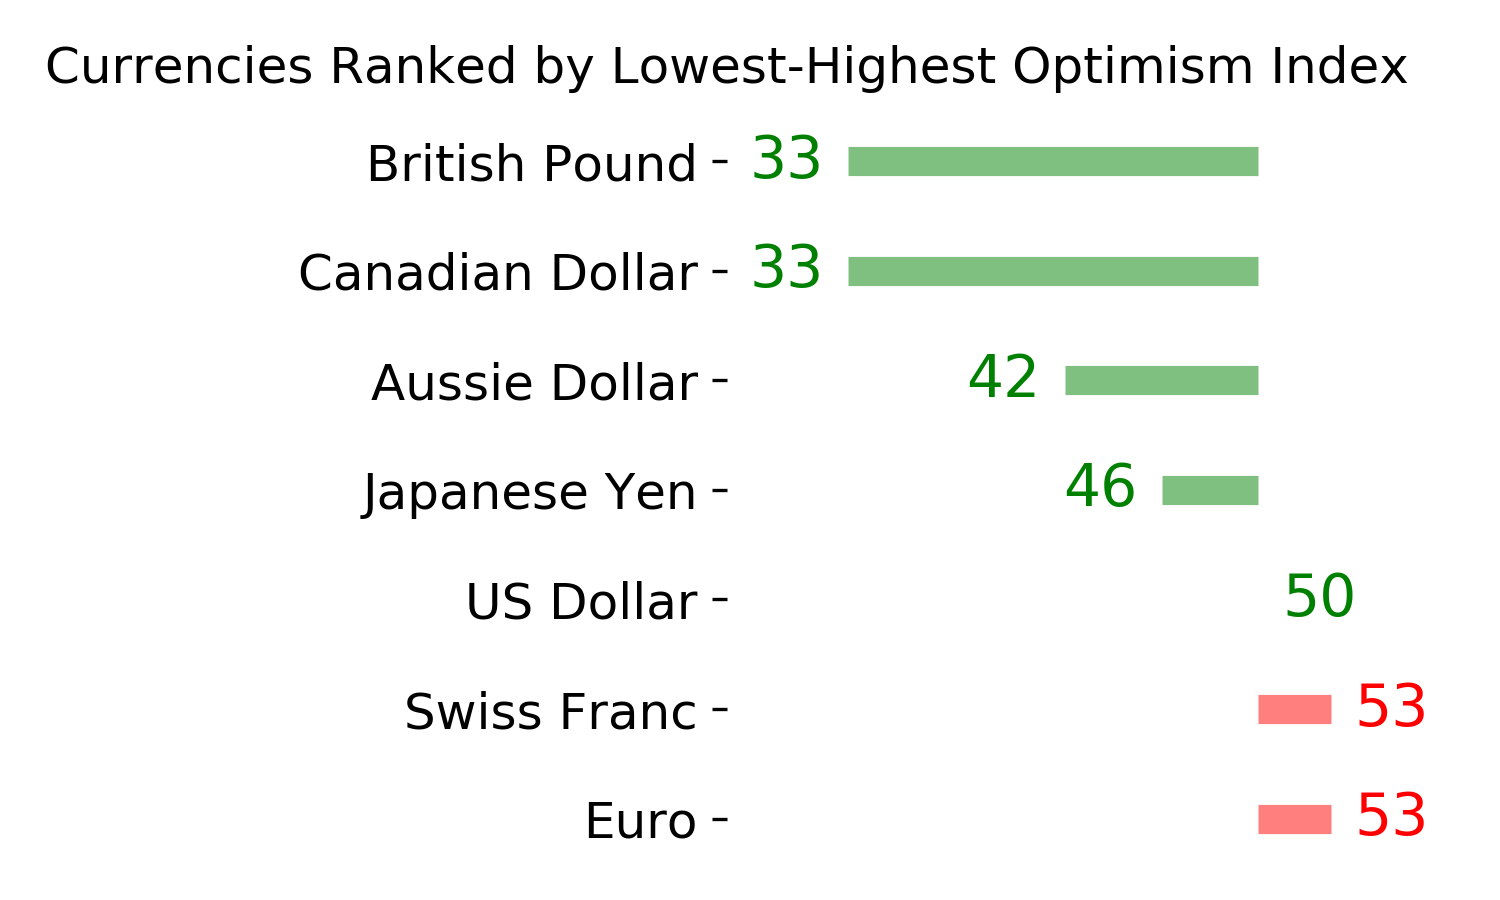
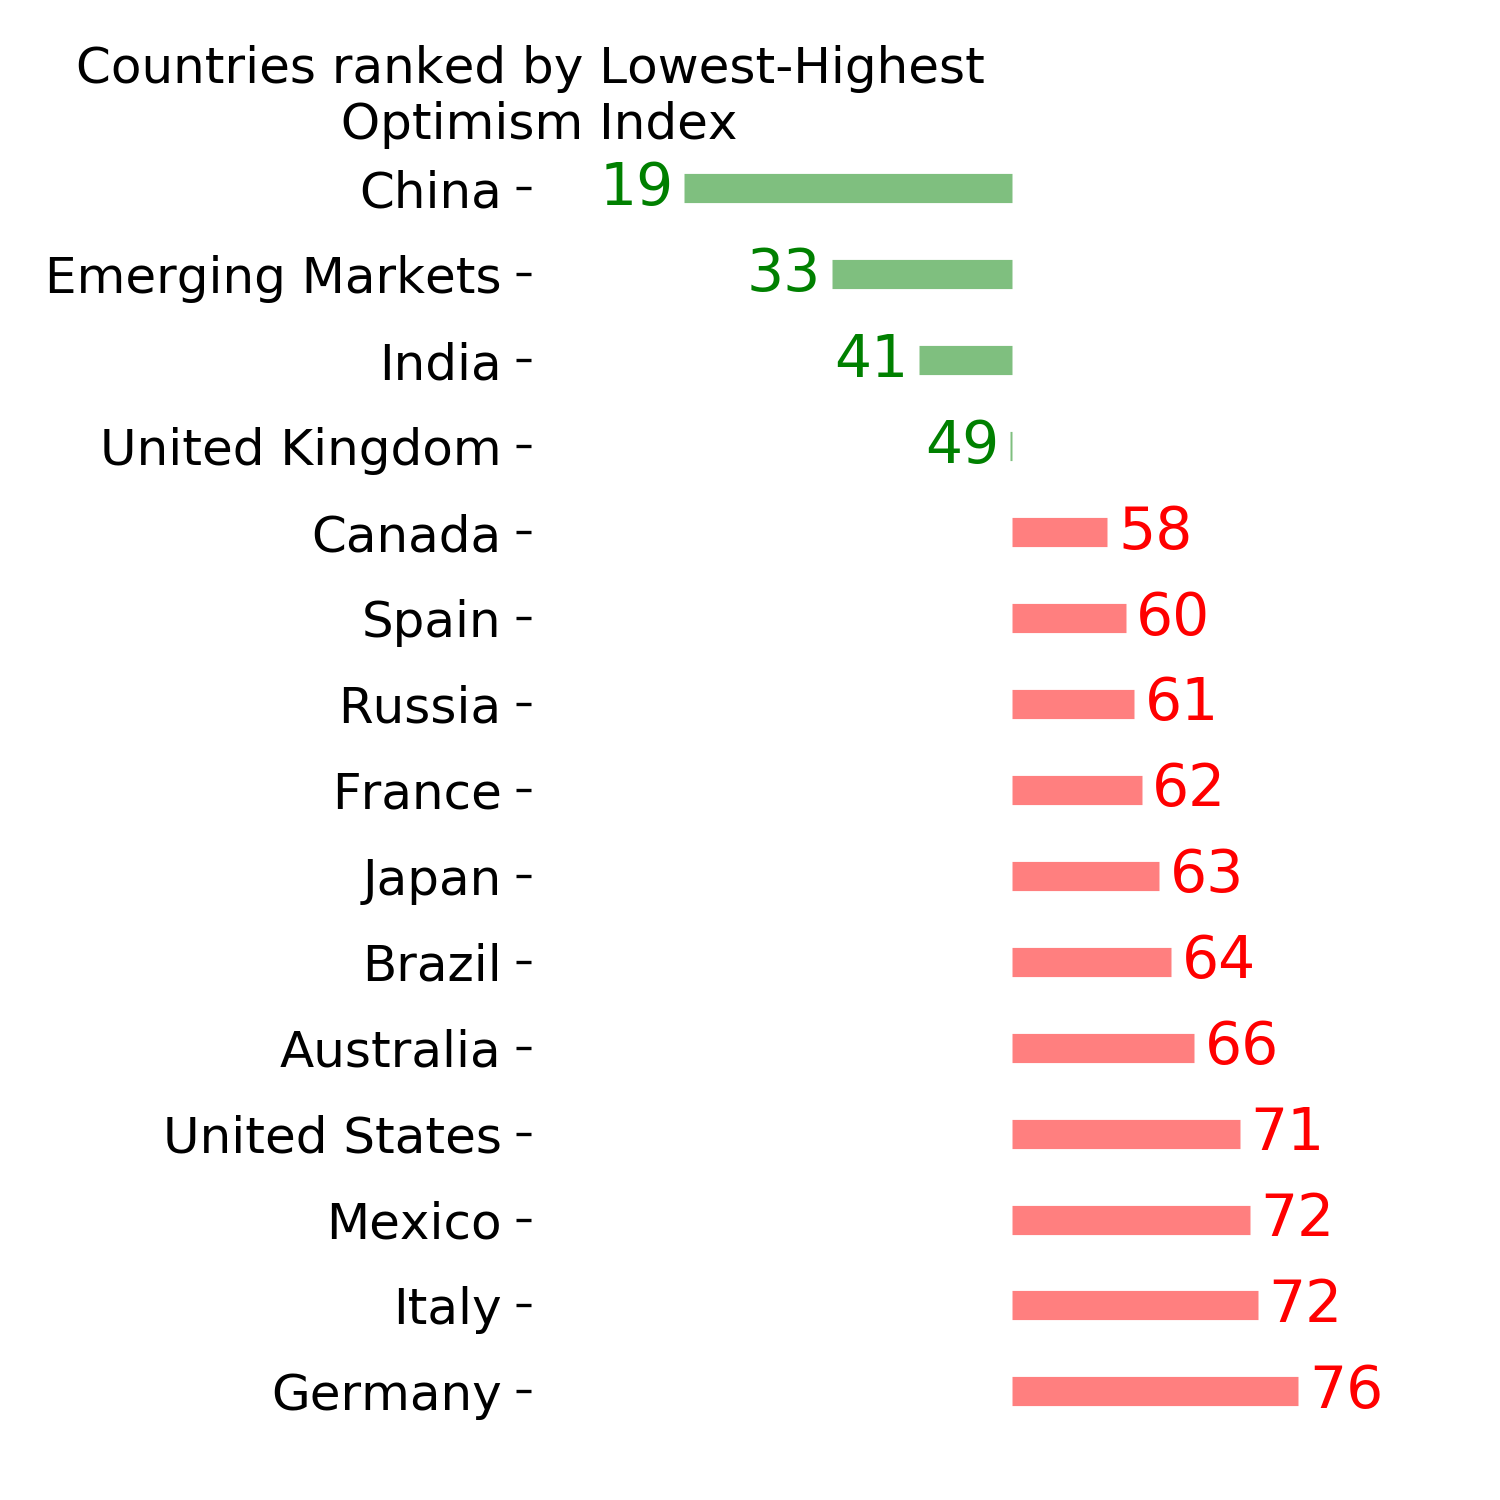
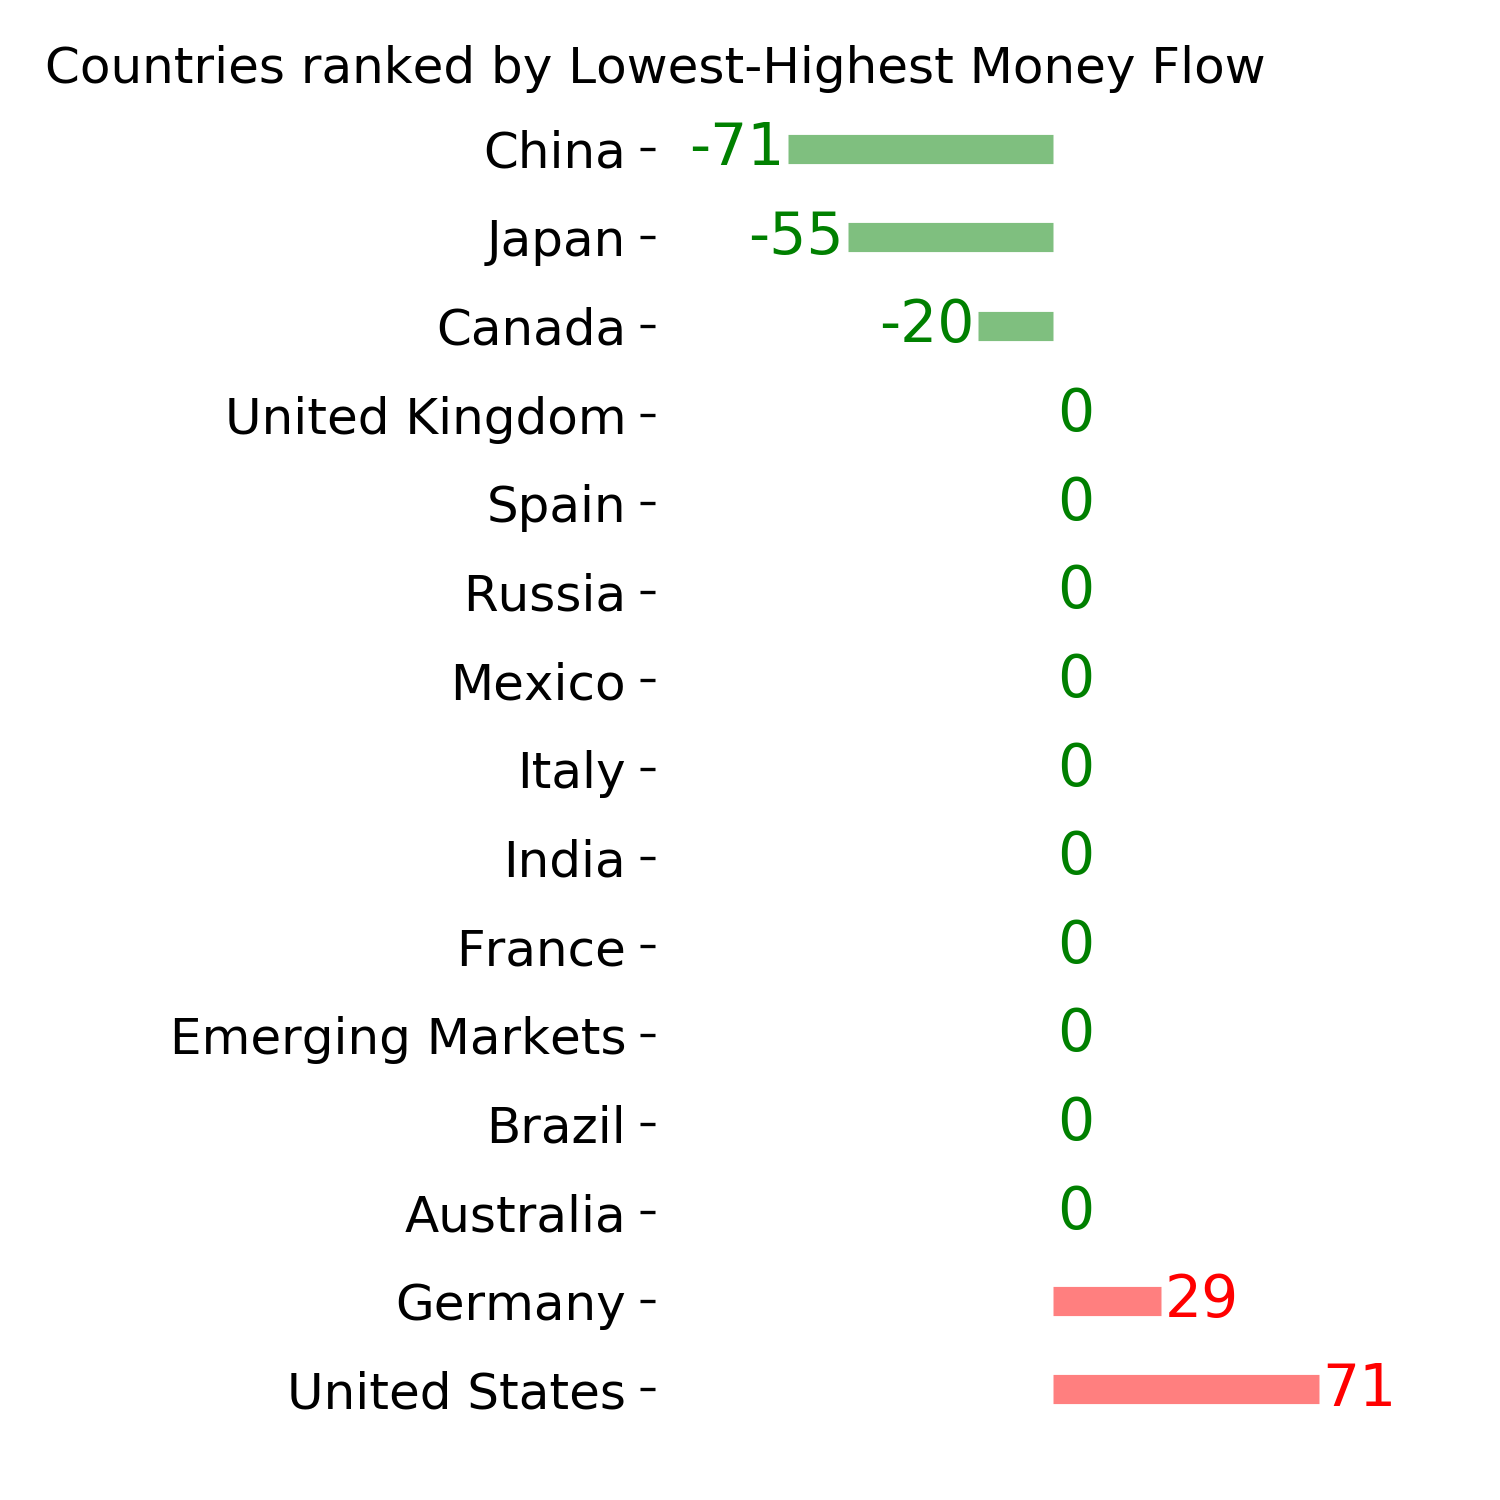
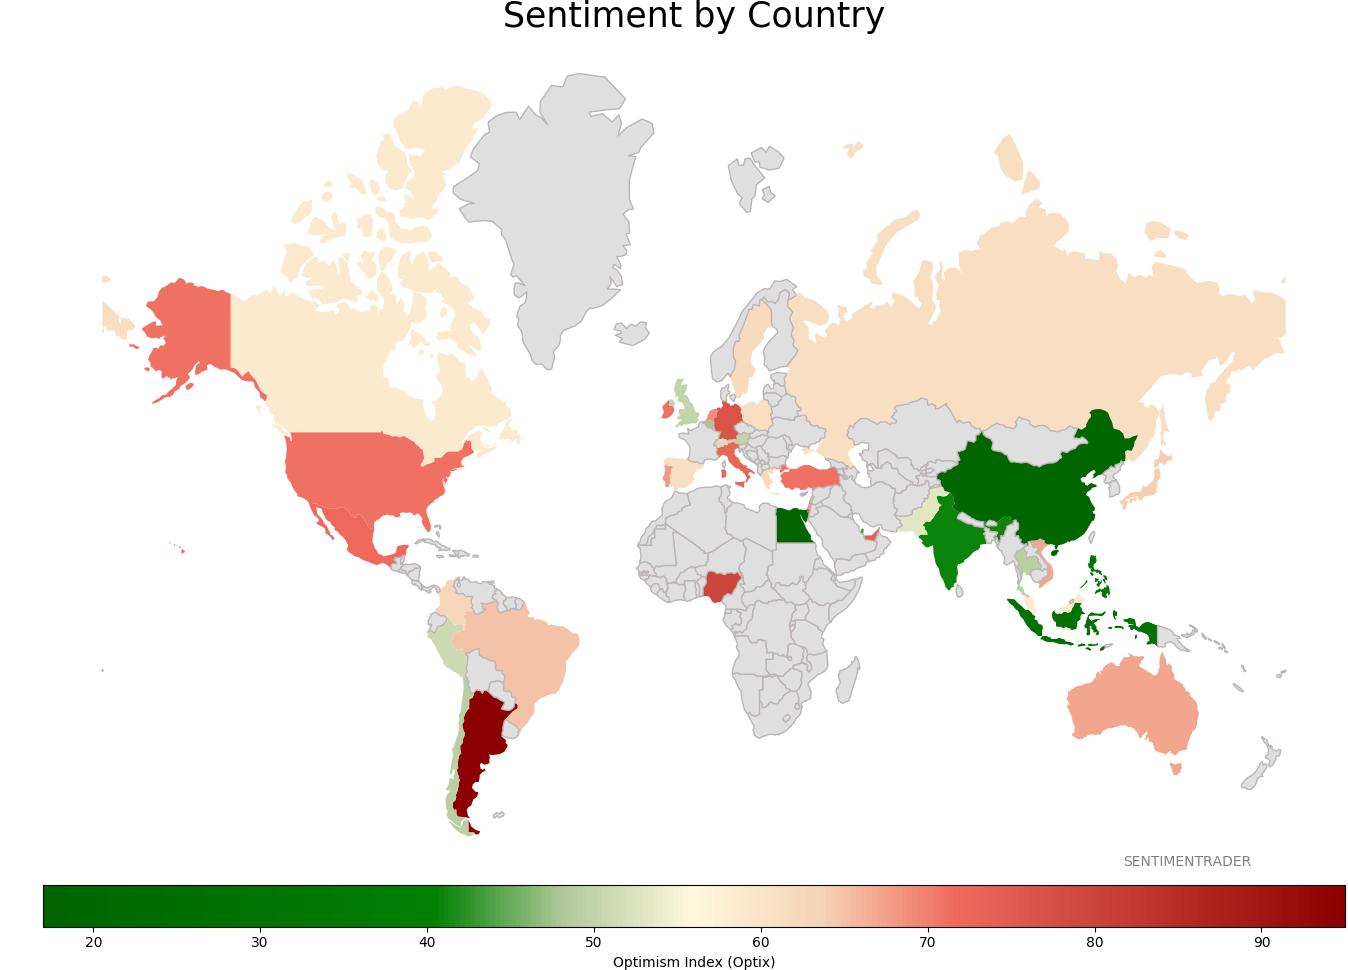
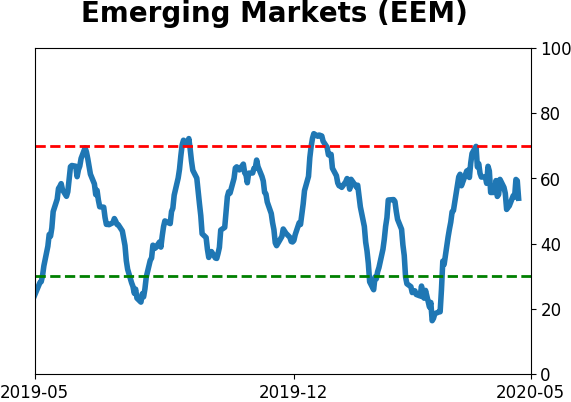
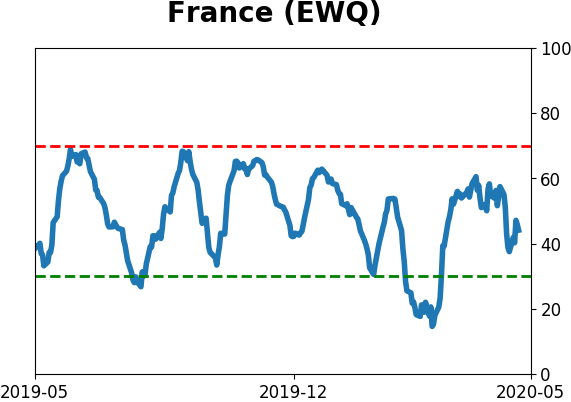
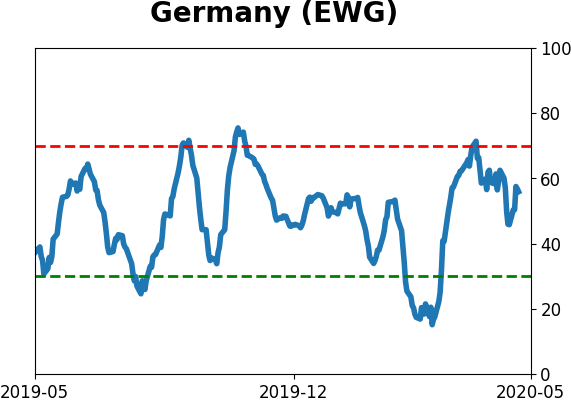
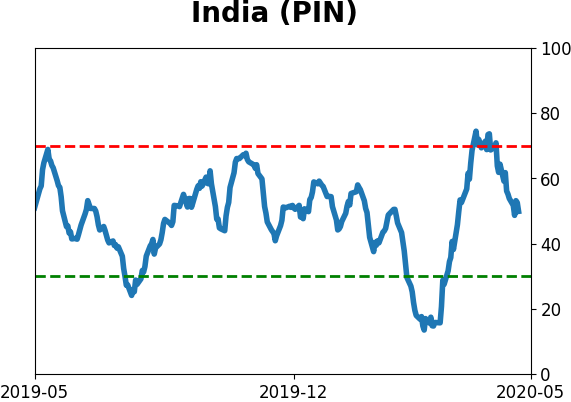
Sentiment Around The World
Optimism Index Thumbnails
|
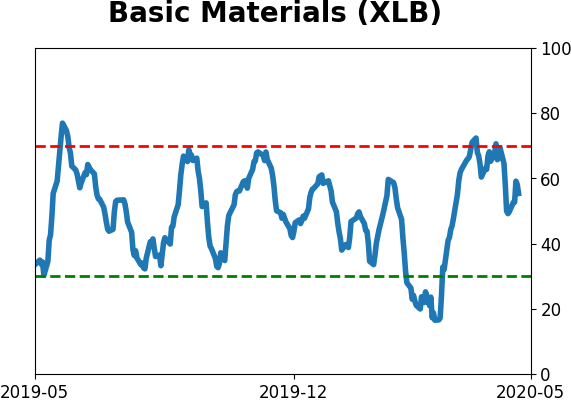
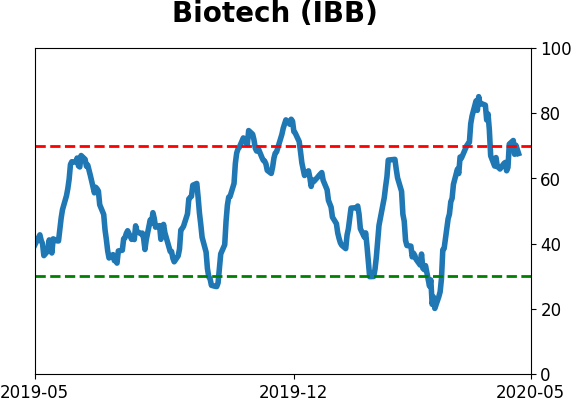
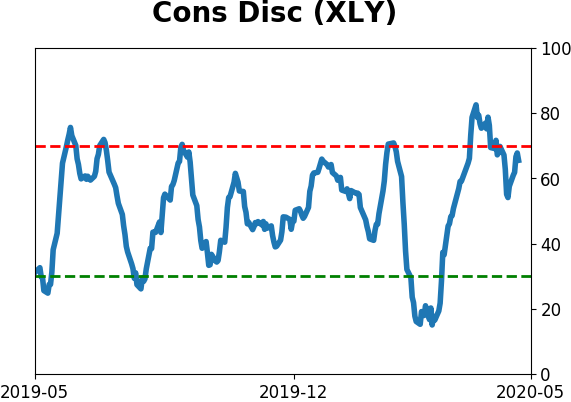
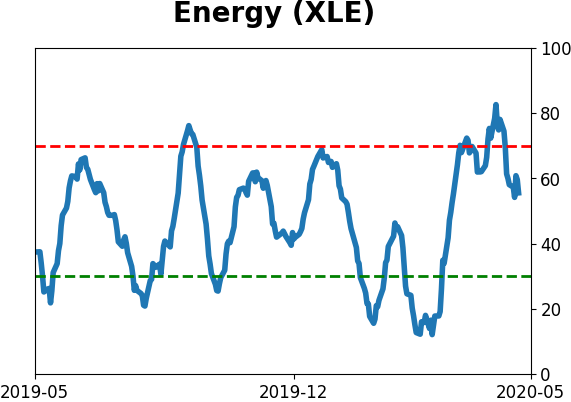
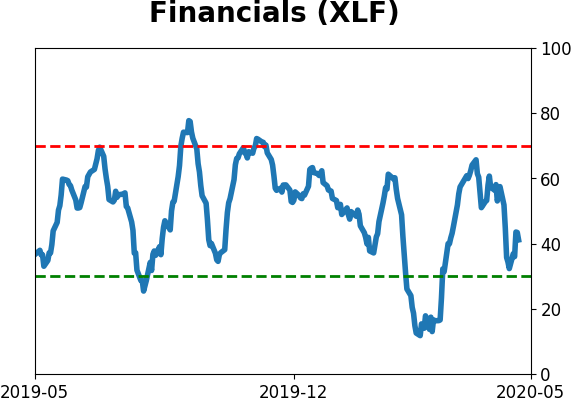
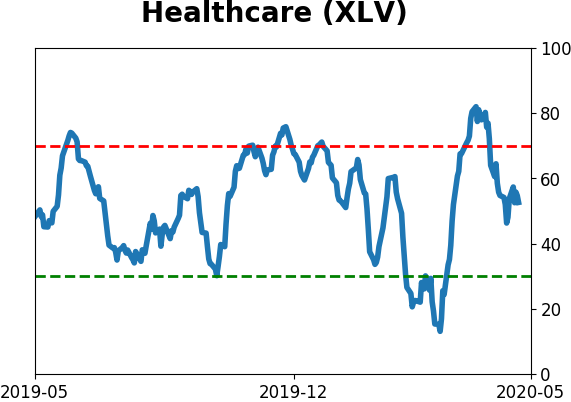
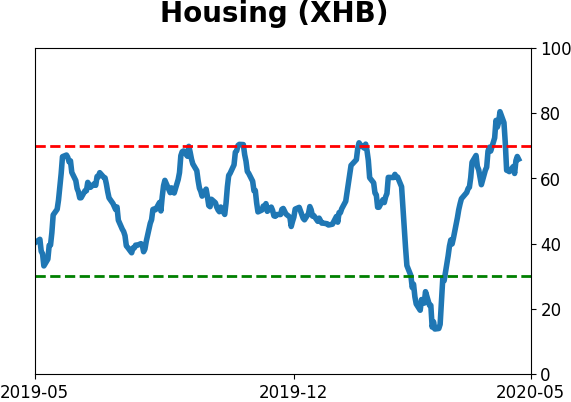
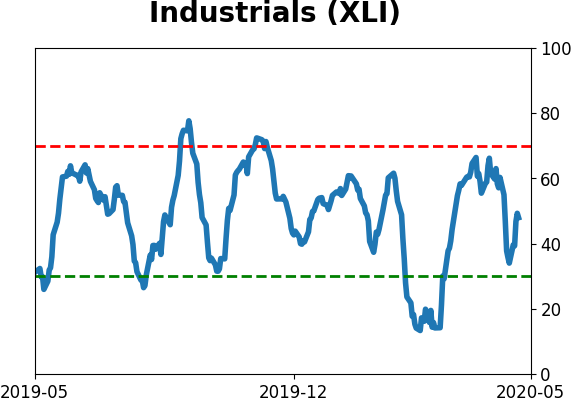
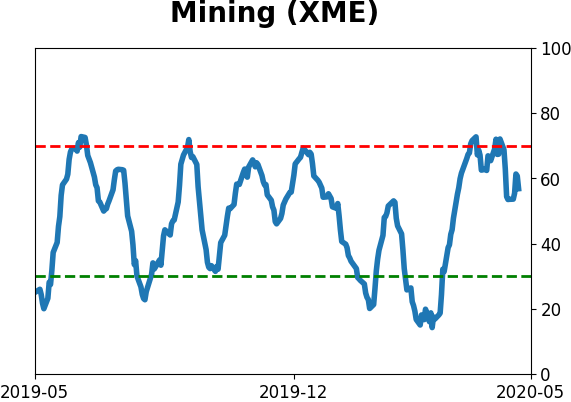
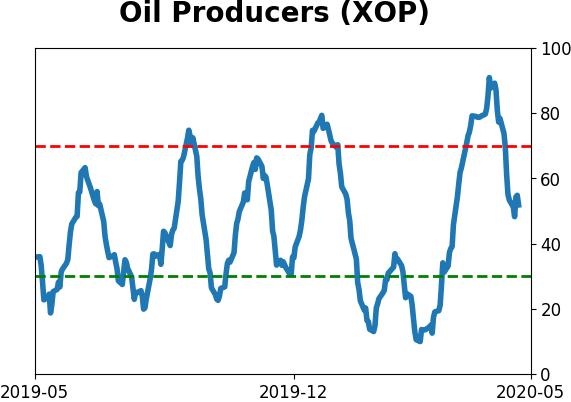
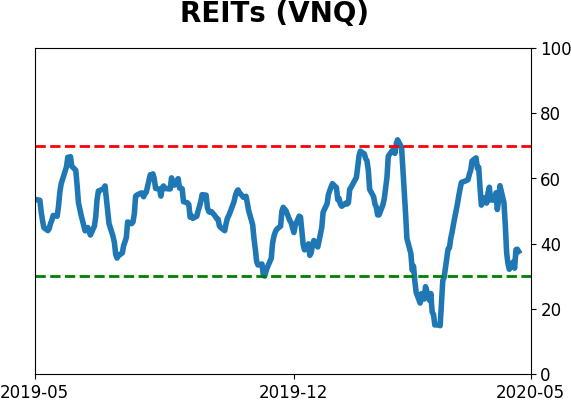
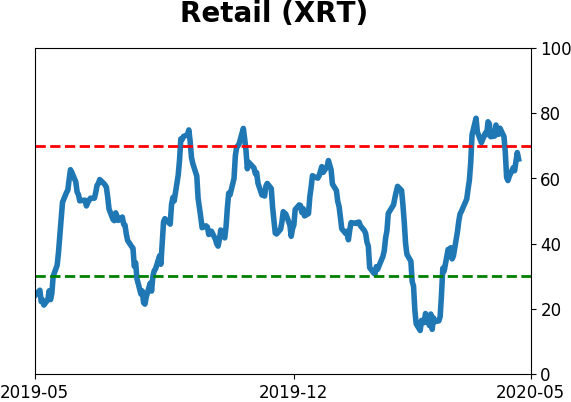
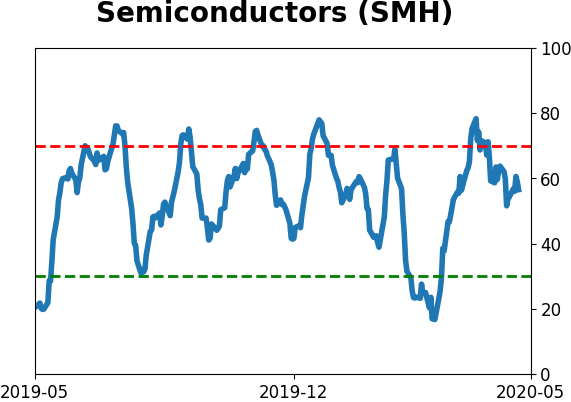
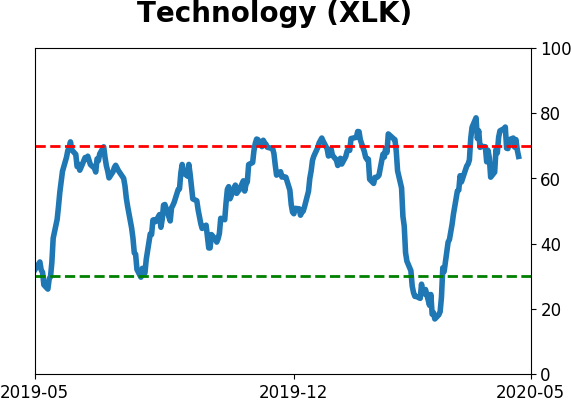
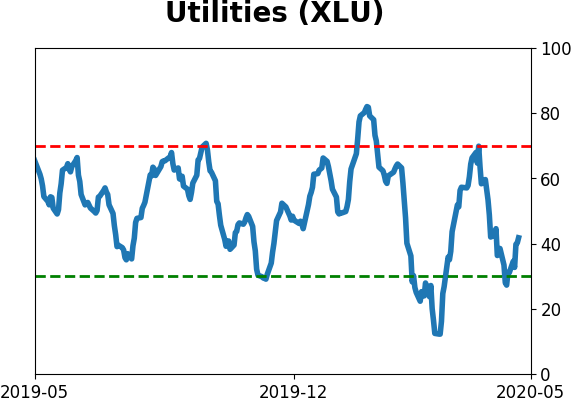
Sector ETF's - 10-Day Moving Average
|
|
|
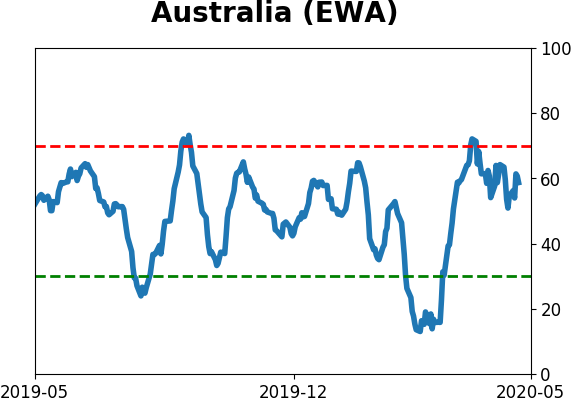
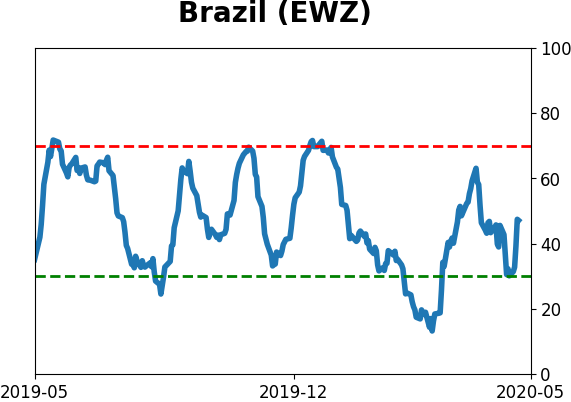
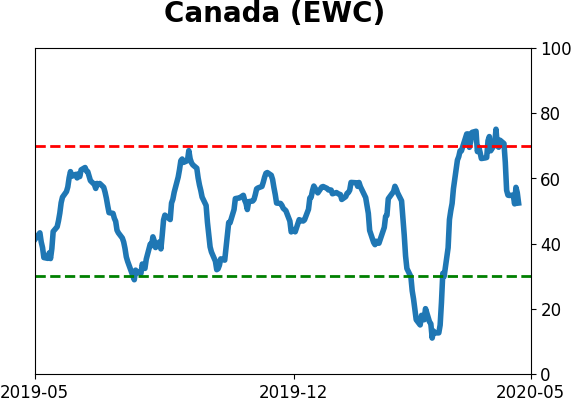
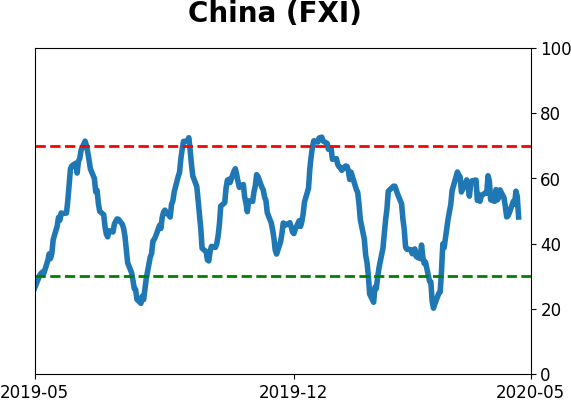
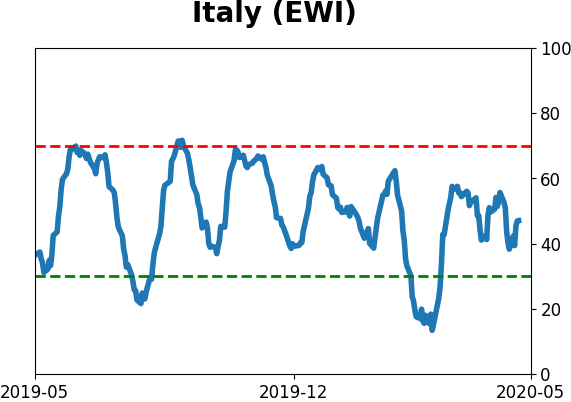
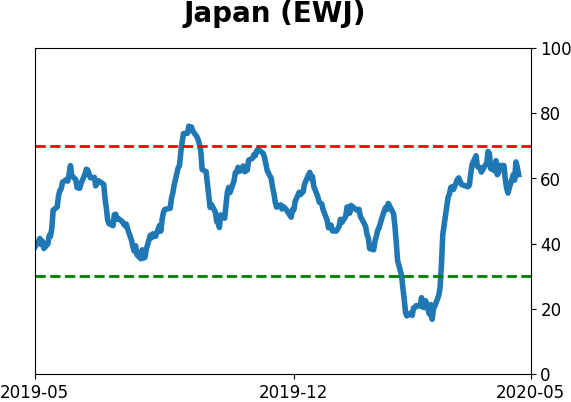
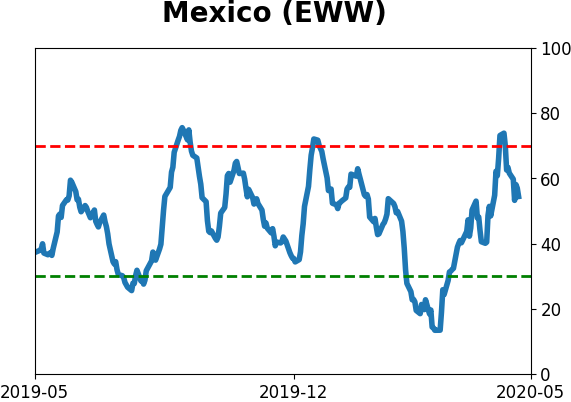
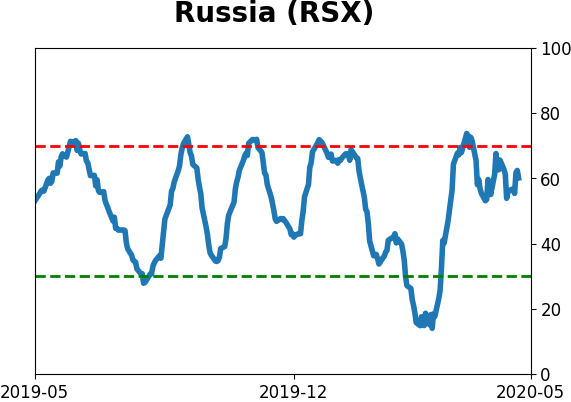
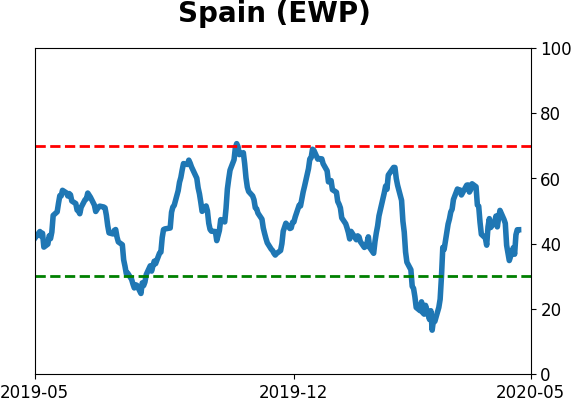
Country ETF's - 10-Day Moving Average
|
|
|
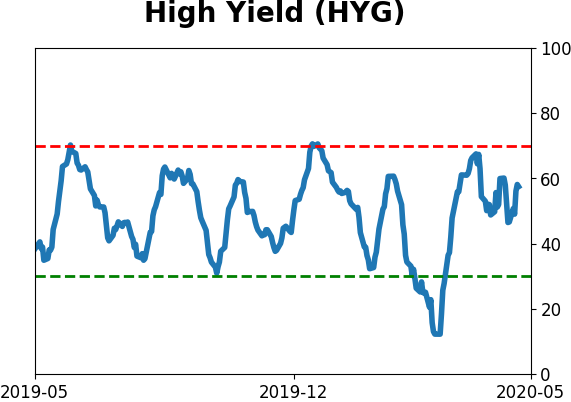
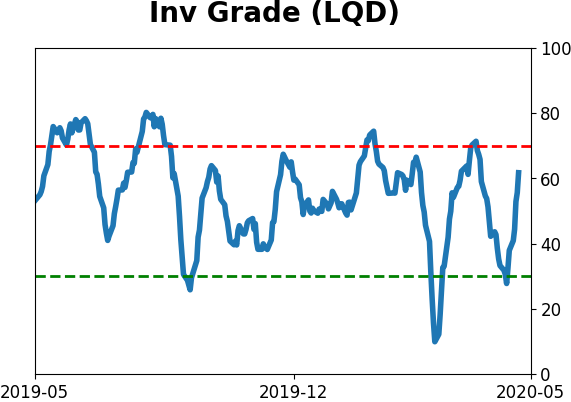
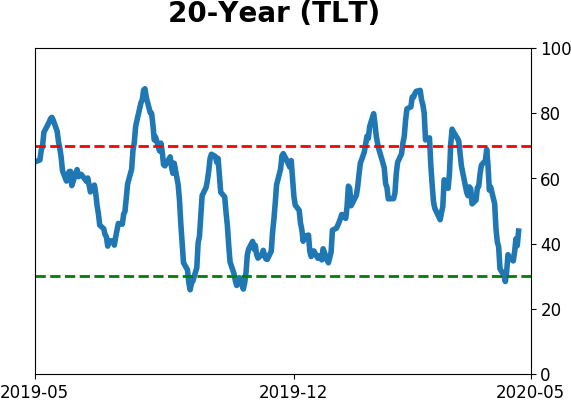
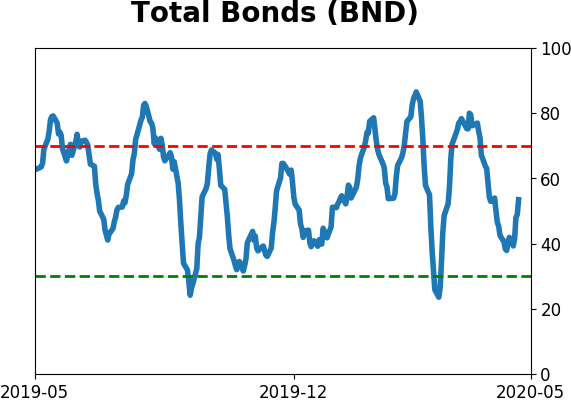
Bond ETF's - 10-Day Moving Average
|
|
|
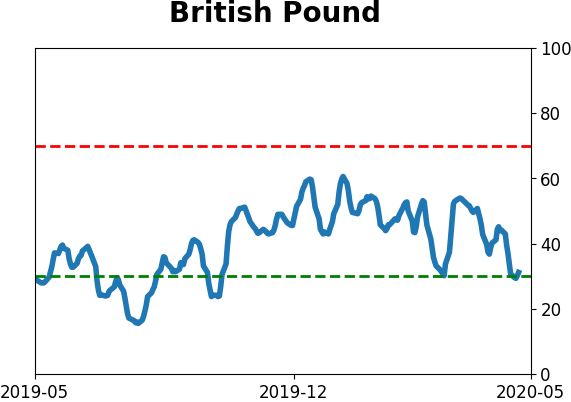
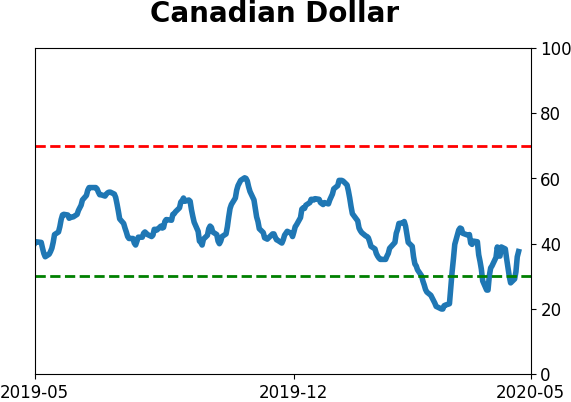
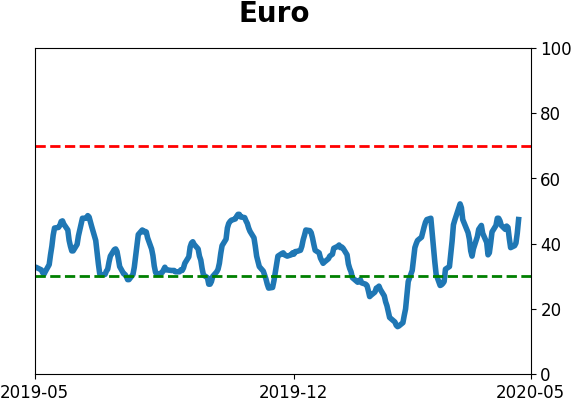
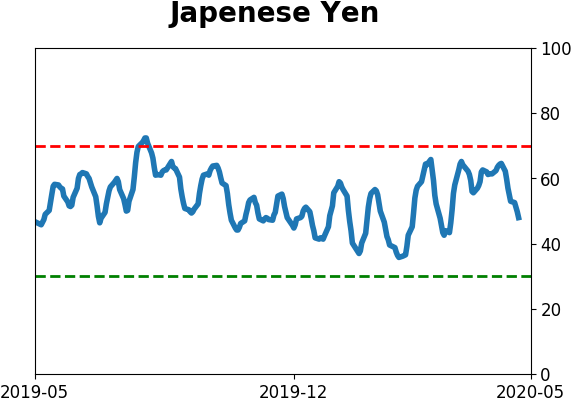
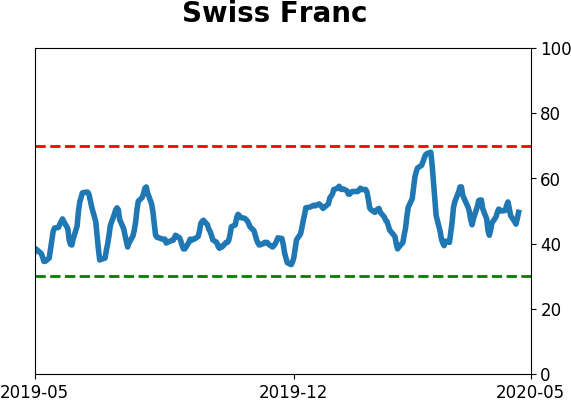
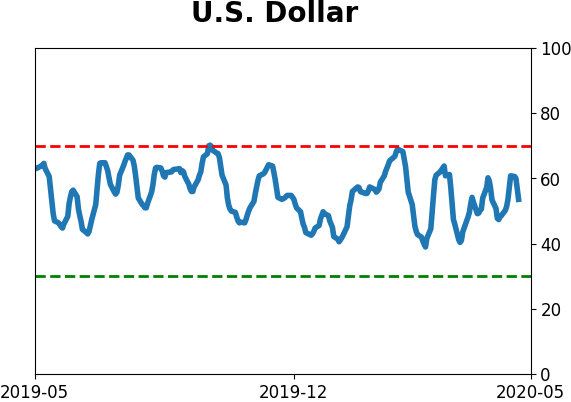
Currency ETF's - 5-Day Moving Average
|
|
|
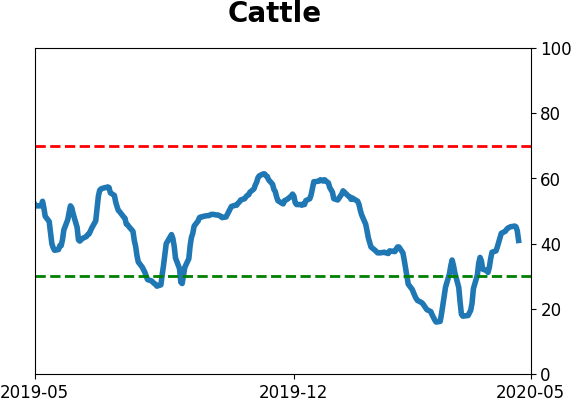
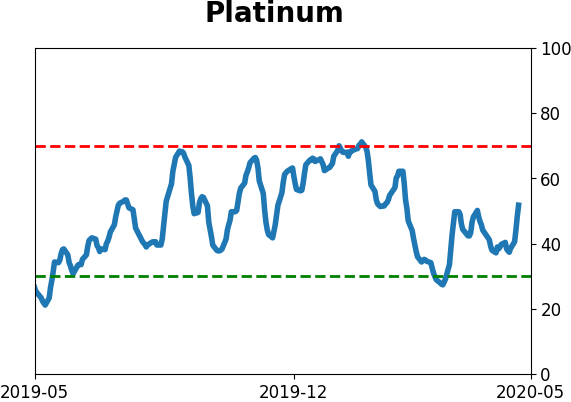
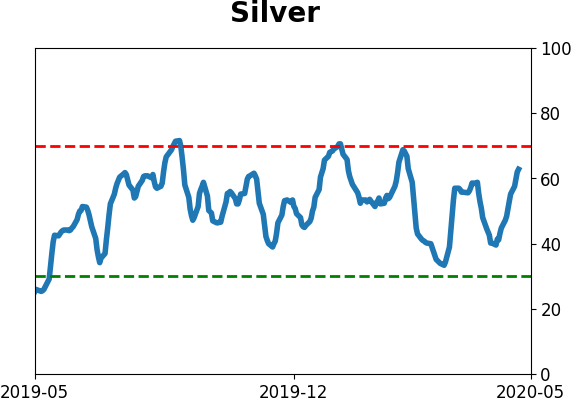
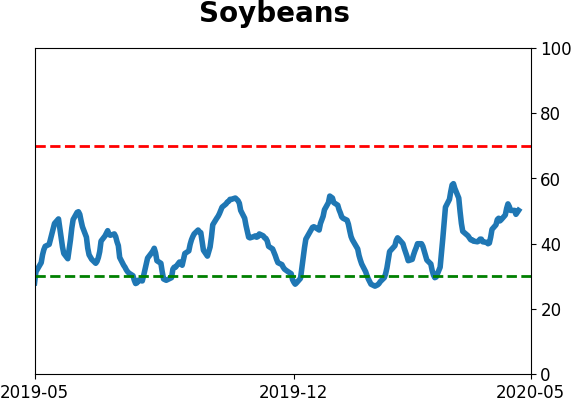
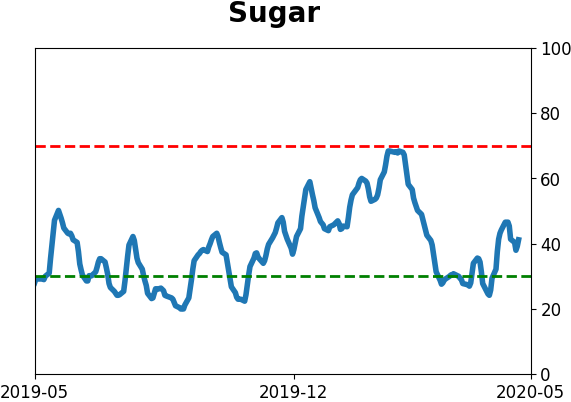
Commodity ETF's - 5-Day Moving Average
|
|