Headlines
|
|
Chinese tech stocks are doing exactly what they should:
Over the past 6 months, Chinese technology stocks have become one of the most hated sectors among all equities. Selling pressure reached washout levels and is now stabilizing, which has led to large gains.
Bottom Line:
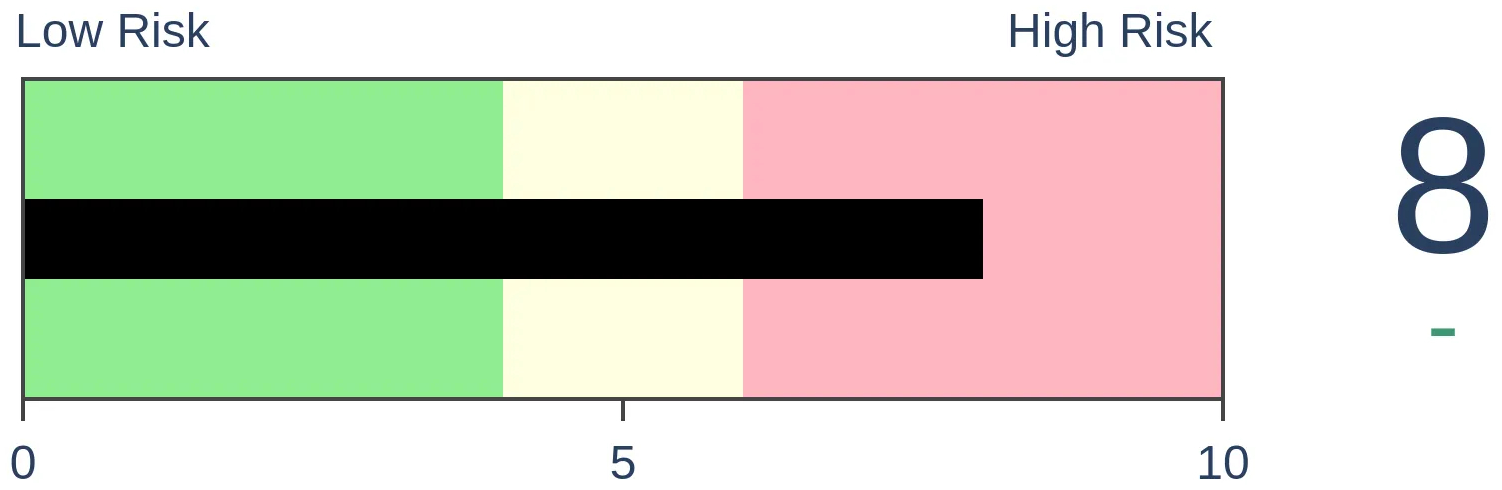
STOCKS: Hold By early October, sentiment had reset. Several important momentum streaks ended, which has brought in buyers in the past, and seasonality turned positive. We're now seeing signs that sentiment has quickly shifted, especially among options traders. It's gotten to an extreme that has preceded weaker-than-average returns.
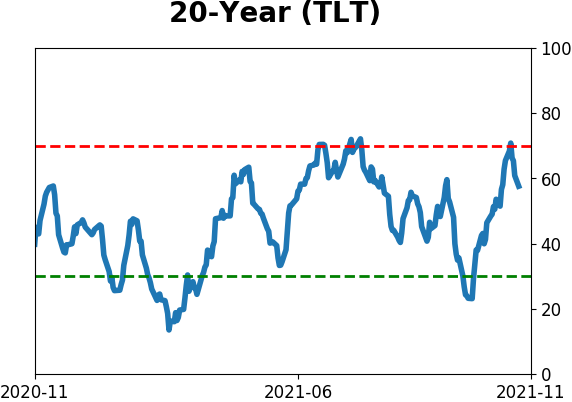
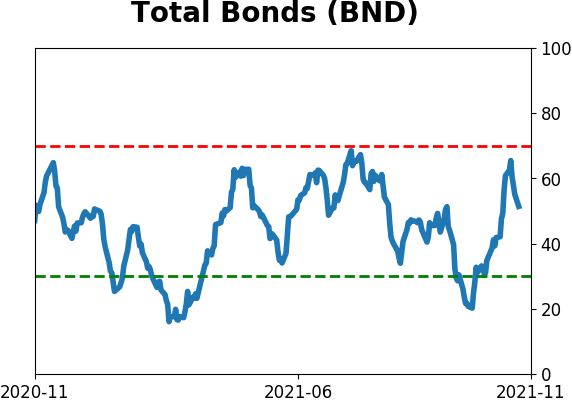
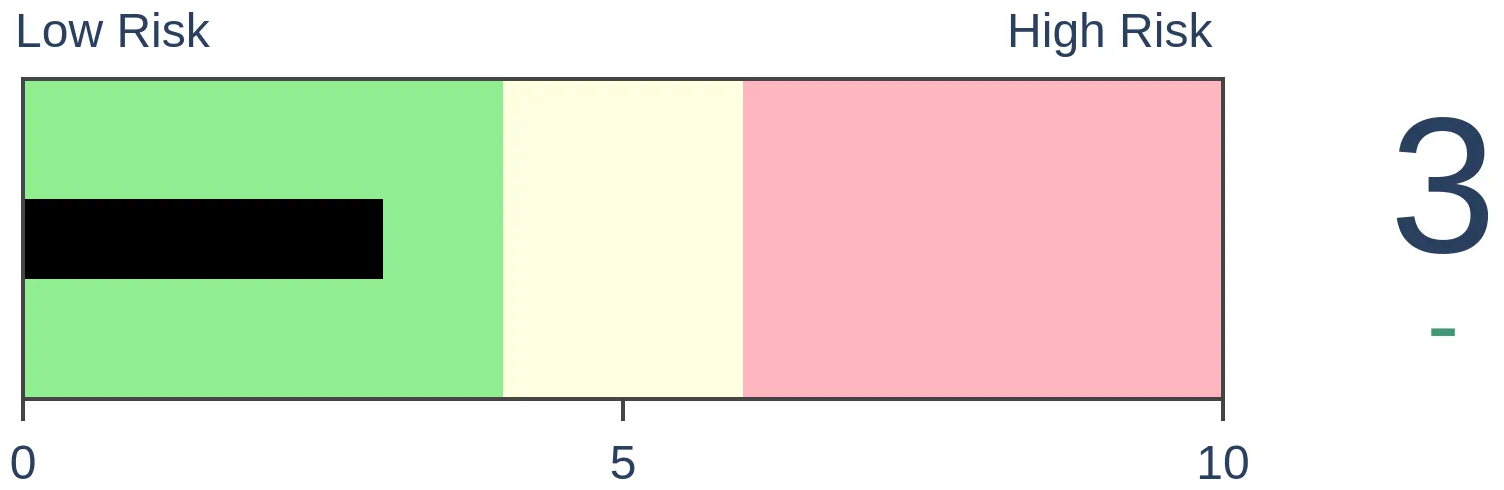
BONDS: Hold In late October, sentiment on bonds - from Treasuries to corporates - entered pessimistic territory. It's now starting to recover, with some quick moves in corporate bonds. We'll see if those bonds, in particular, can hold recent gains.
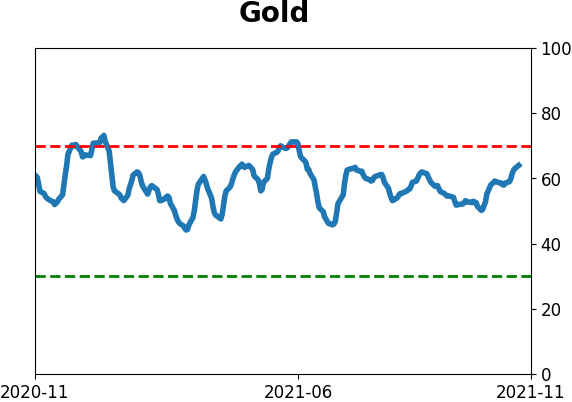
GOLD: Hold
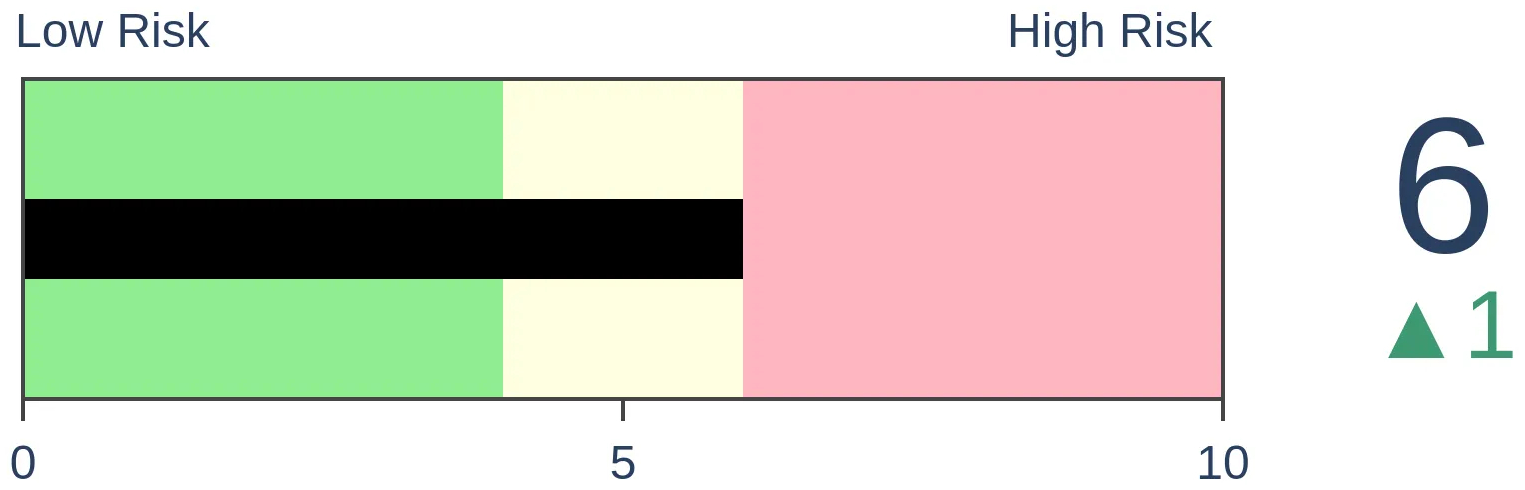
Gold and miners were rejected after trying to recover above their 200-day averages in May. Some oversold extremes in breadth measures among miners triggered in late September, and they've recovered a bit since then. The group still has some proving to do.
|
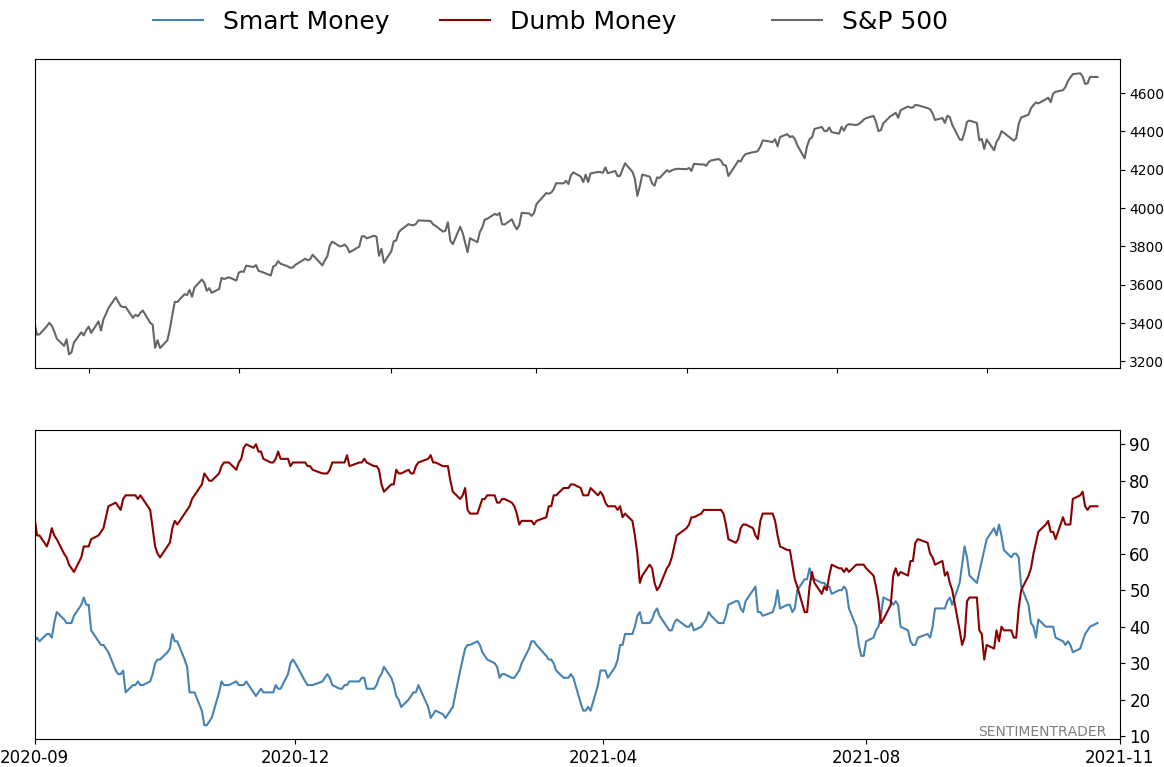
Smart / Dumb Money Confidence
|
Smart Money Confidence: 41%
Dumb Money Confidence: 73%
|
|
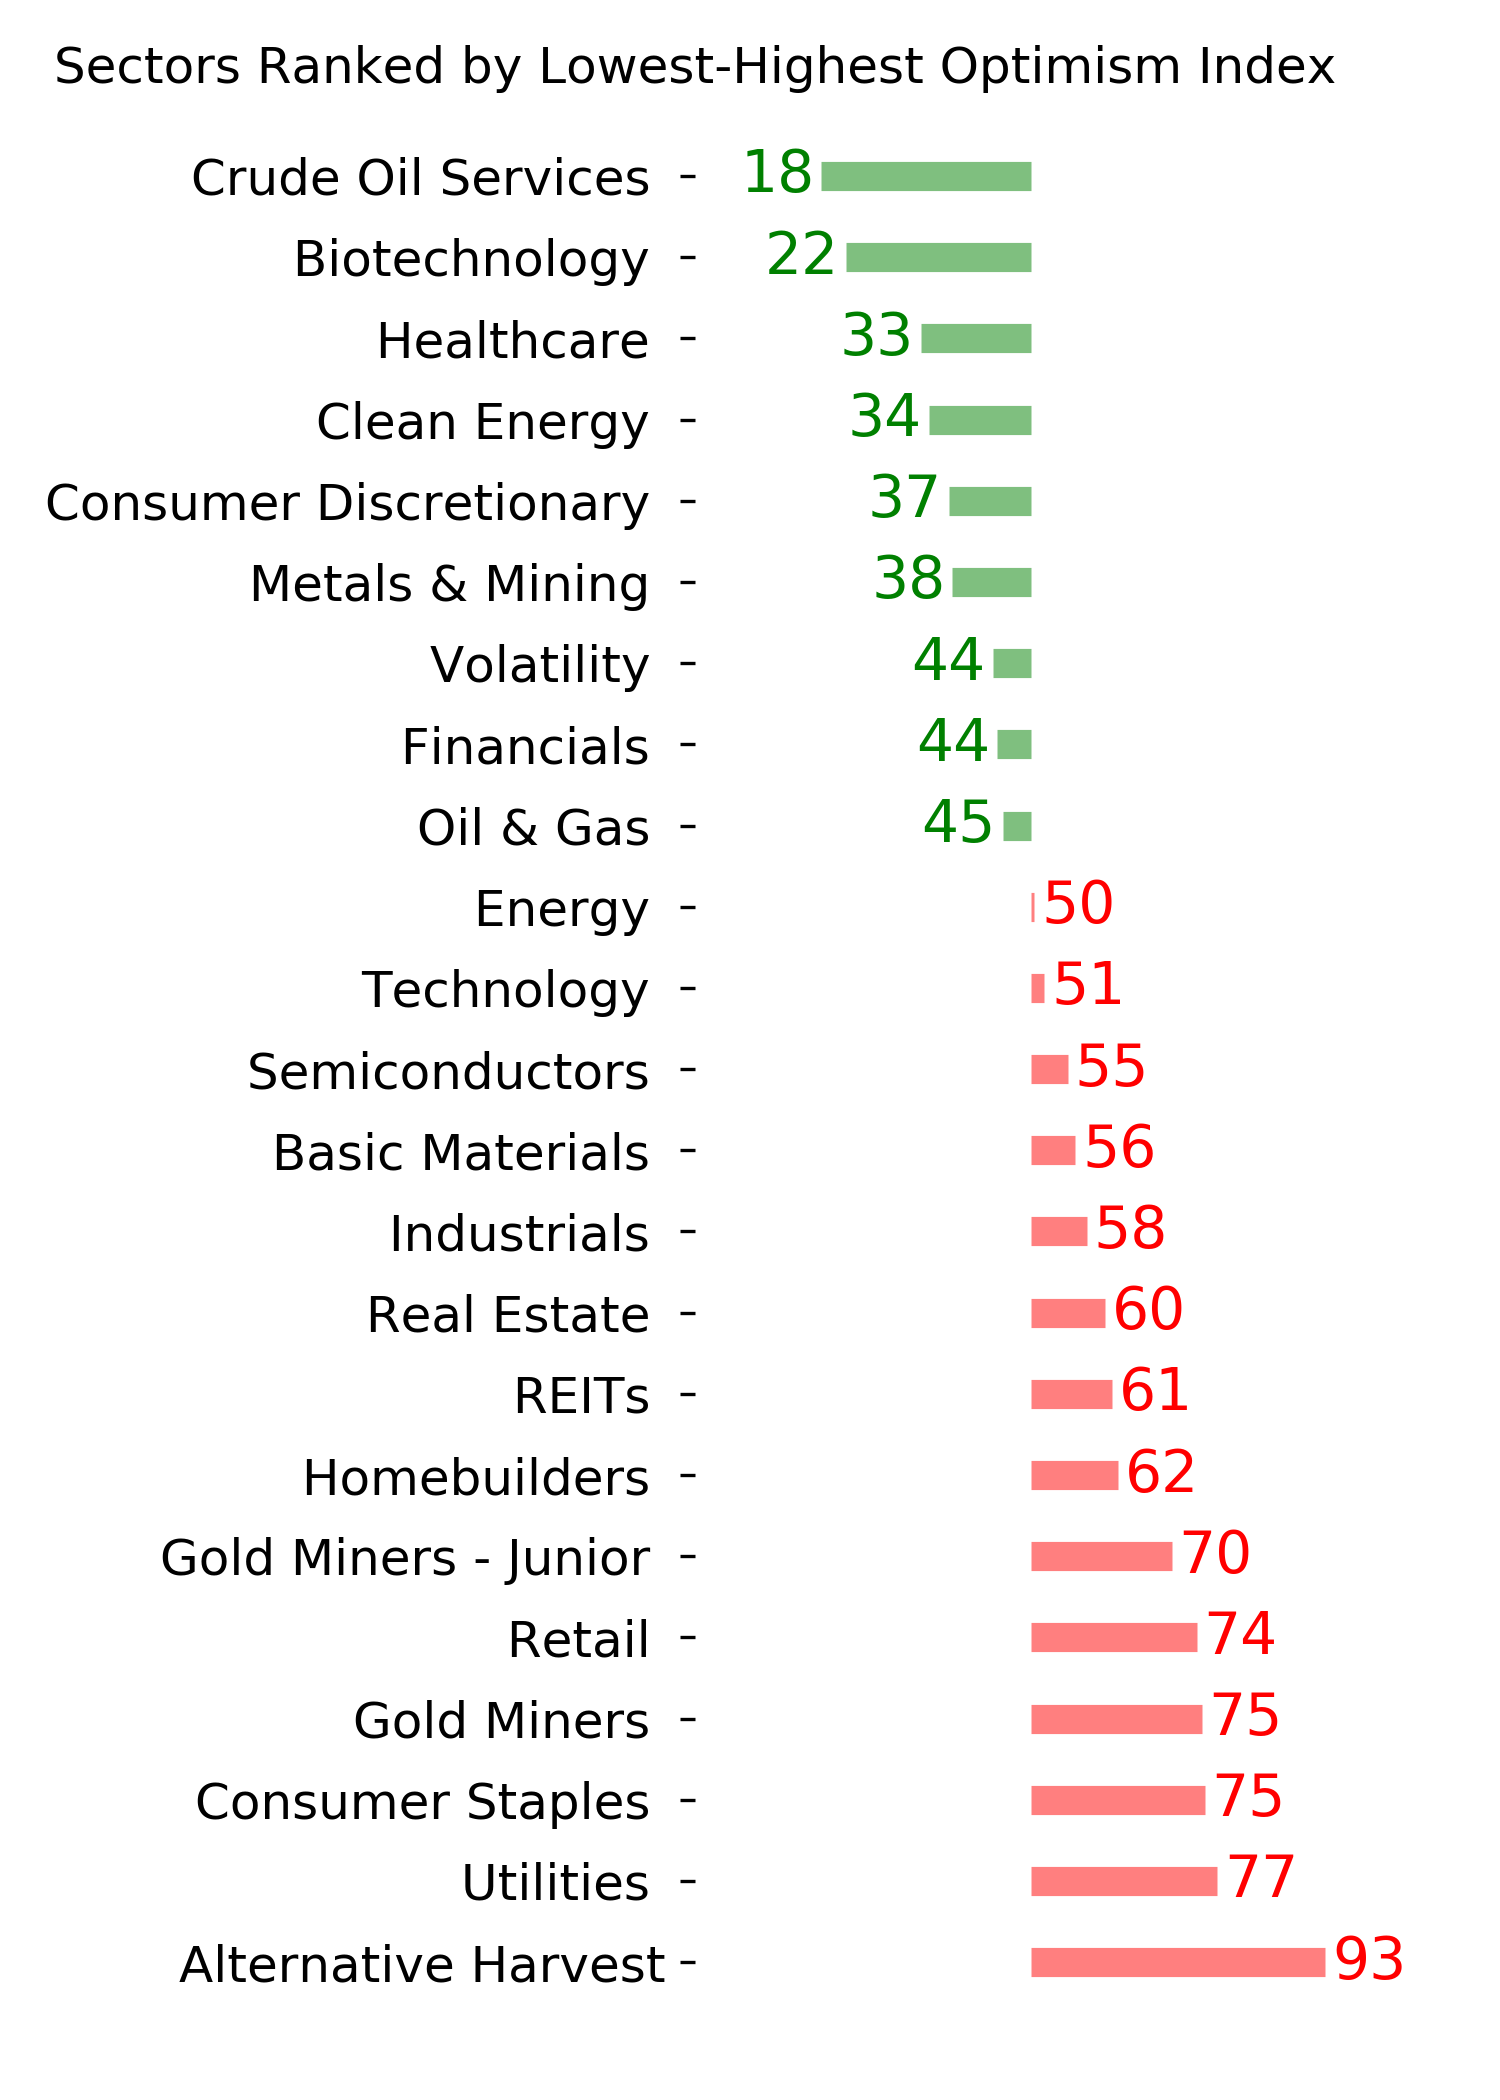
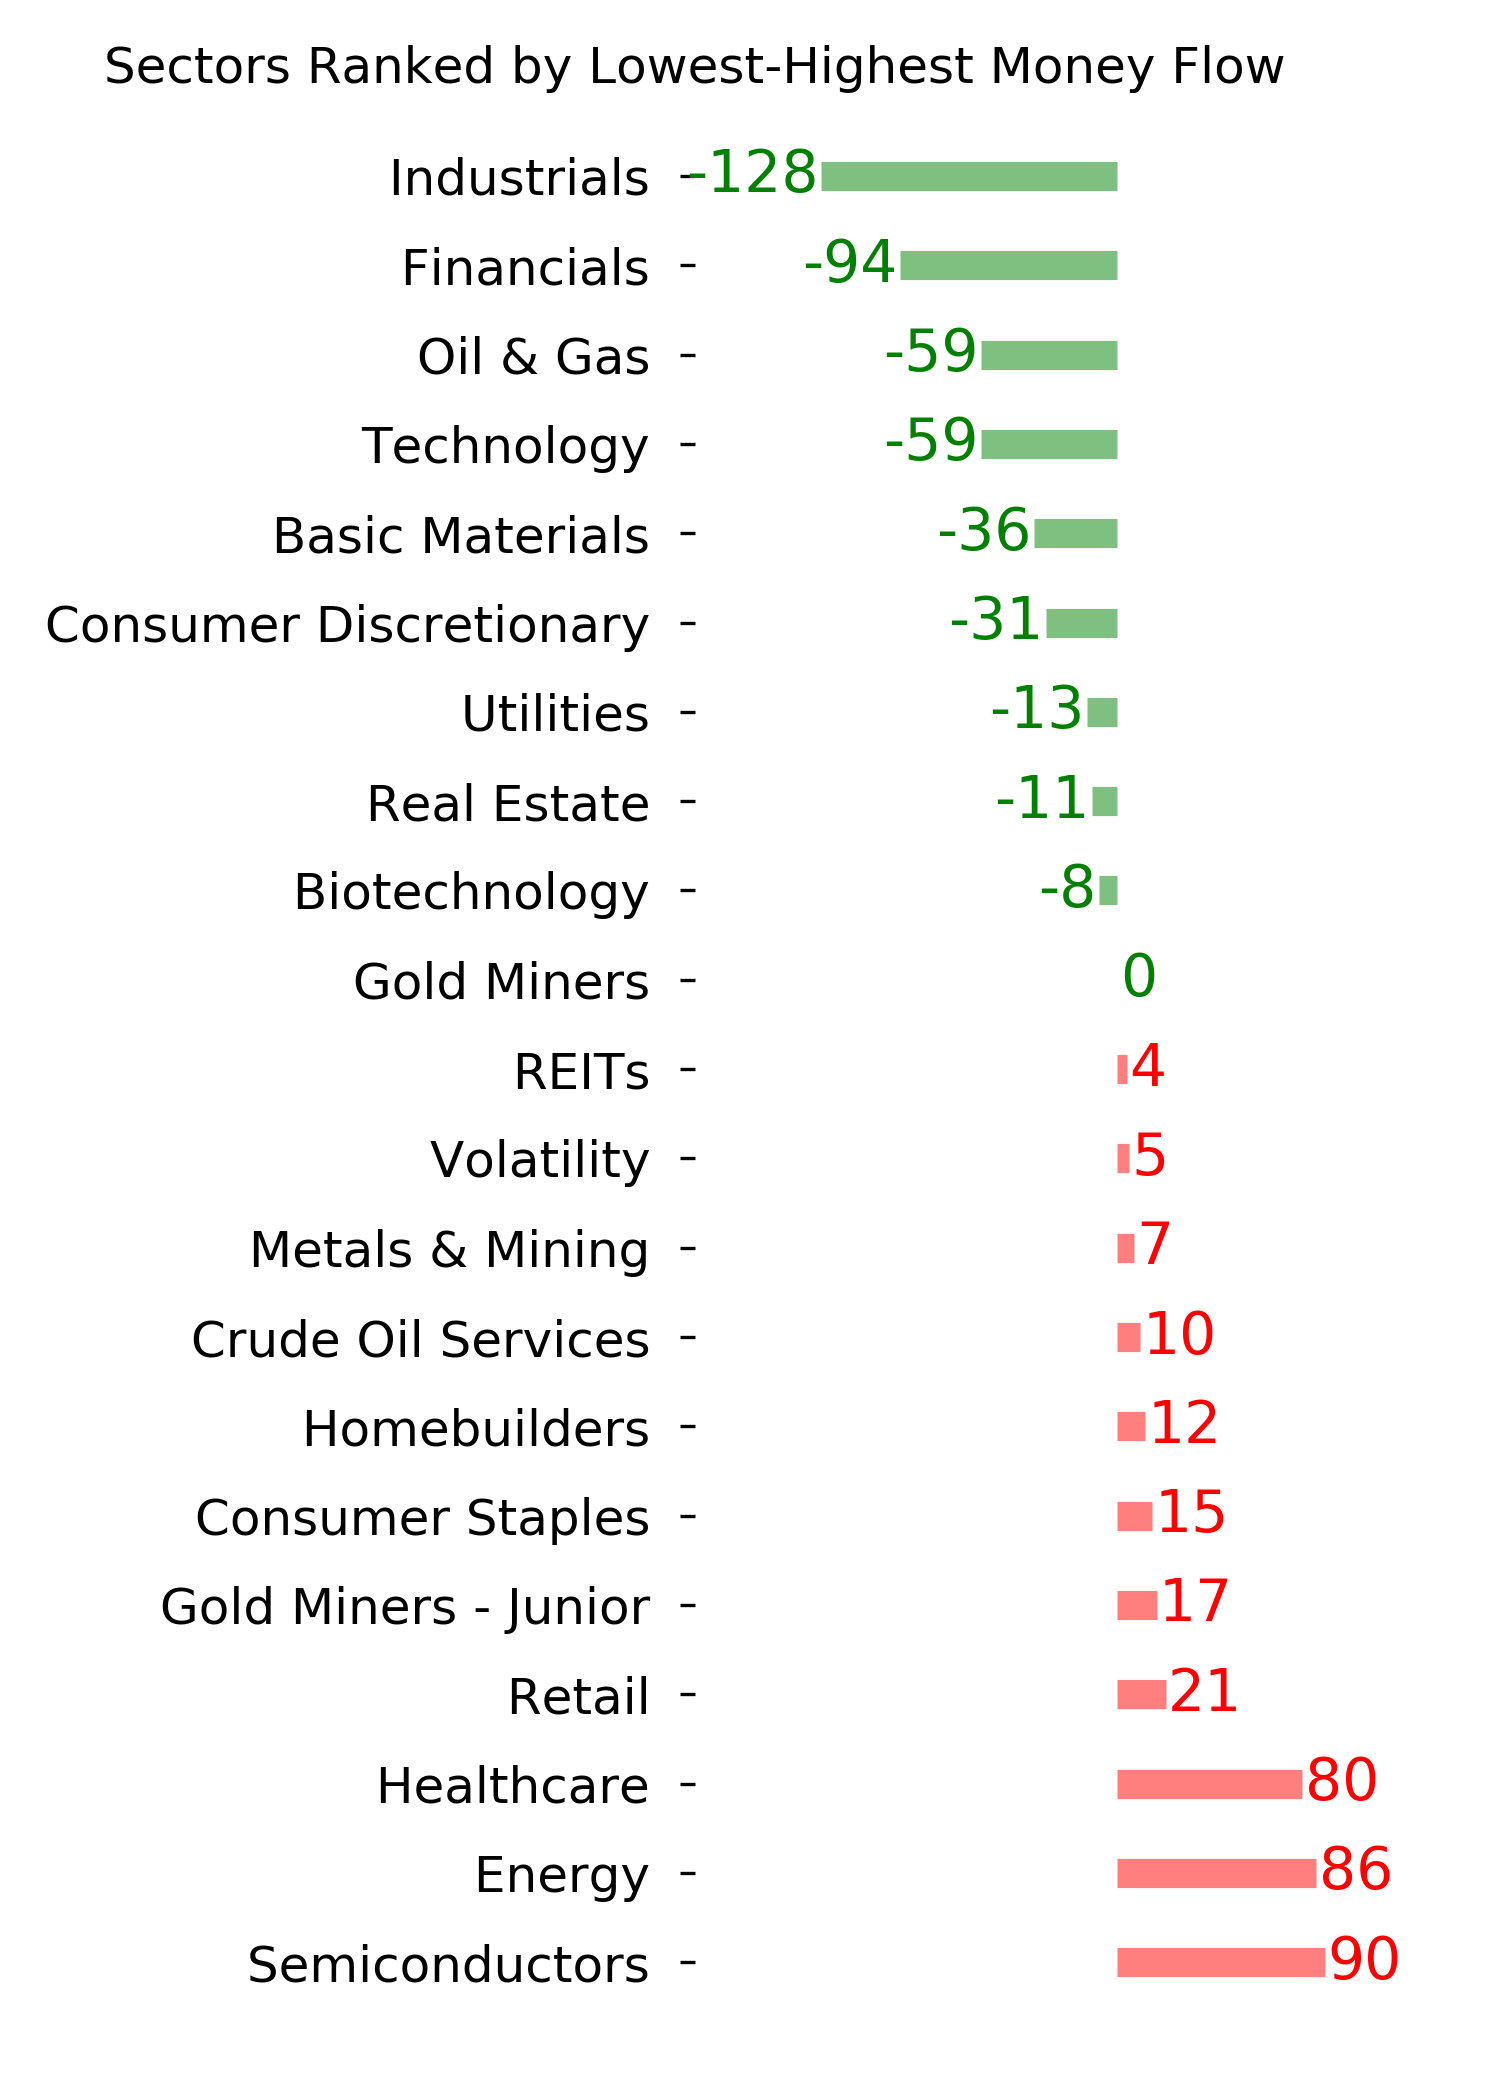
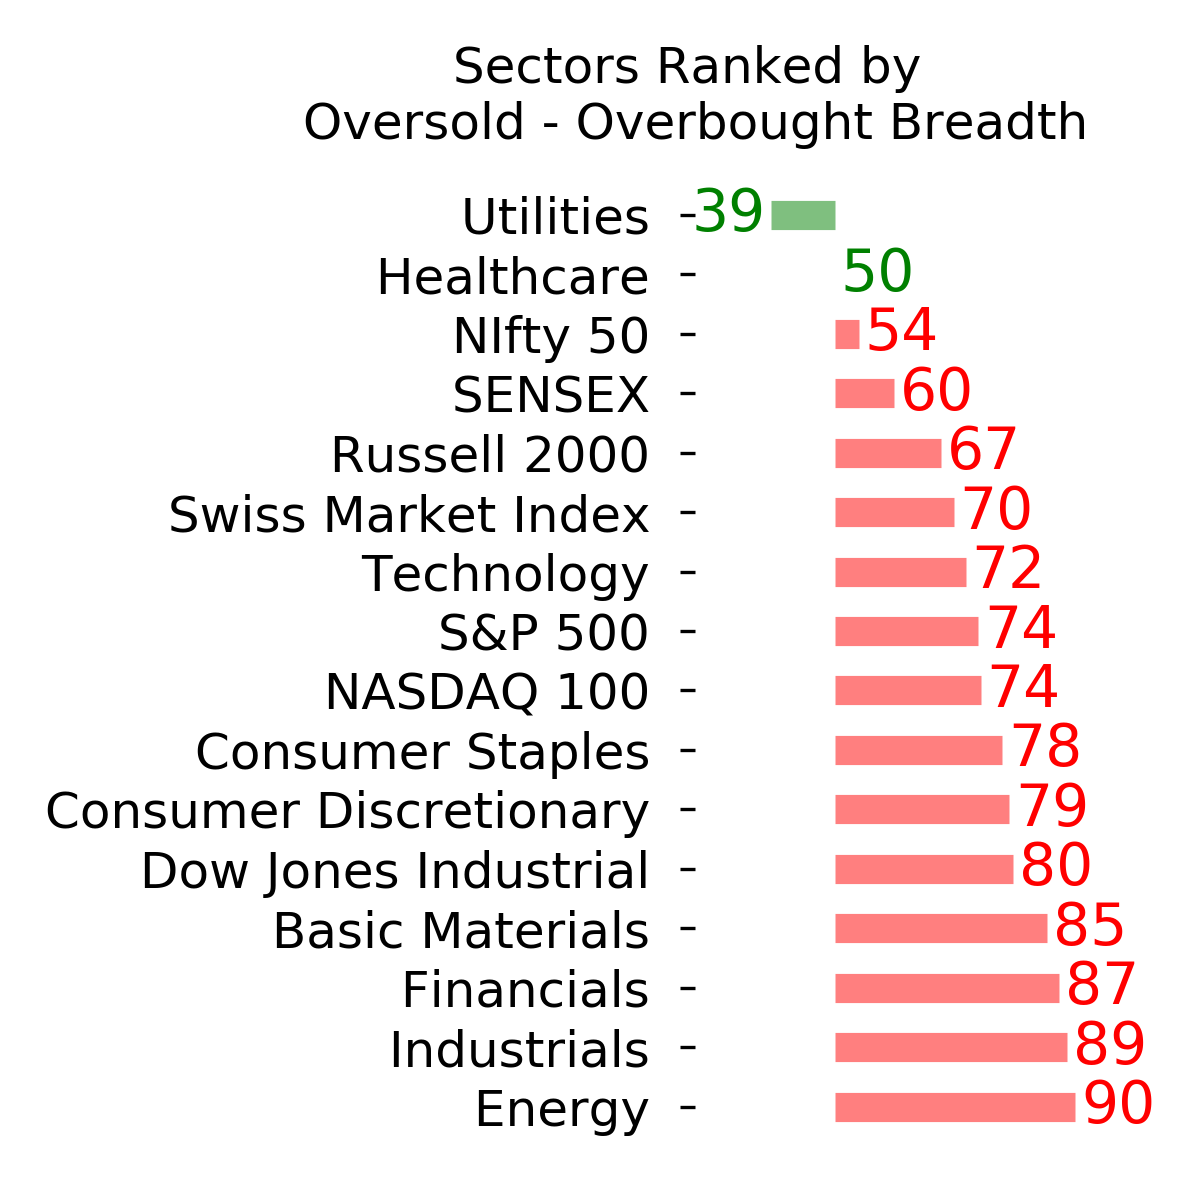
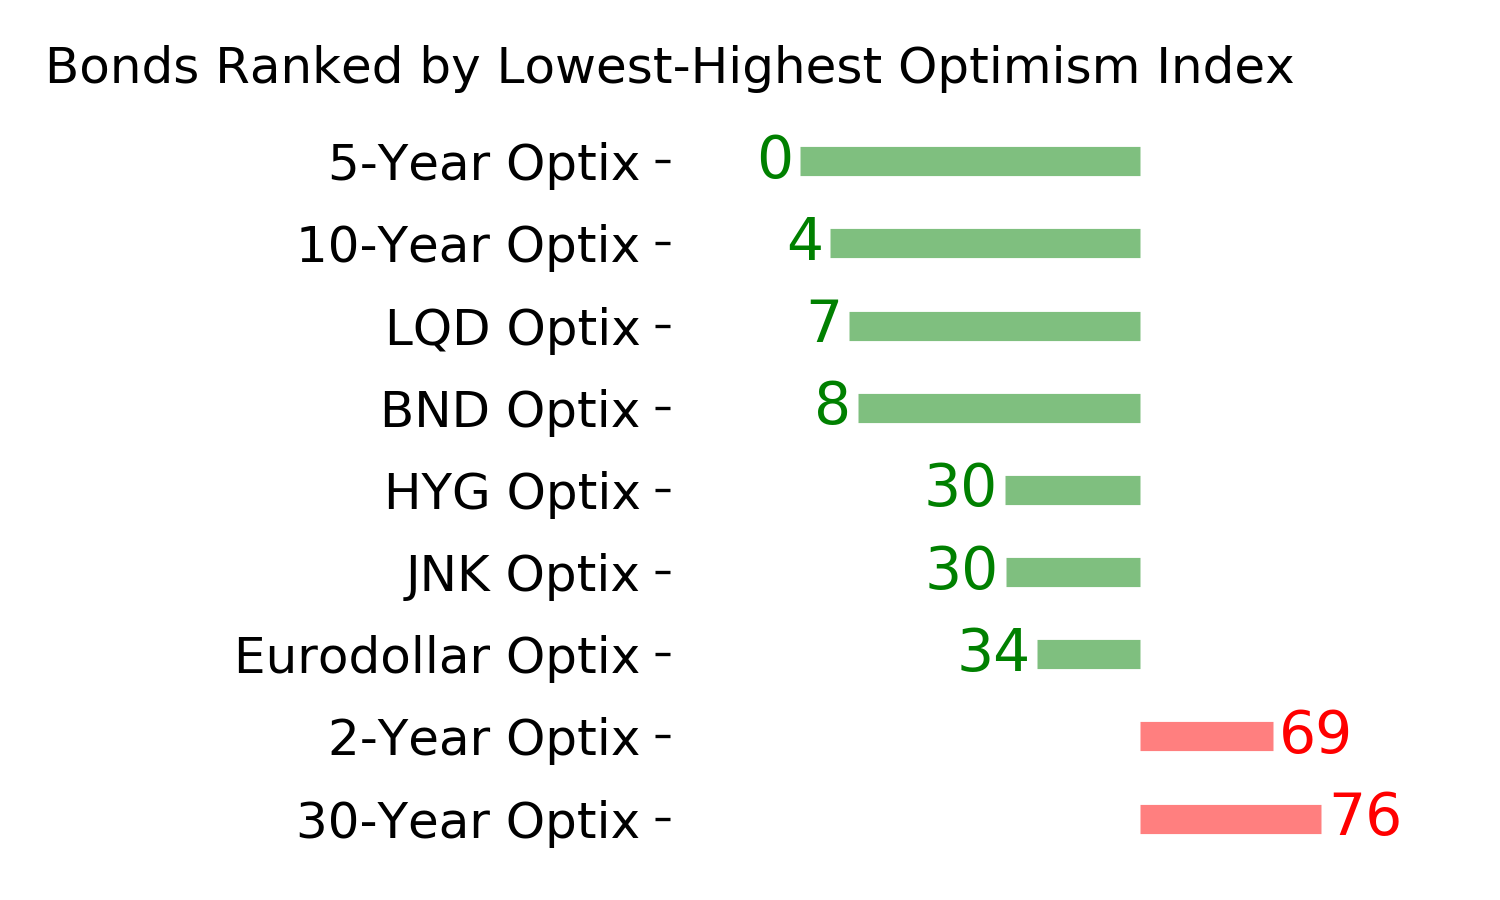
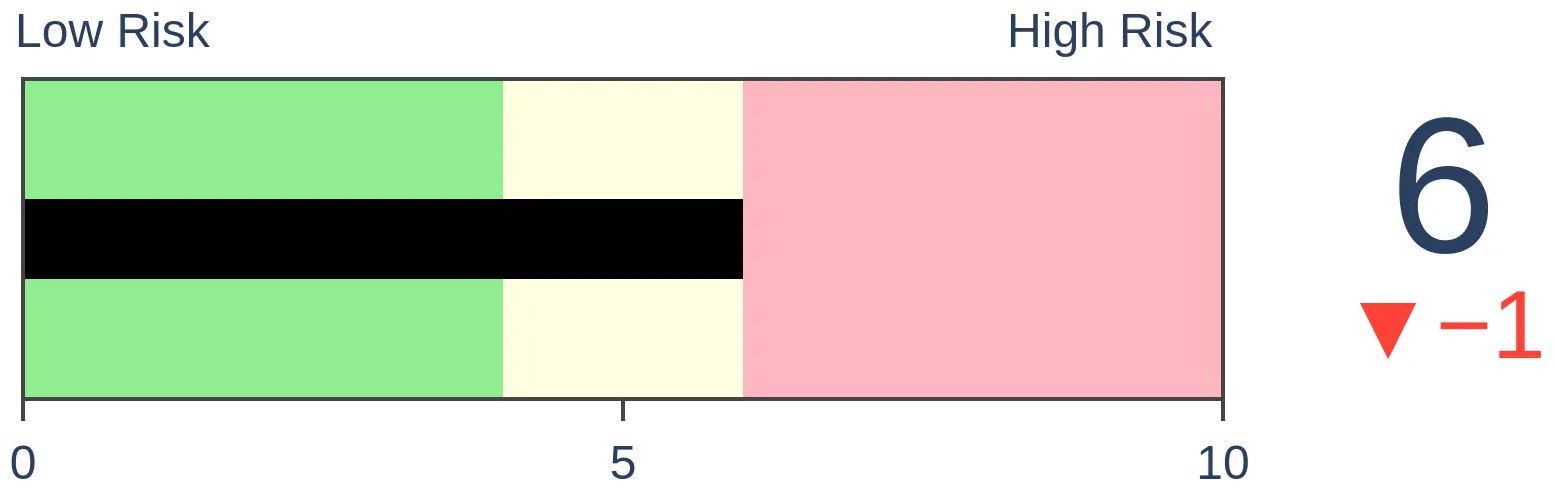
Risk Levels
Stocks Short-Term
|
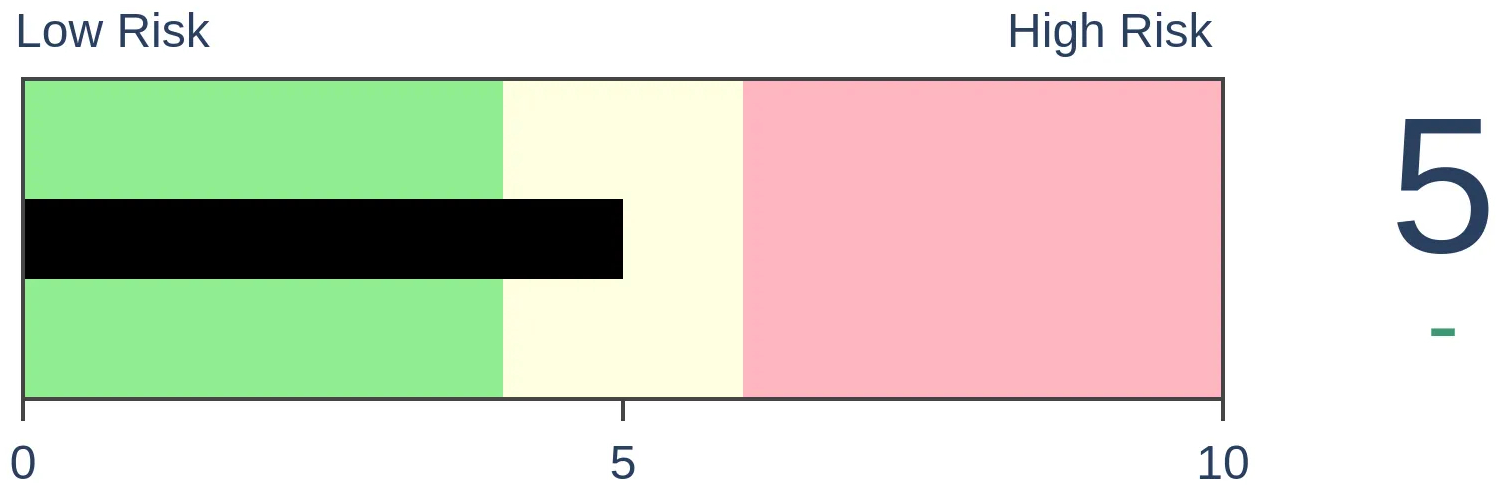
Stocks Medium-Term
|
|
Bonds
|
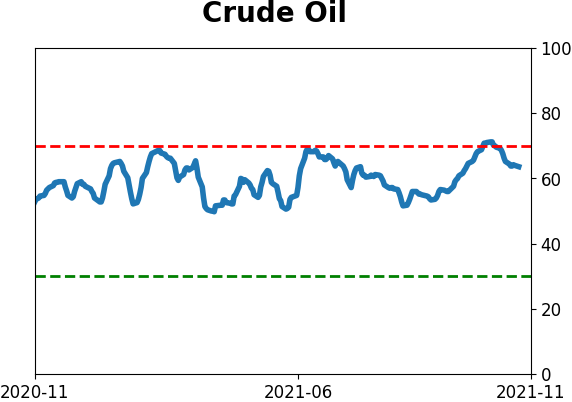
Crude Oil
|
|
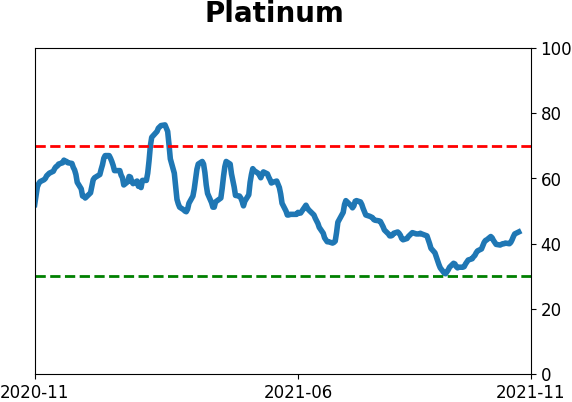
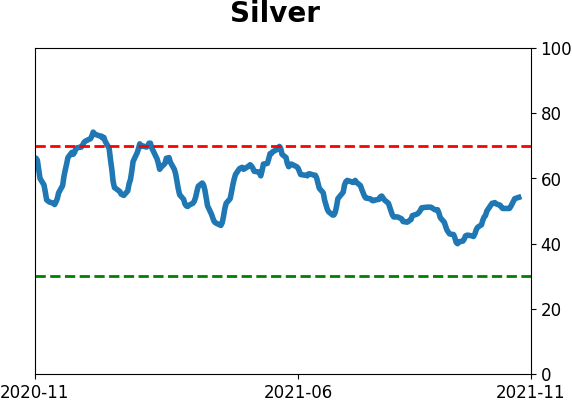
Gold
|
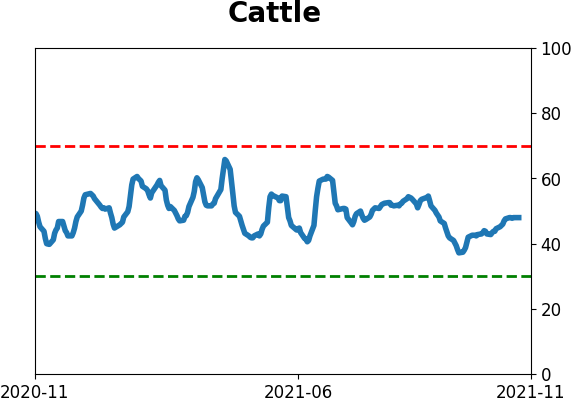
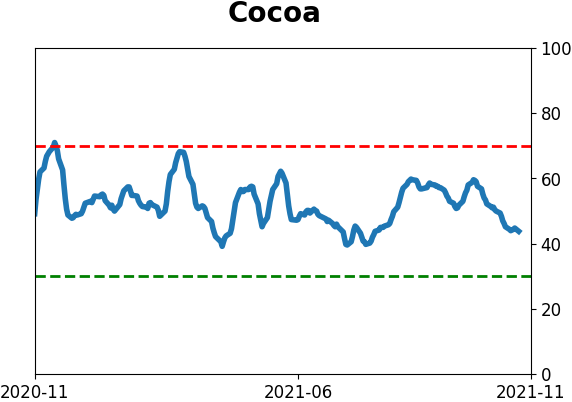
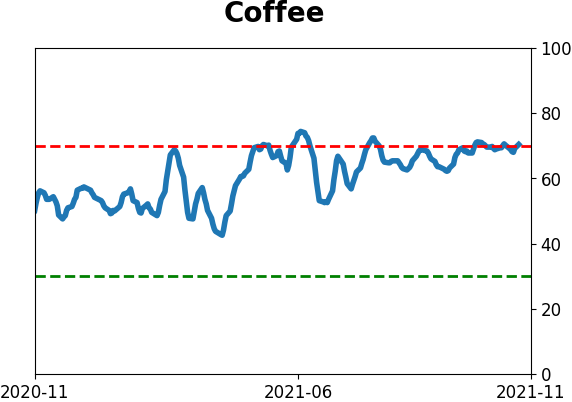
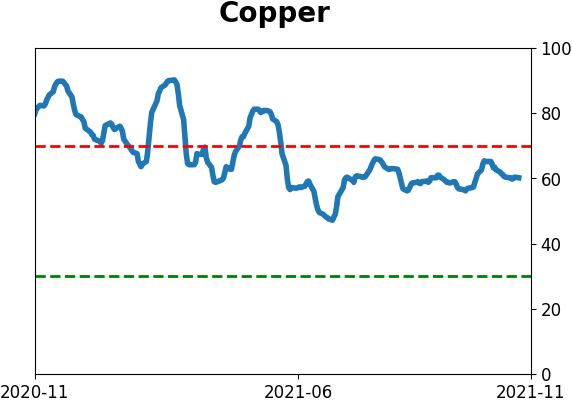
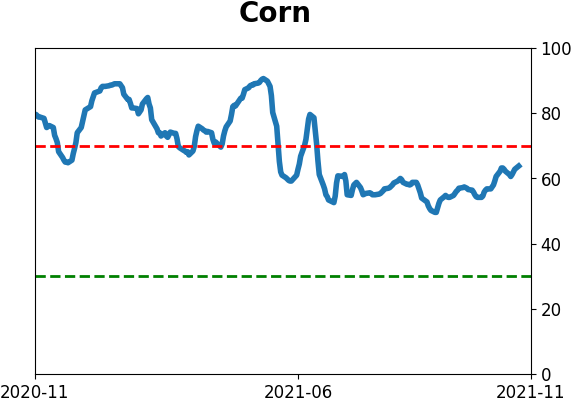
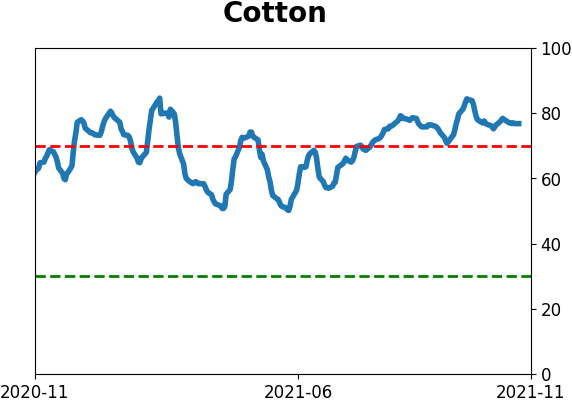
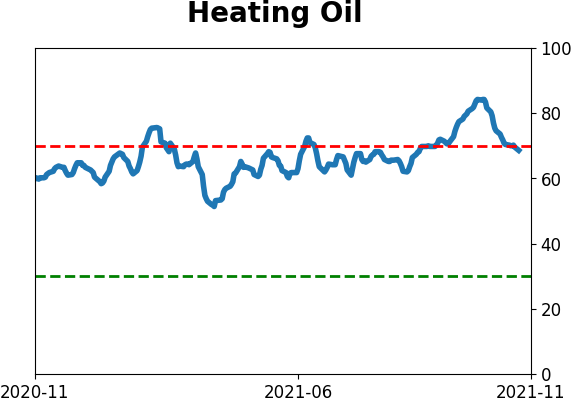
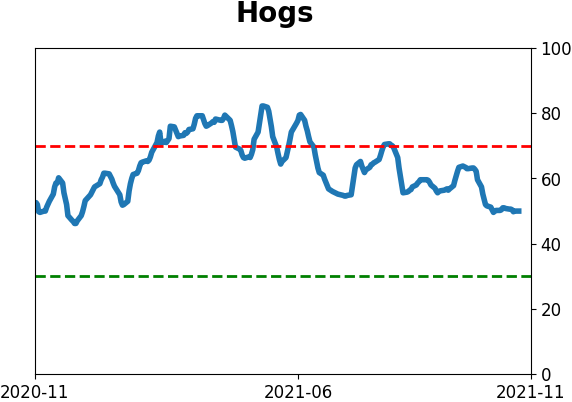
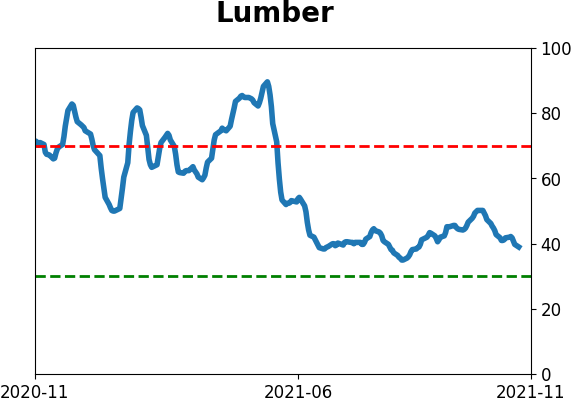
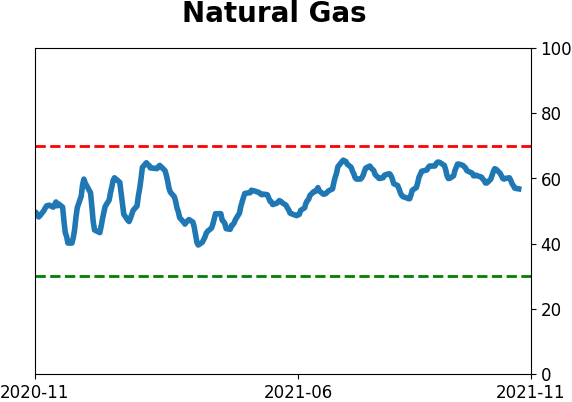
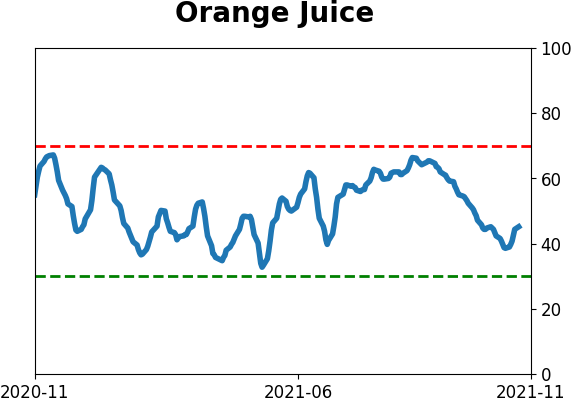
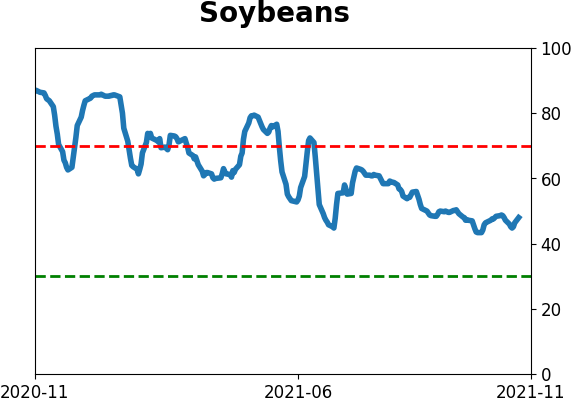
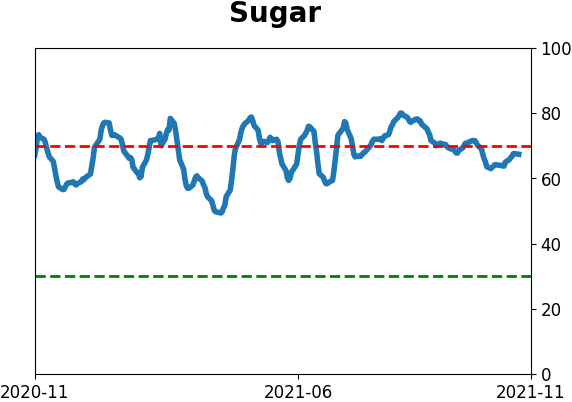
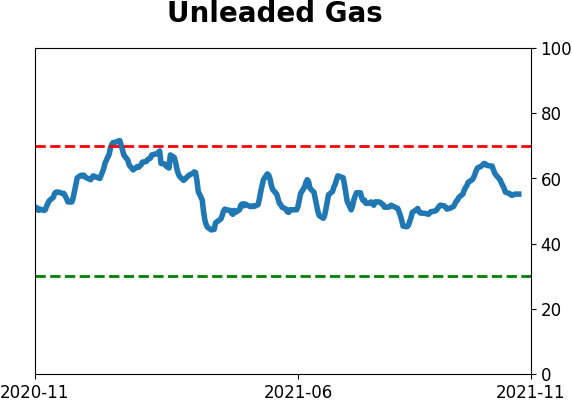
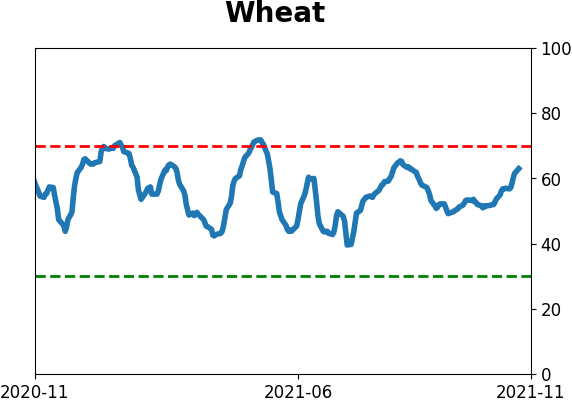
Agriculture
|
|
Research
By Jason Goepfert
BOTTOM LINE
Over the past 6 months, Chinese technology stocks have become one of the most hated sectors among all equities. Selling pressure reached washout levels and is now stabilizing, which has led to large gains.
FORECAST / TIMEFRAME
KWEB -- Up, Long-Term
|
Key points:
- The slump in Chinese technology stocks equates with other major panics
- Their price path in recent weeks has roughly followed the 2008 and 2011 bottoms
- Similar behavior led to the sector doubling over the next 1-2 years
The most hated sector is doing what it's supposed to
Chinese technology stocks have gone nowhere. And that's precisely what they should be doing.
In September, we looked at the selling cascade in these shares. There was perhaps no corner of the equity market that was more hated or washed-out.
So far, they've done exactly what they're supposed to do by doing nothing at all. Many of them are trading right around the same prices they were a couple of months ago...just like most other significant bottoms.
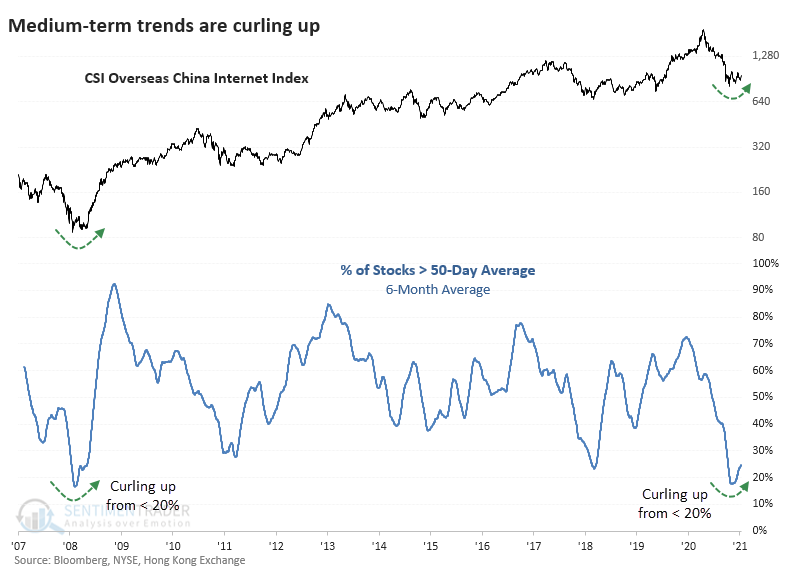
In September, we took a shorter-term view of several breadth metrics that showed the disaster within stocks in the CSO Overseas China Internet Index, upon which the popular KWEB fund is based. Now we can see that over the past 6 months, the selling pressure has been on par with one of the largest financial disasters of all time.
Over the past 6 months, selling pressure has been historically bad
On an average day over the past six months, fewer than 20% of stocks in that China internet index were trading above their 50-day moving averages. That has now started to curl higher as some of them have recovered. This same thing happened as the world emerged from the Global Financial Crisis.
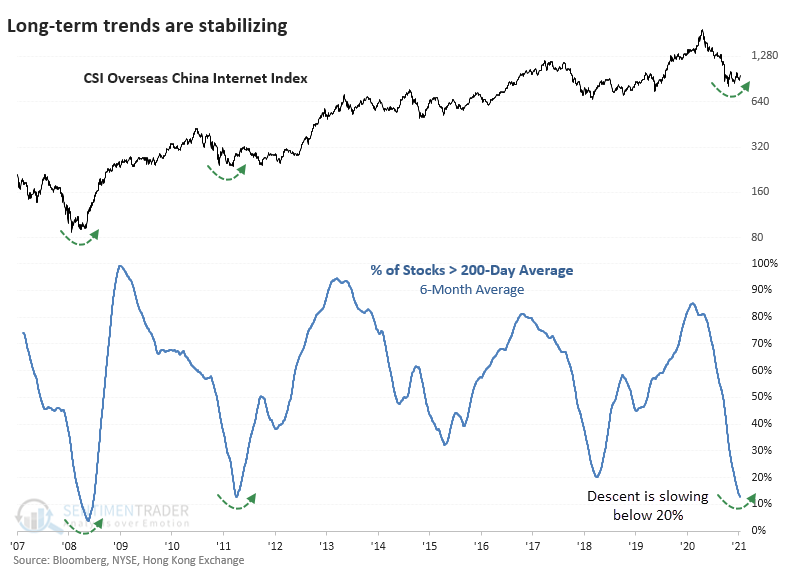
On a longer-term basis, fewer than 15% of the stocks have held above their 200-day moving averages. This average is just now halting its decline and starting to trough, as happened in 2008 and 2011.
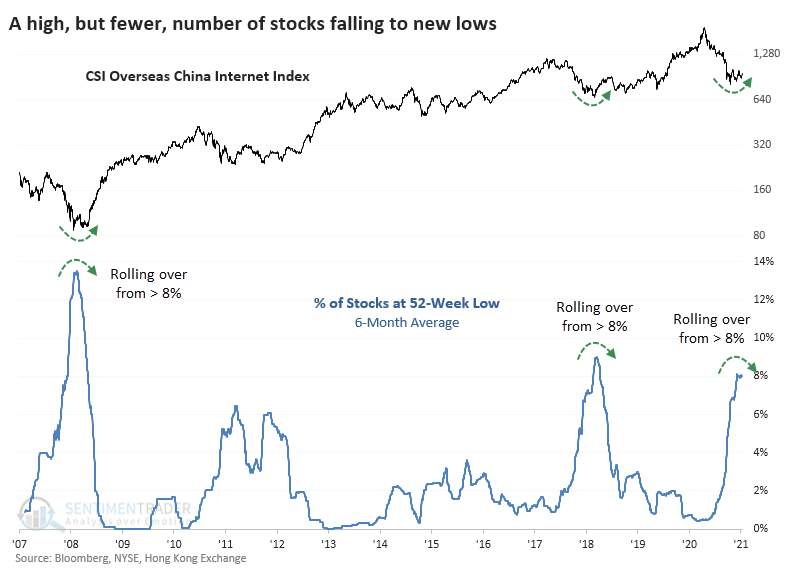
The percentage of stocks falling to a 52-week low never quite matched the extreme in 2008, or even 2018 for that matter. But now it's starting to peak, as it did at those other long-term bottoms.
Chinese tech doubled after other reversals
When we combined a number of these metrics into a single Composite, it's now rolling over from the 2nd-highest reading in 15 years. After each of the other reversals from similar extremes, the internet index doubled (or nearly so) within 2 years.
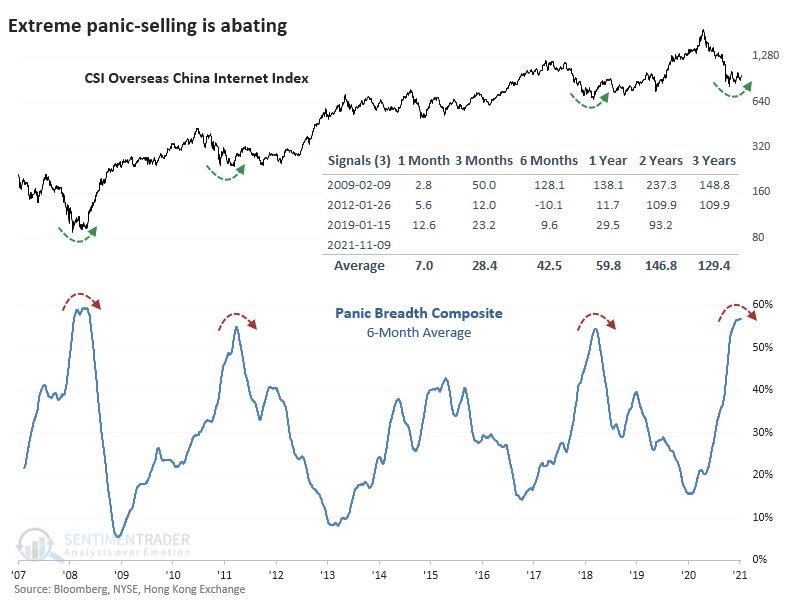
In September, we looked at the path the index took after the only times when more than half of the stocks fell to a 52-week low at the same time. If it followed a similar path this time, then we could have reasonably expected the index to chop around for another 1-3 months, which it has done. The important part was that it shouldn't make an appreciably lower low, which it hasn't.
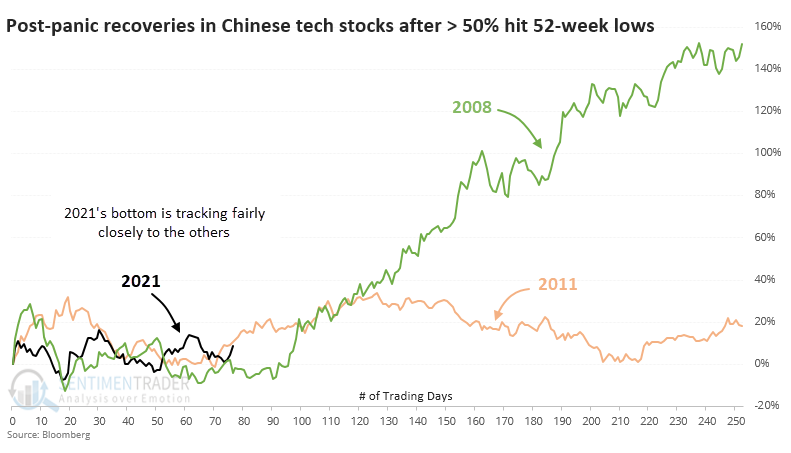
After the 2008 plunge, the index formed its ultimate bottom within the next couple of weeks. After the 2011 crisis, it had already bottomed and was on a sustained track higher.
What the research tells us...
The selling pressure in Chinese technology stocks in July and August reached historic proportions. Since then, the sector has chopped around, with long-term breadth metrics on par with several major lows over the past 15 years. They have roughly followed the path after other major panic bottoms, suggesting rising prices over the next 1-2 years.
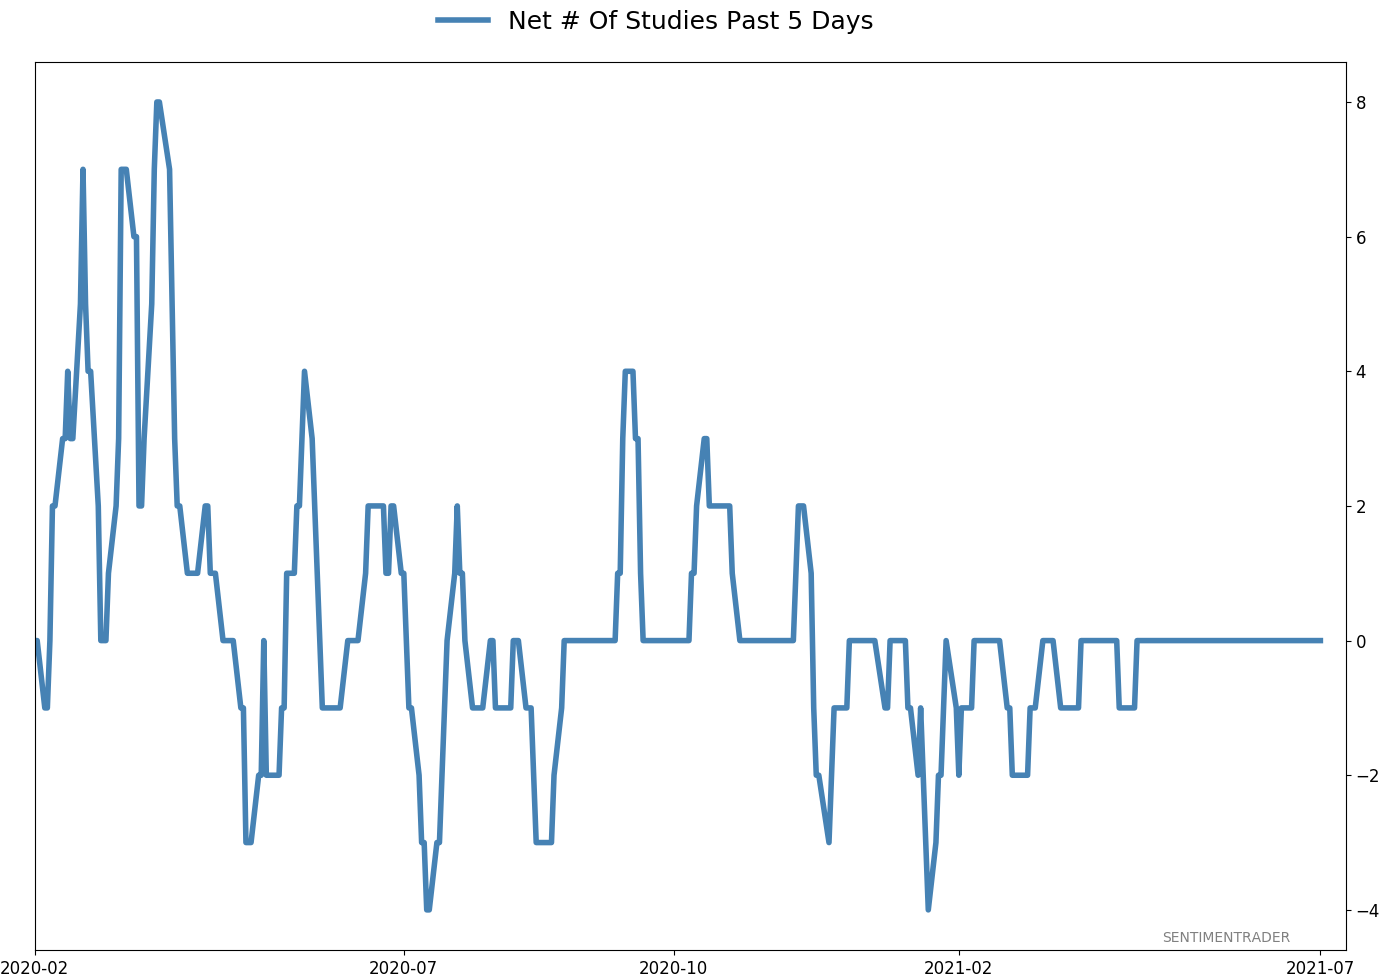
Active Studies
| Time Frame | Bullish | Bearish | | Short-Term | 2 | 0 | | Medium-Term | 11 | 0 | | Long-Term | 12 | 5 |
|
Indicators at Extremes
Portfolio
| Position | Description | Weight % | Added / Reduced | Date | | Stocks | RSP | 10.7 | Added 6.4% | 2021-10-01 | | Bonds | 32.7% BND, 7.1% SCHP | 39.8 | Added 8.3% | 2021-10-26 | | Commodities | GCC | 2.4 | Reduced 2.1%
| 2020-09-04 | | Precious Metals | GDX | 4.6 | Reduced 4.2% | 2021-05-19 | | Special Situations | 9.8% KWEB, 4.7% XLE, 2.9% PSCE | 17.3 | Added 9.78% | 2021-10-01 | | Cash | | 24.1 | | |
|
Updates (Changes made today are underlined)
Much of our momentum and trend work has remained positive for several months, with some scattered exceptions. Almost all sentiment-related work has shown a poor risk/reward ratio for stocks, especially as speculation drove to record highs in exuberance in February. Much of that has worn off, and most of our models are back toward neutral levels. There isn't much to be excited about here. The same goes for bonds and even gold. Gold has been performing well lately and is back above long-term trend lines. The issue is that it has a poor record of holding onto gains when attempting a long-term trend change like this, so we'll take a wait-and-see approach. Momentum has ebbed quickly in recent weeks, and nearing oversold levels in some indicators. This can be a dangerous area, with a lot of short-term volatility, but we'd be more inclined to add medium- to long-term exposure rather than sell on much more of a decline, thanks to already rock-bottom exposure. Other areas look more attractive, including some overseas markets. RETURN YTD: 12.0% 2020: 8.1%, 2019: 12.6%, 2018: 0.6%, 2017: 3.8%, 2016: 17.1%, 2015: 9.2%, 2014: 14.5%, 2013: 2.2%, 2012: 10.8%, 2011: 16.5%, 2010: 15.3%, 2009: 23.9%, 2008: 16.2%, 2007: 7.8%
|
|
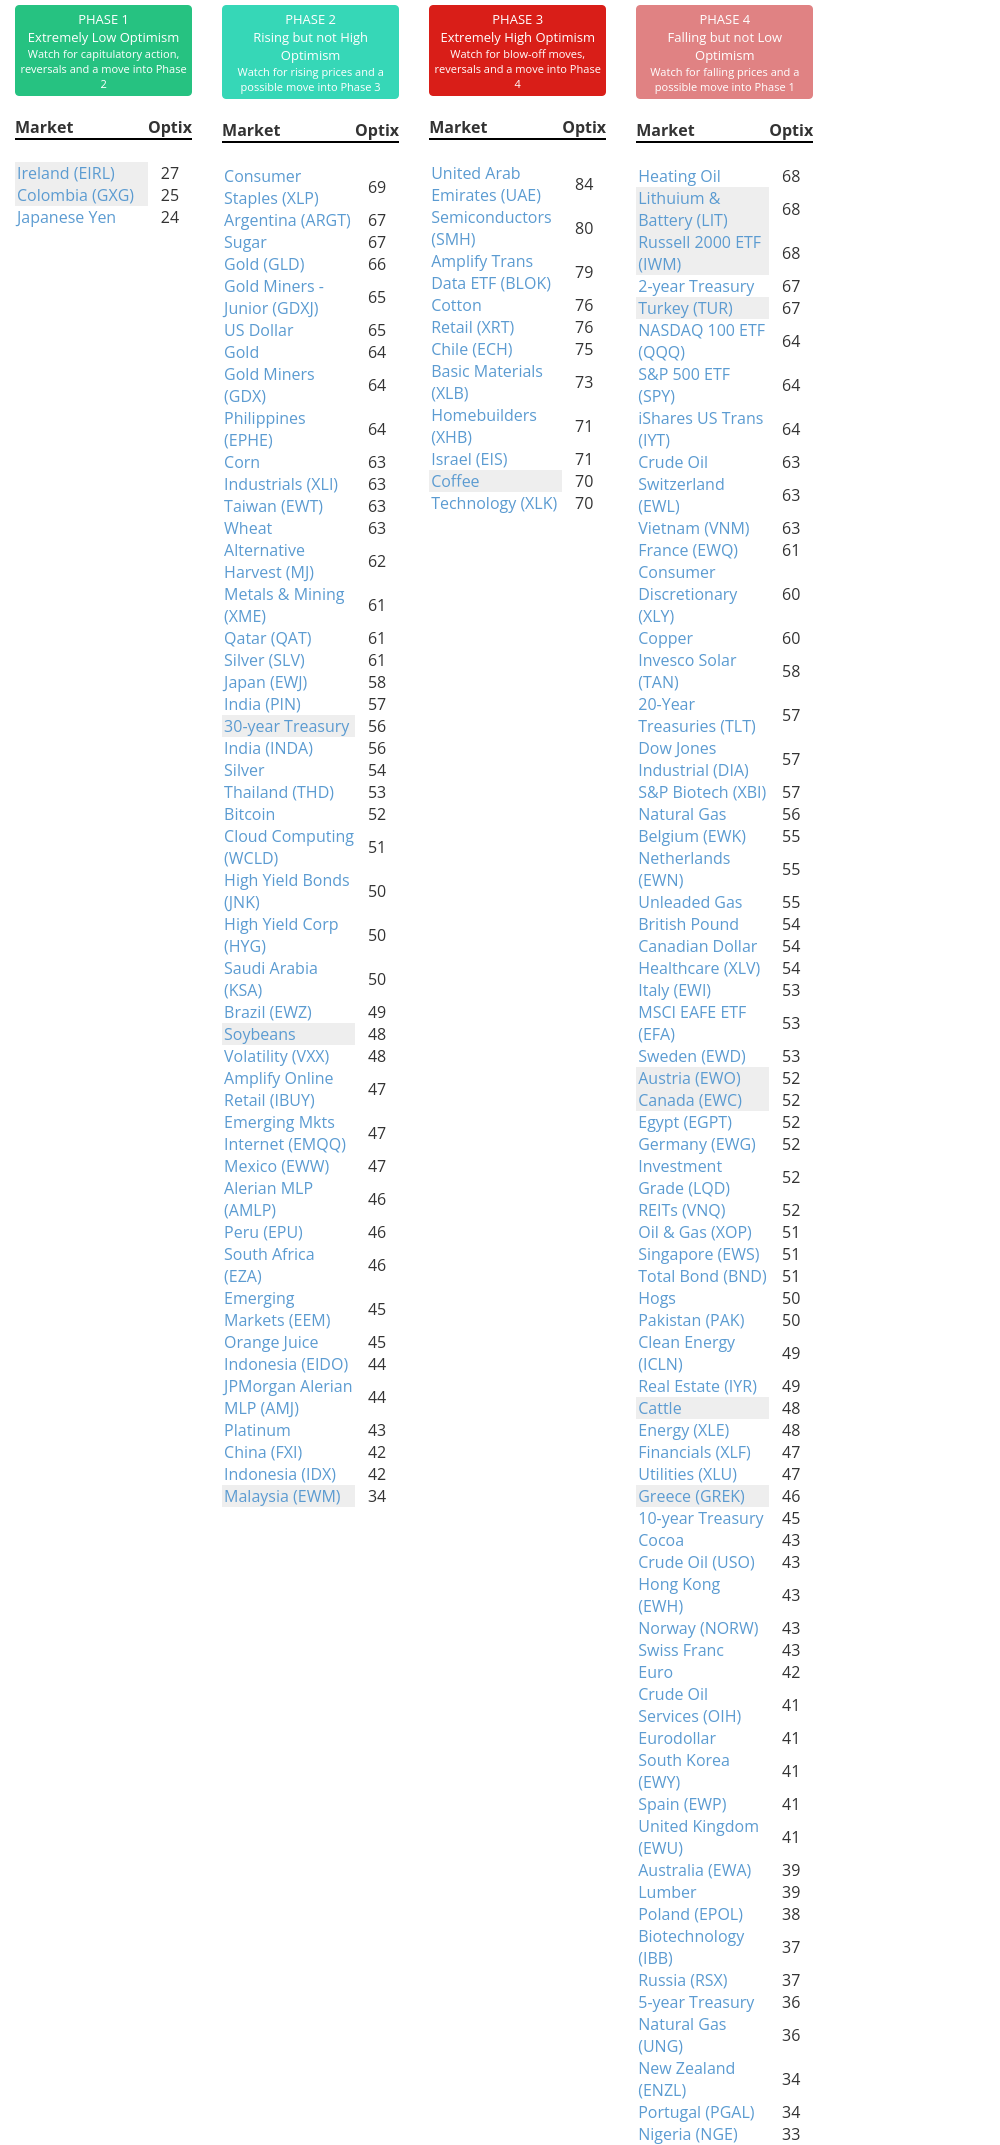
Phase Table
Ranks
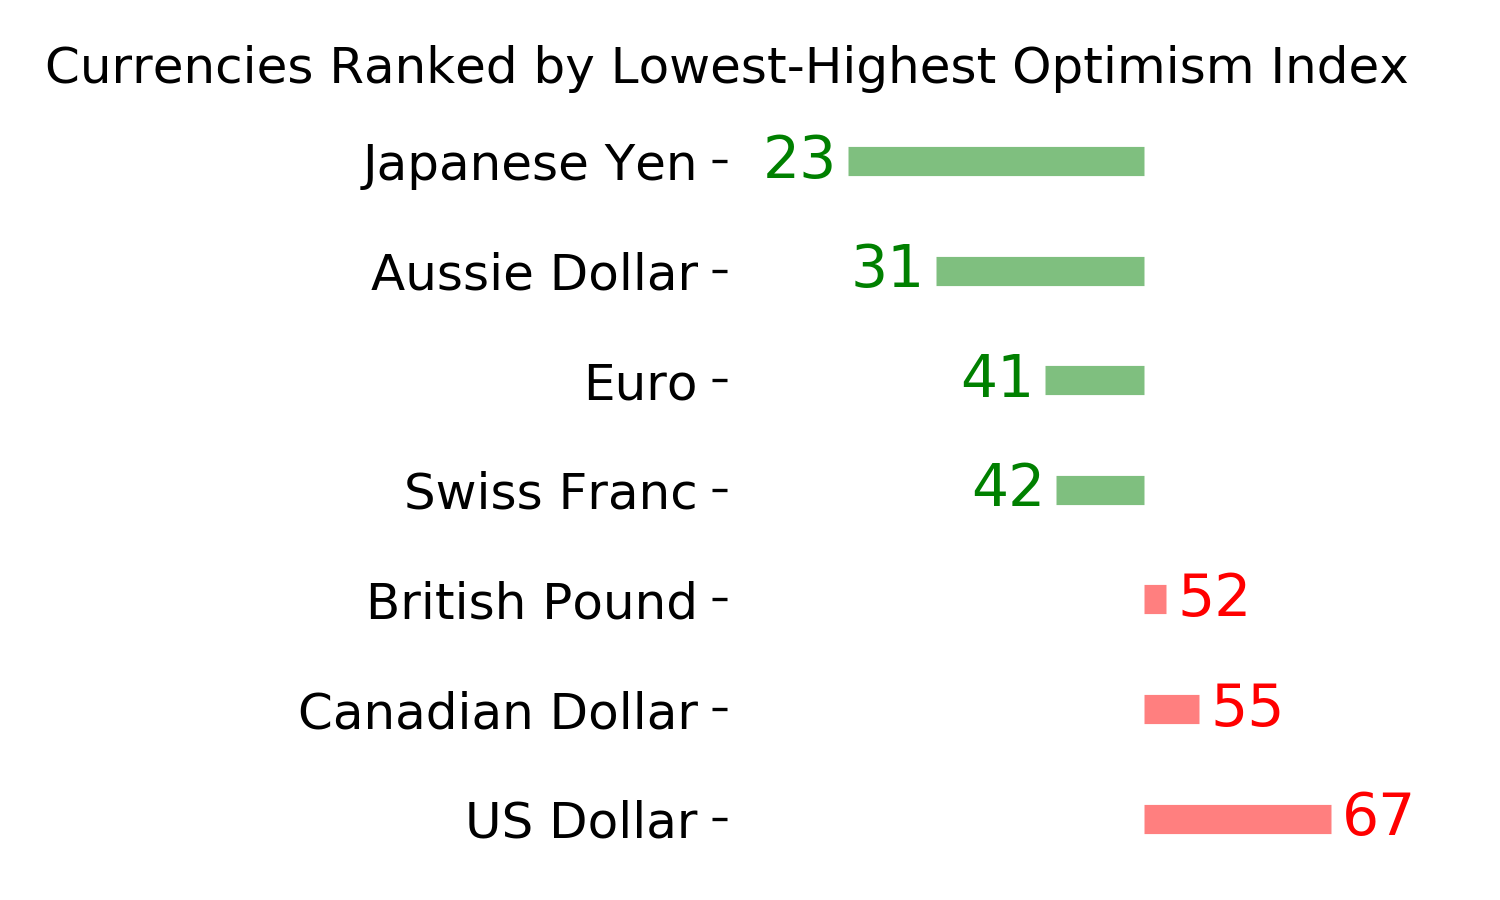
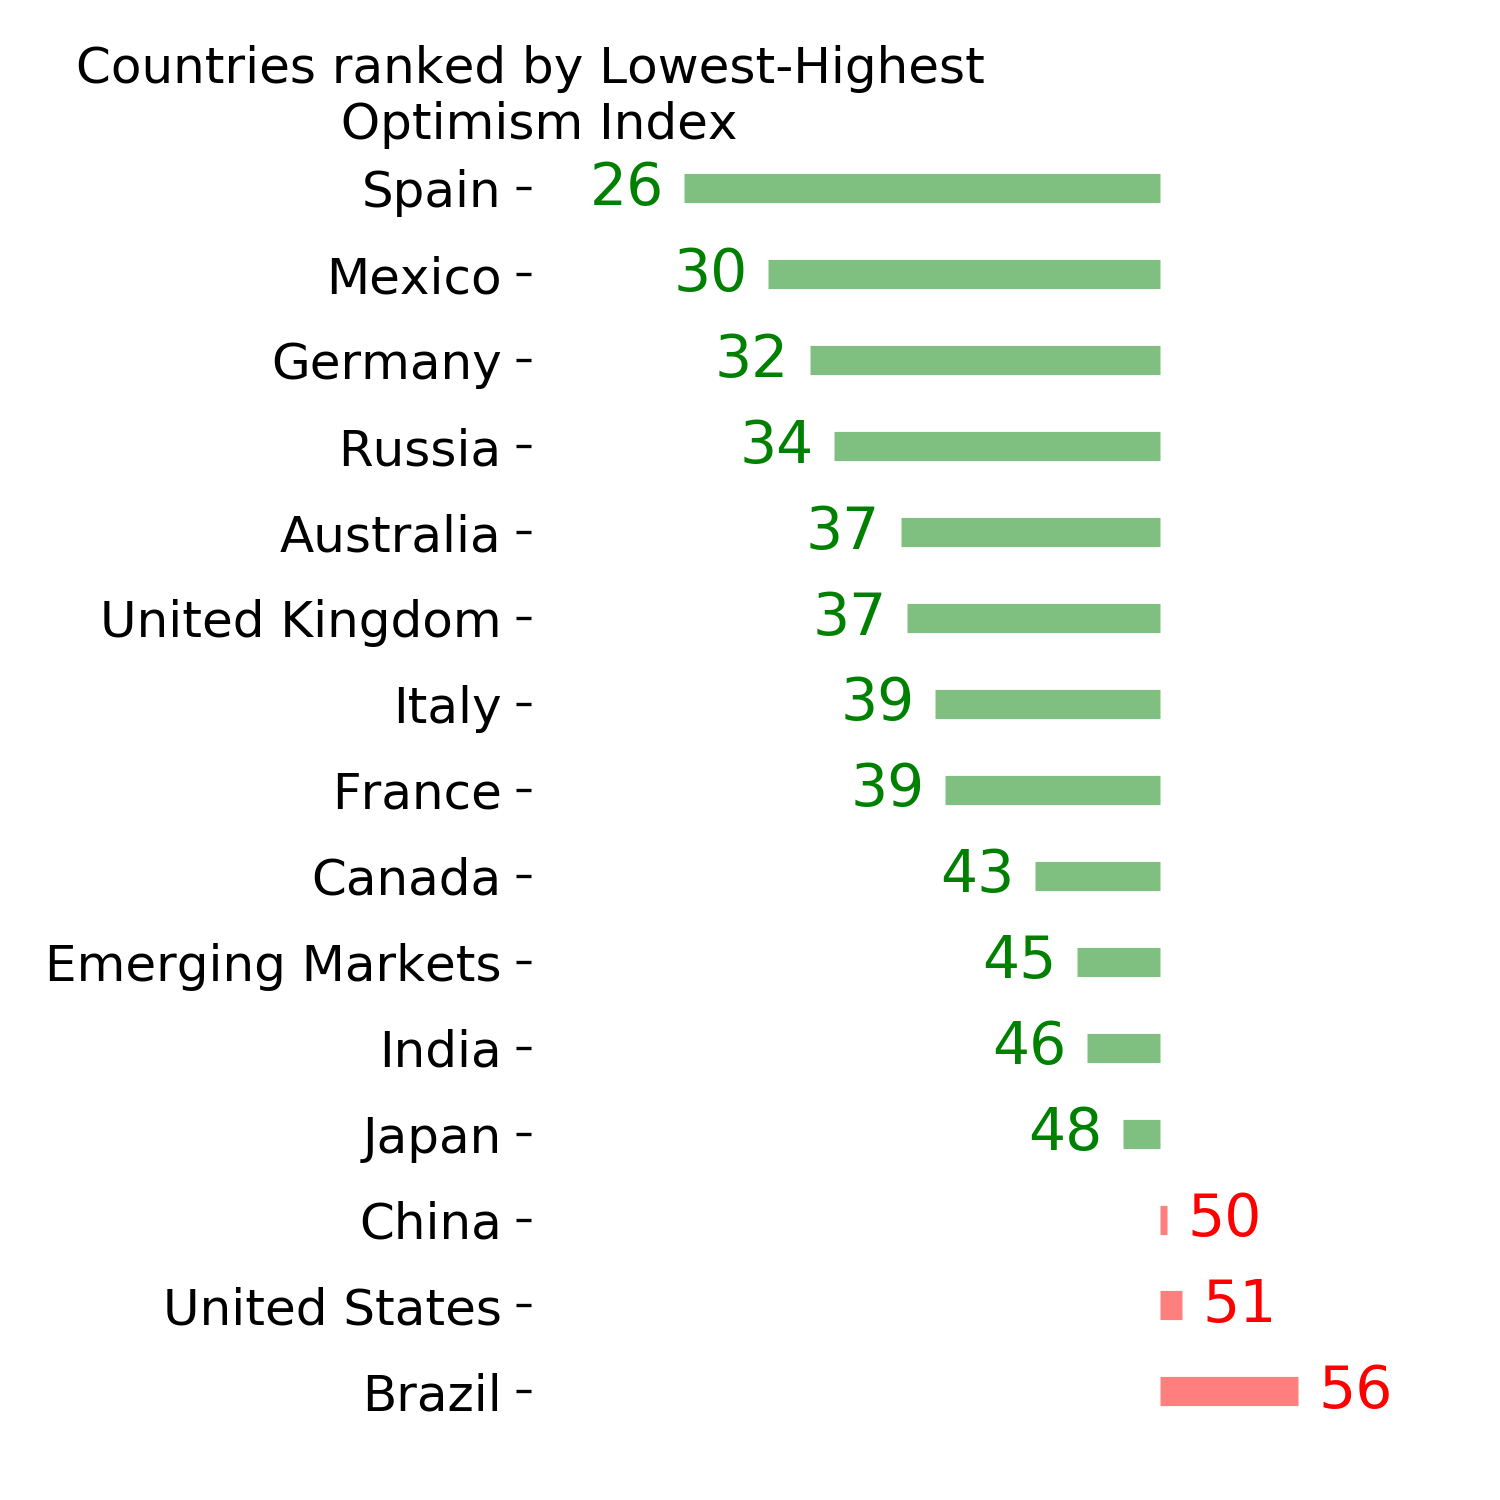
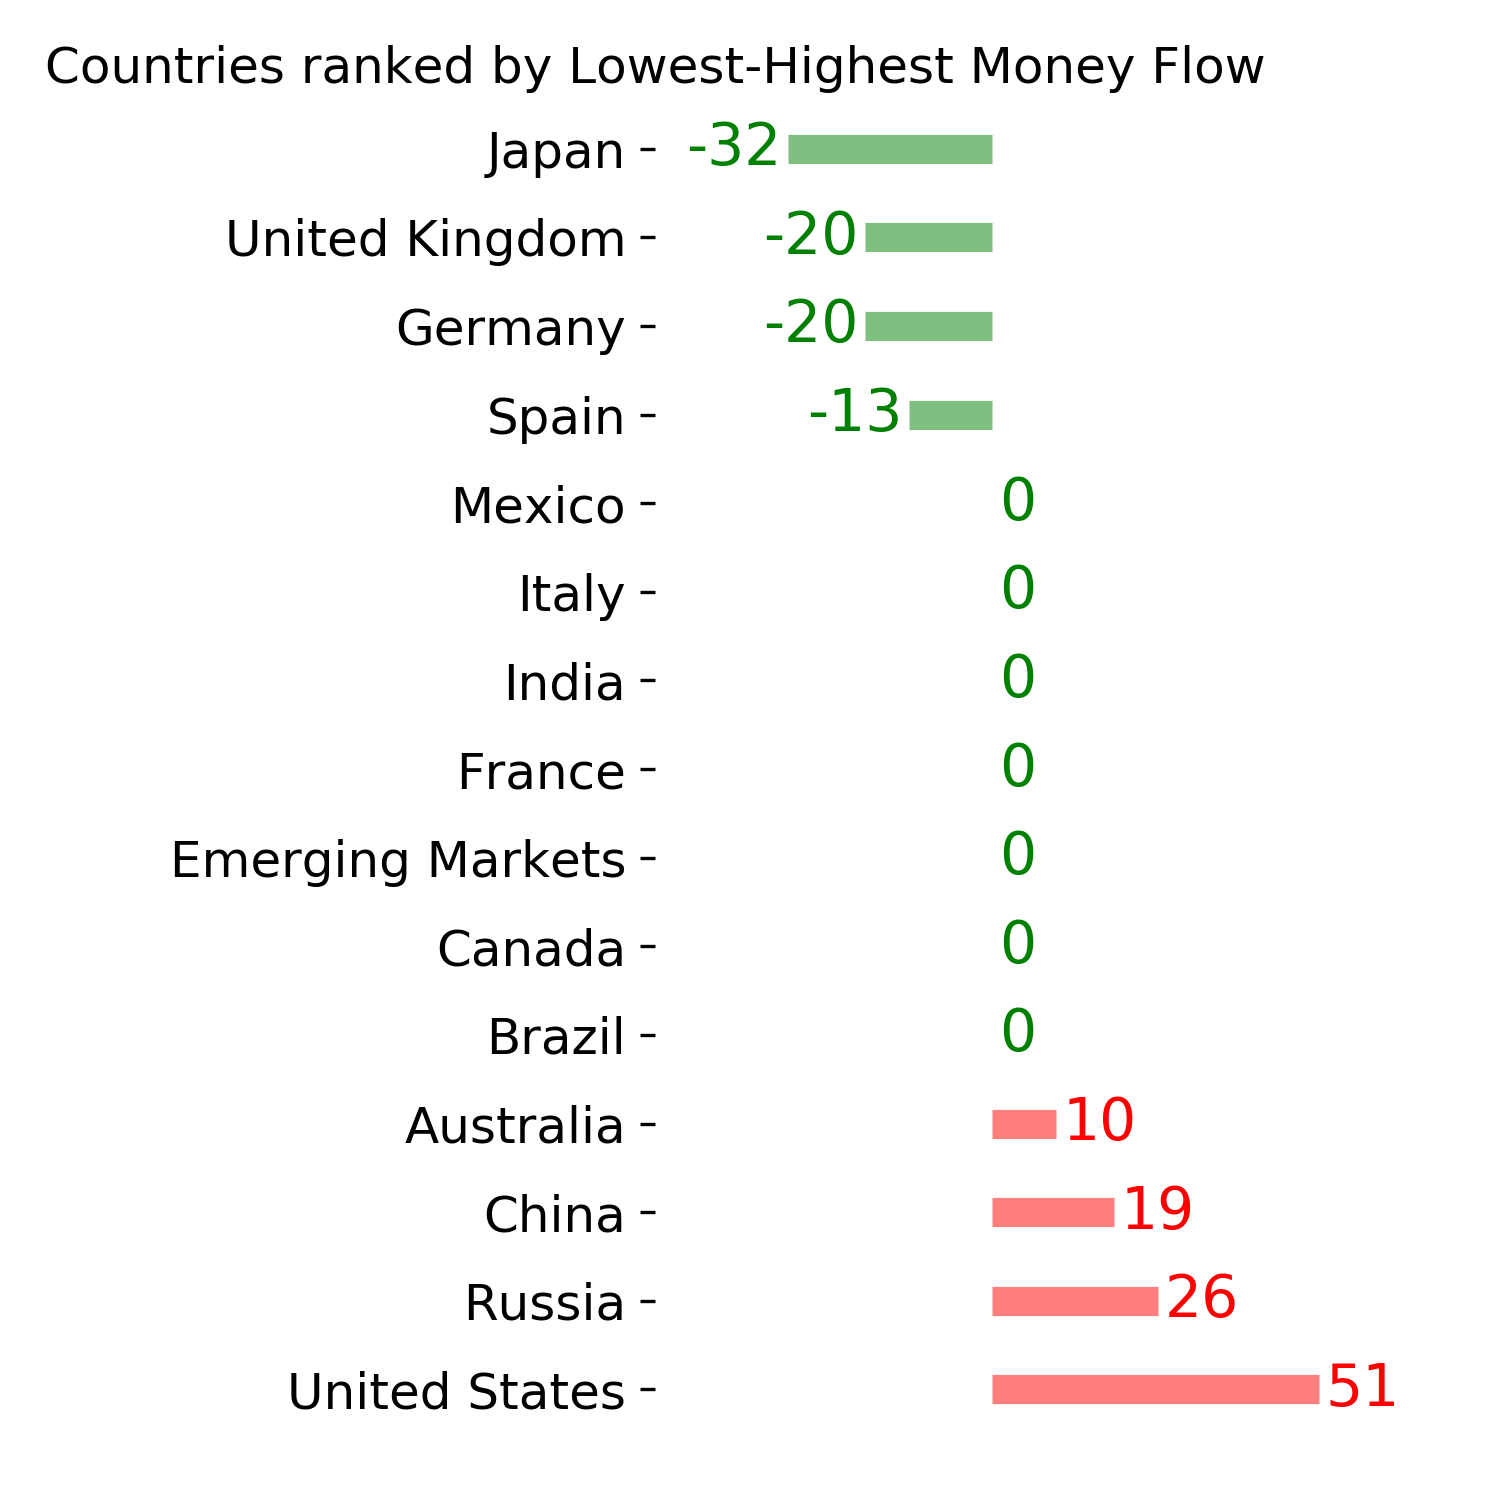
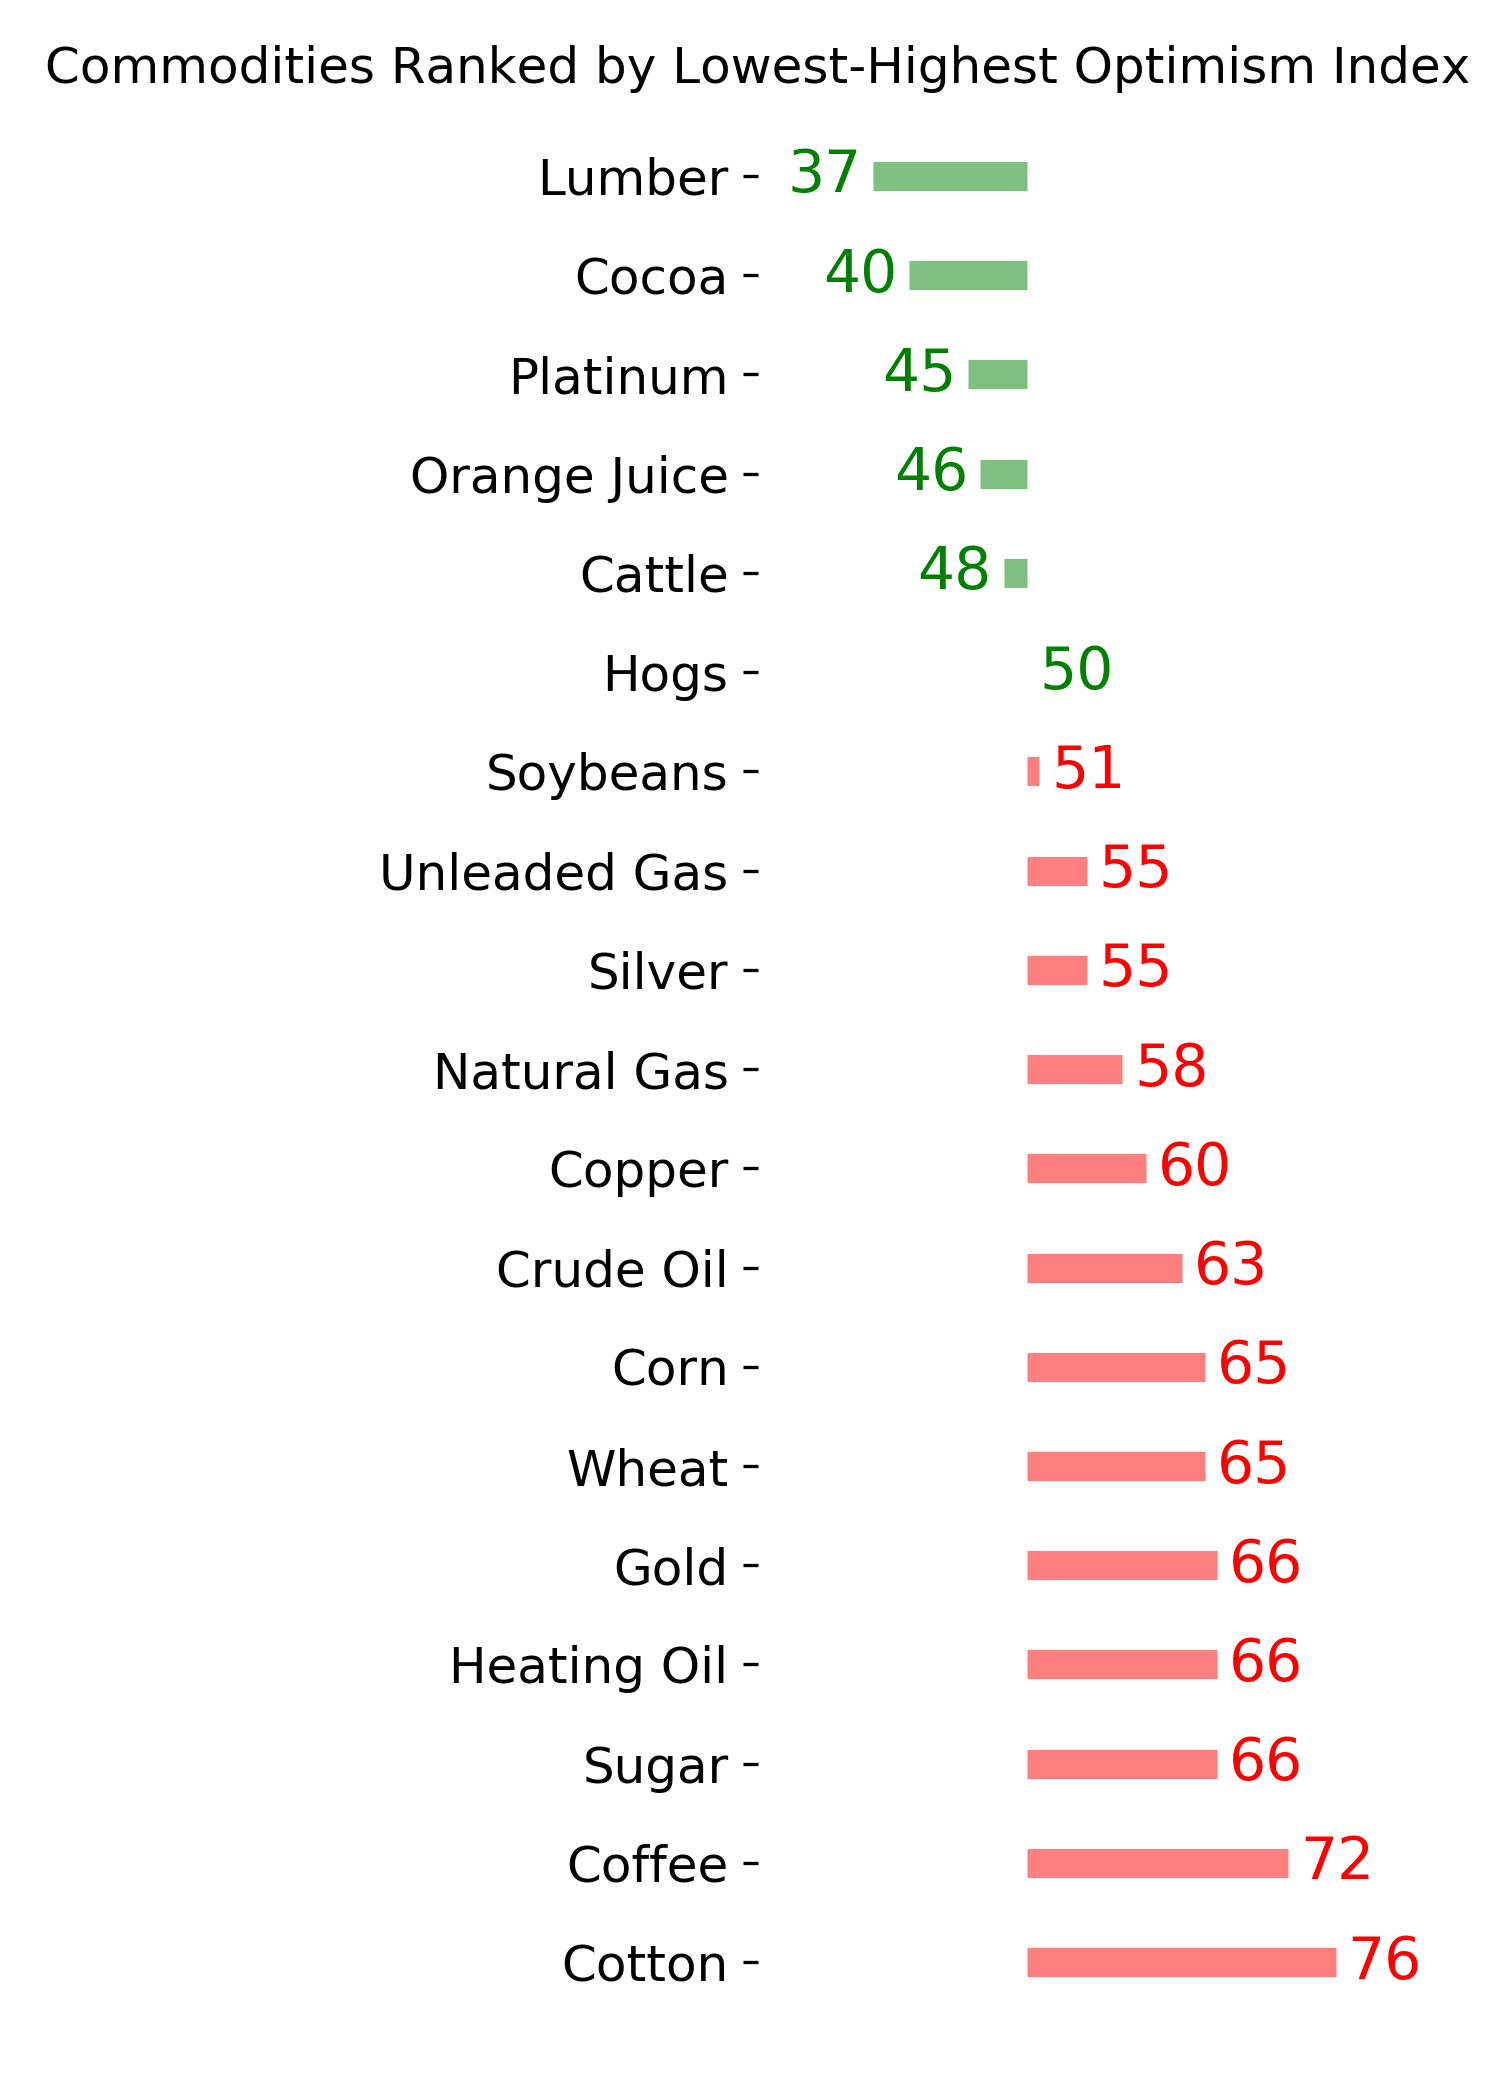
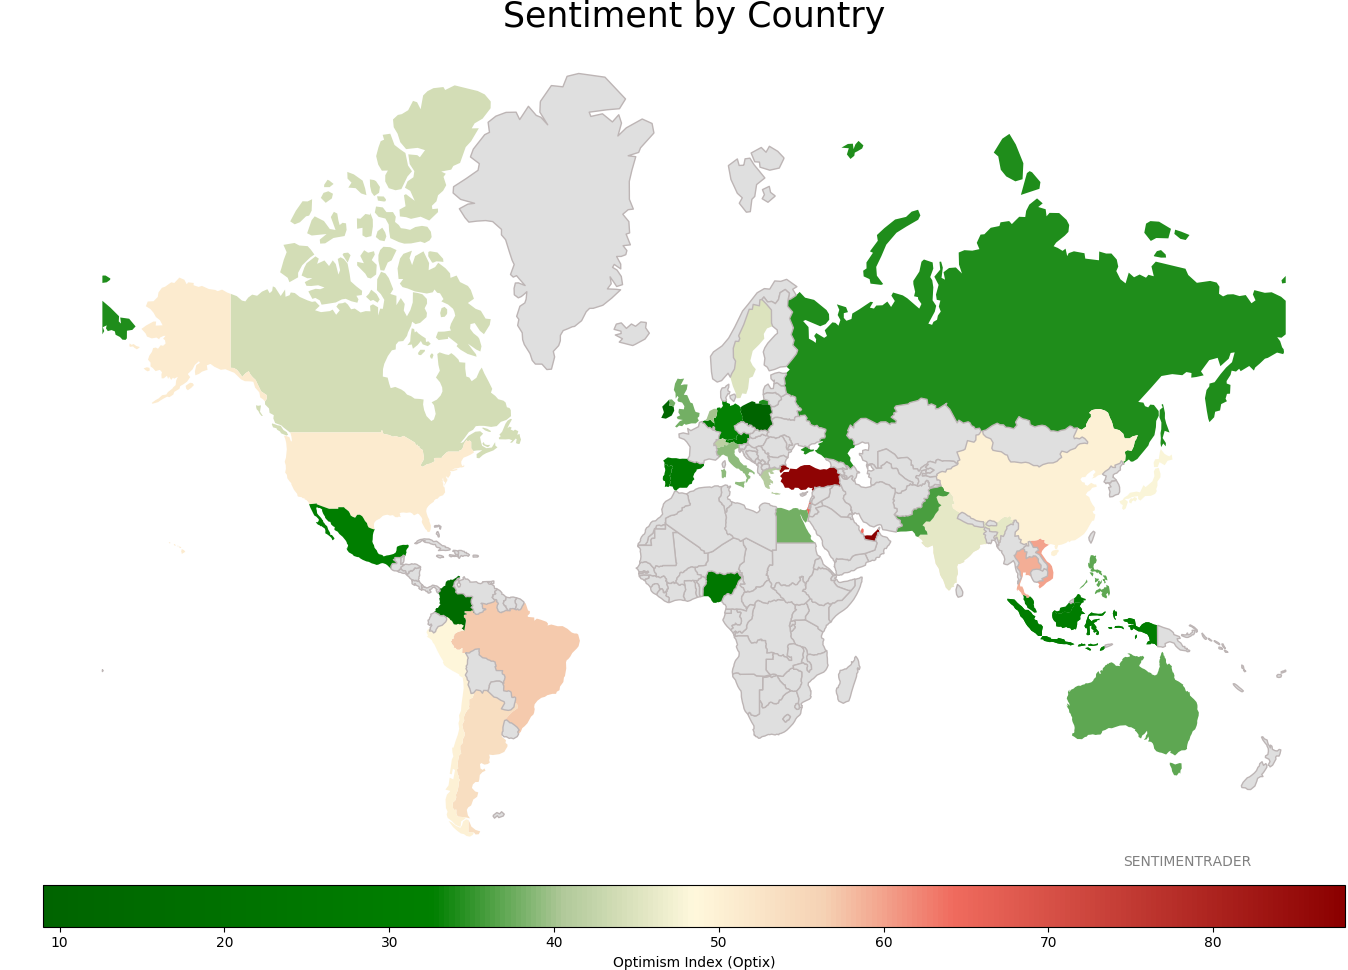
Sentiment Around The World
Optimism Index Thumbnails
|
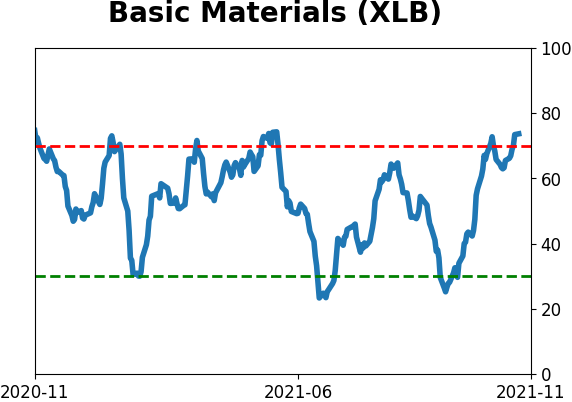
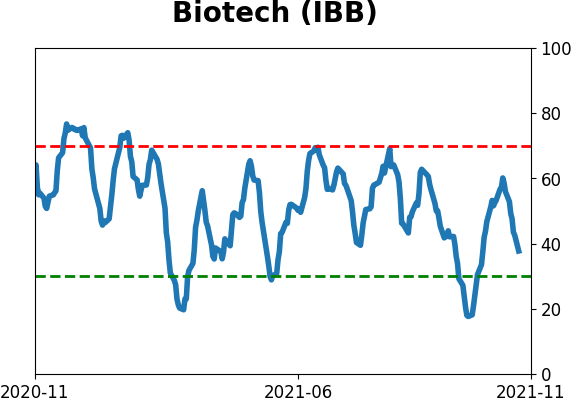
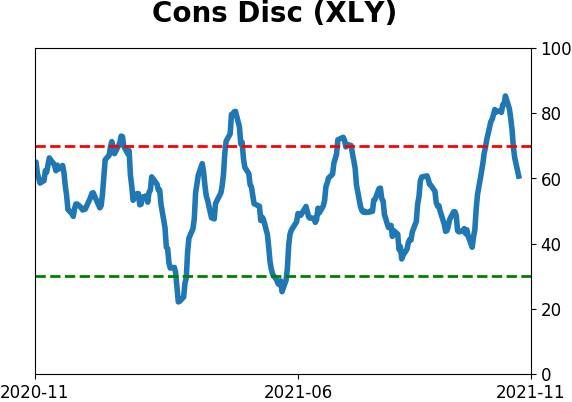
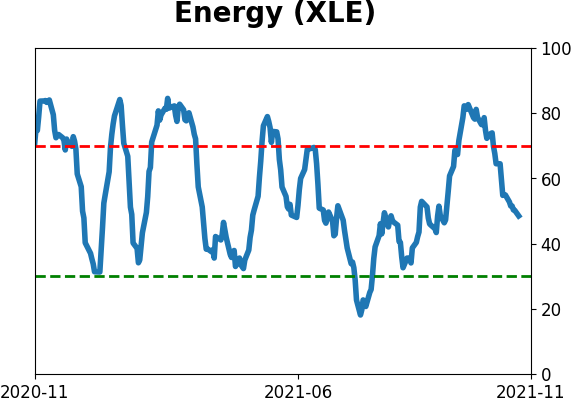
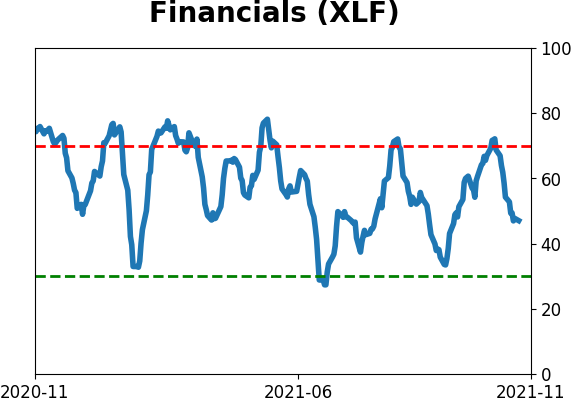
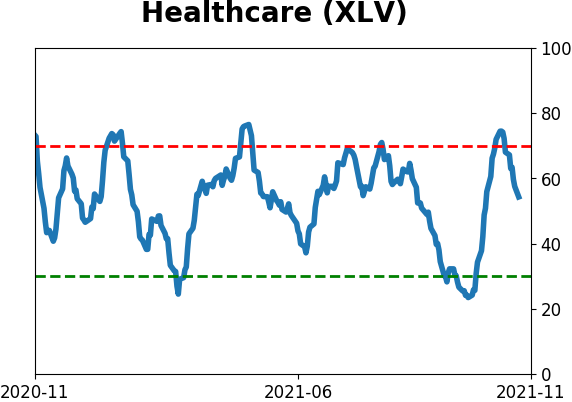
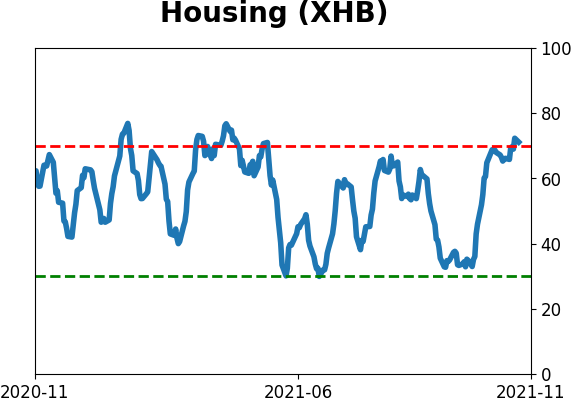
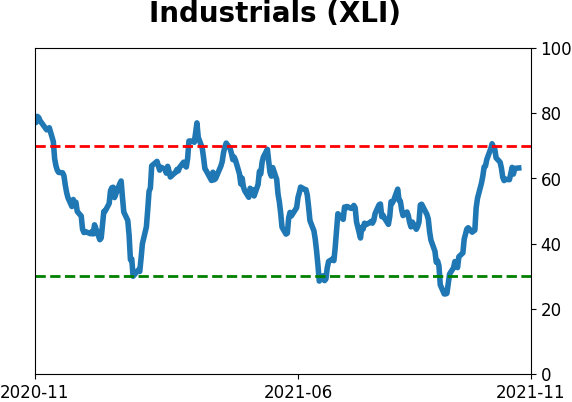
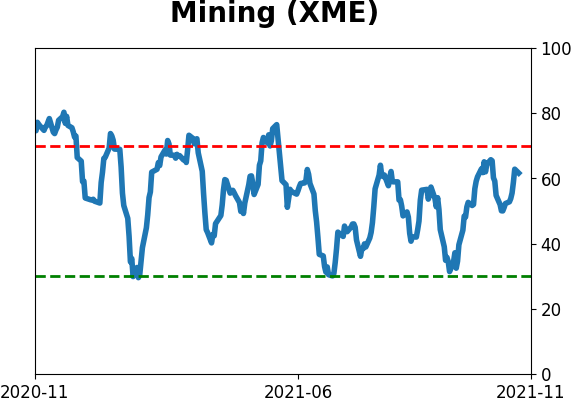
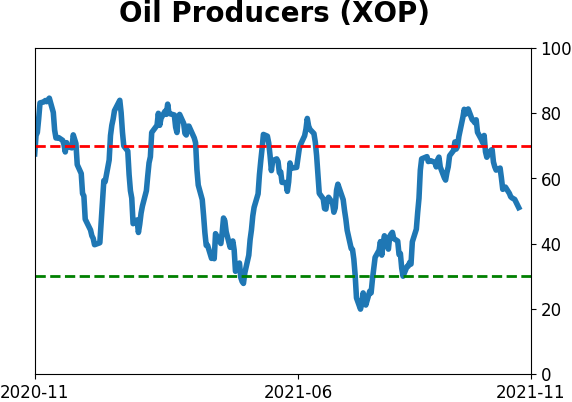
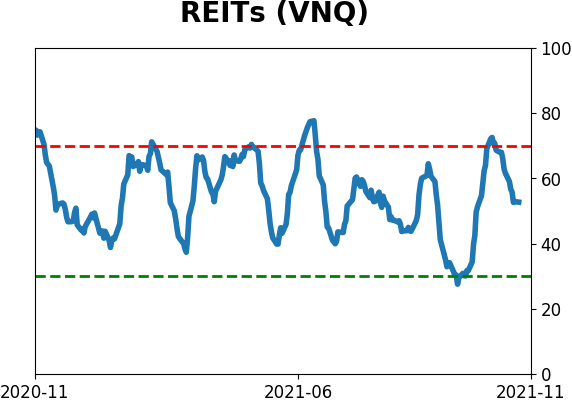
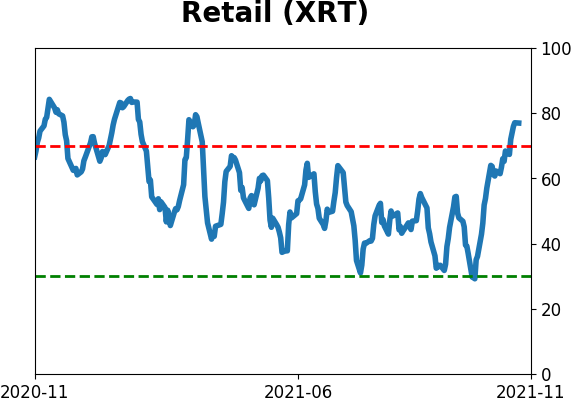
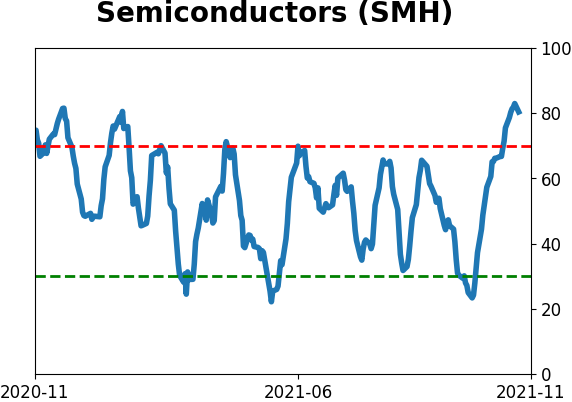
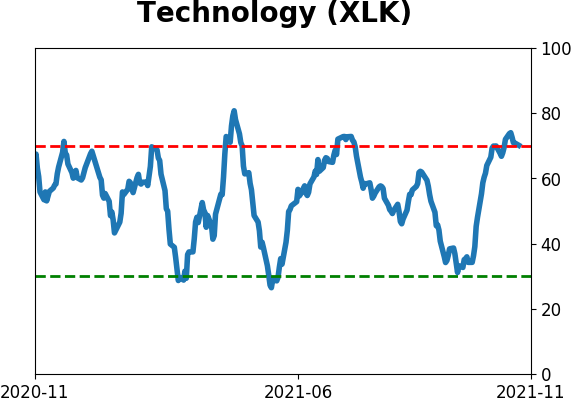
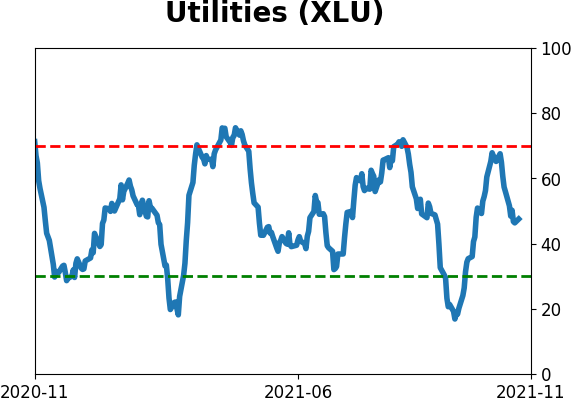
Sector ETF's - 10-Day Moving Average
|
|
|
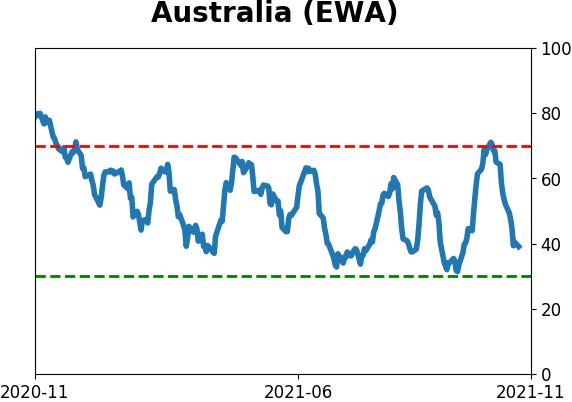
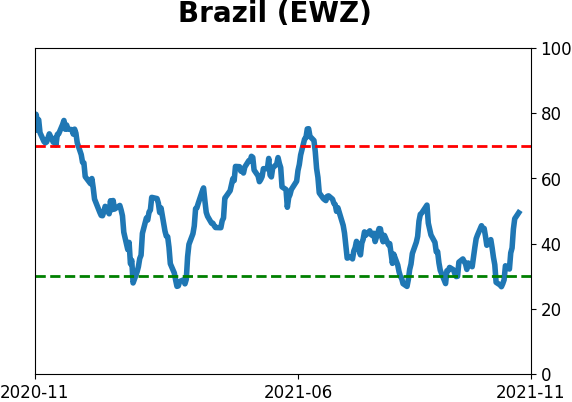
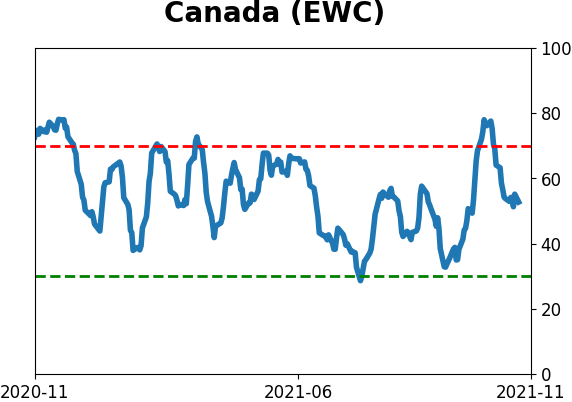
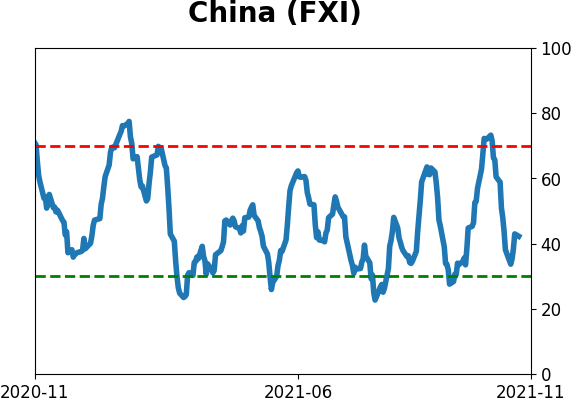
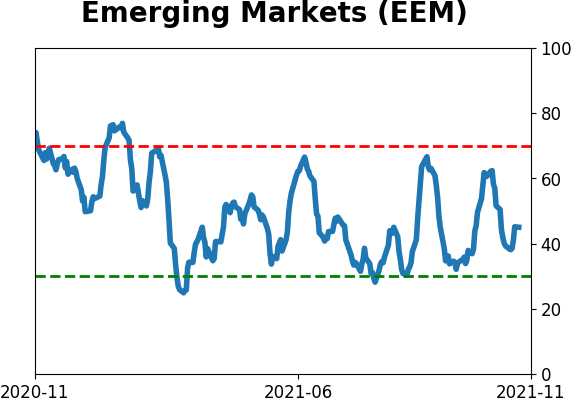
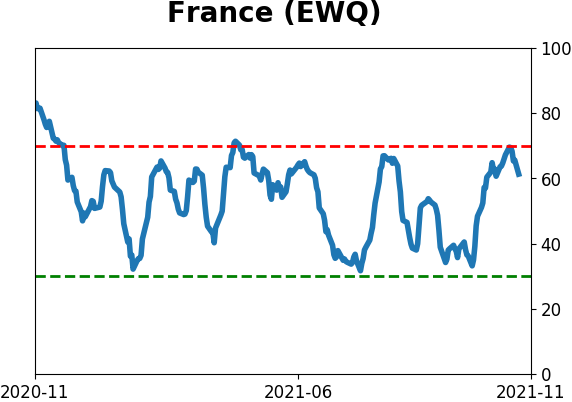
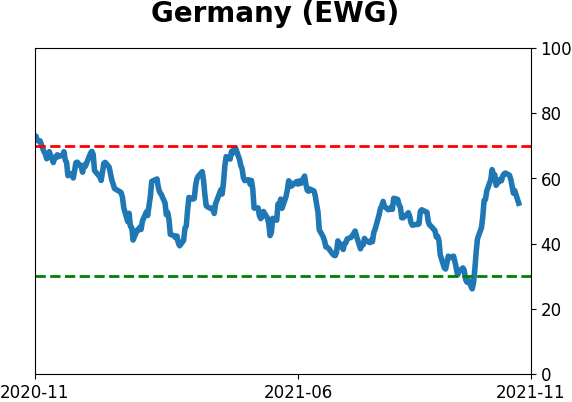
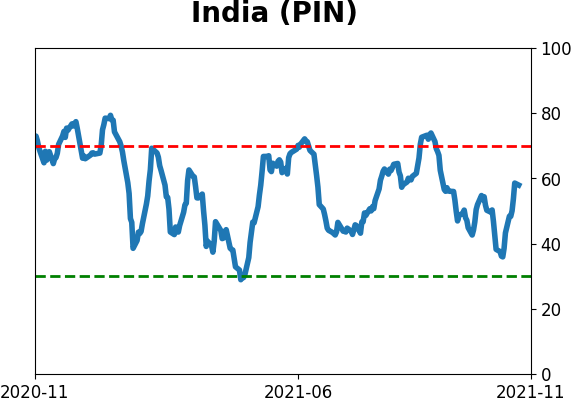
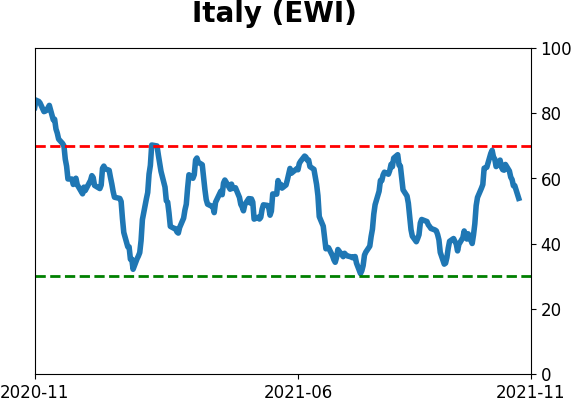
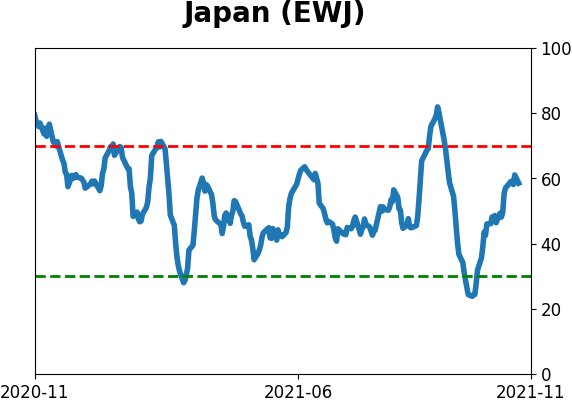
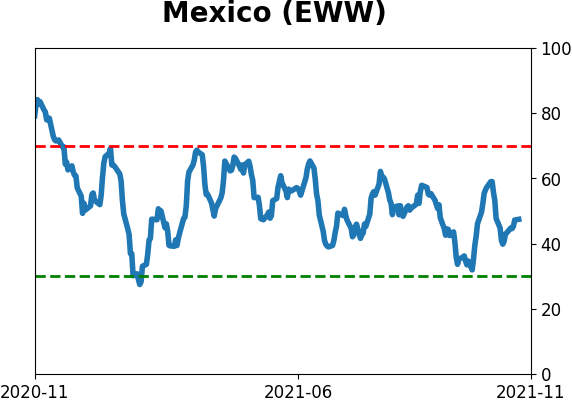
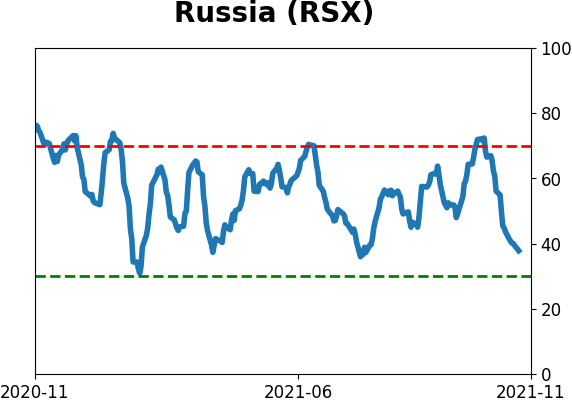
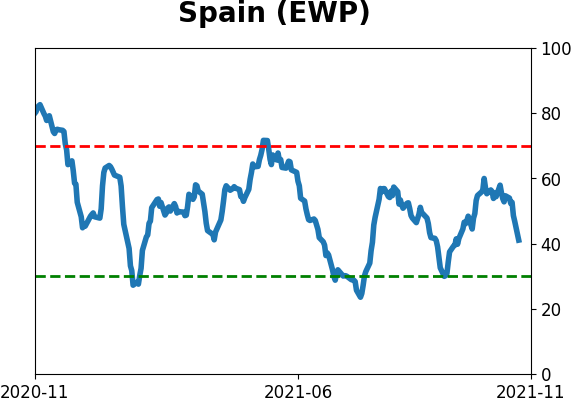
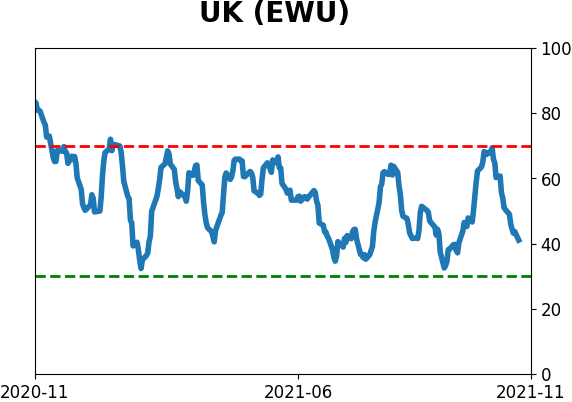
Country ETF's - 10-Day Moving Average
|
|
|
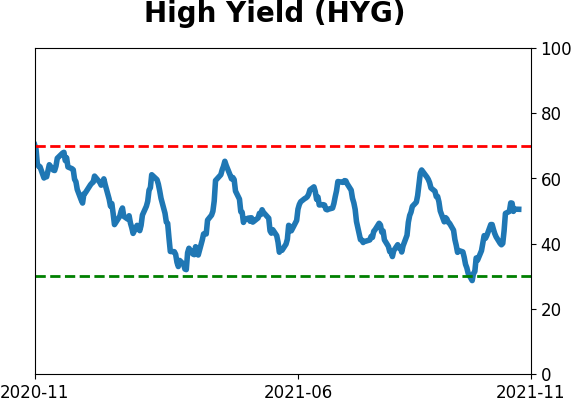
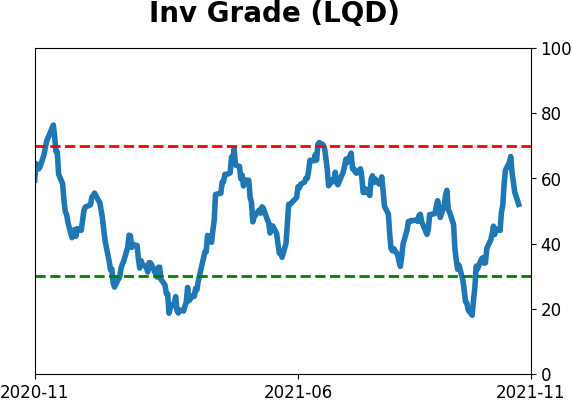
Bond ETF's - 10-Day Moving Average
|
|
|
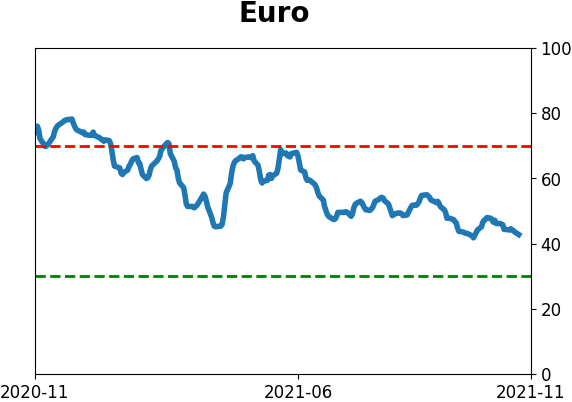
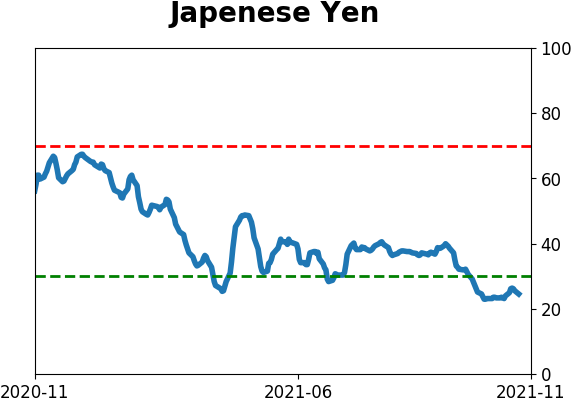
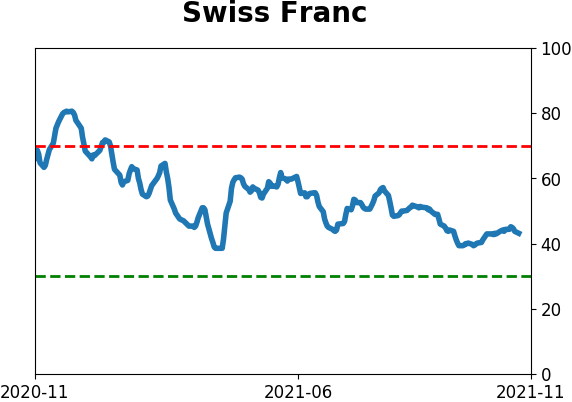
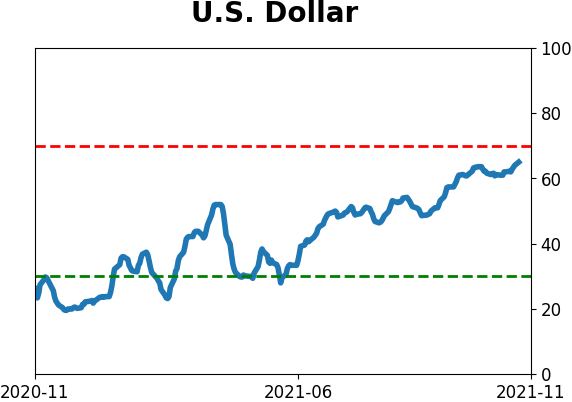
Currency ETF's - 5-Day Moving Average
|
|
|
Commodity ETF's - 5-Day Moving Average
|
|