Headlines
|
|
Crude oil's new bear market:
Crude oil has dropped 20% from its peak. This is a relatively quick bear market, and ends a long bull run. Those developments had a tendency to lead to poor future returns in oil, Energy stocks,and the Canadian dollar.
Bottom Line:
STOCKS: Hold By early October, sentiment had reset. Several important momentum streaks ended, which has brought in buyers in the past, and seasonality turned positive. We're now seeing signs that sentiment has quickly shifted, especially among options traders. It's gotten to an extreme that has preceded weaker-than-average returns.
BONDS: Hold In late October, sentiment on bonds - from Treasuries to corporates - entered pessimistic territory. It's now starting to recover, with some quick moves in corporate bonds. We'll see if those bonds, in particular, can hold recent gains.
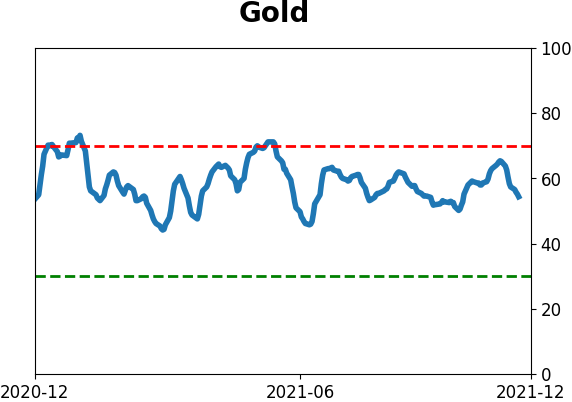
GOLD: Hold
Gold and miners were rejected after trying to recover above their 200-day averages in May. Some oversold extremes in breadth measures among miners triggered in late September, and they've recovered a bit since then. The group still has some proving to do.
|
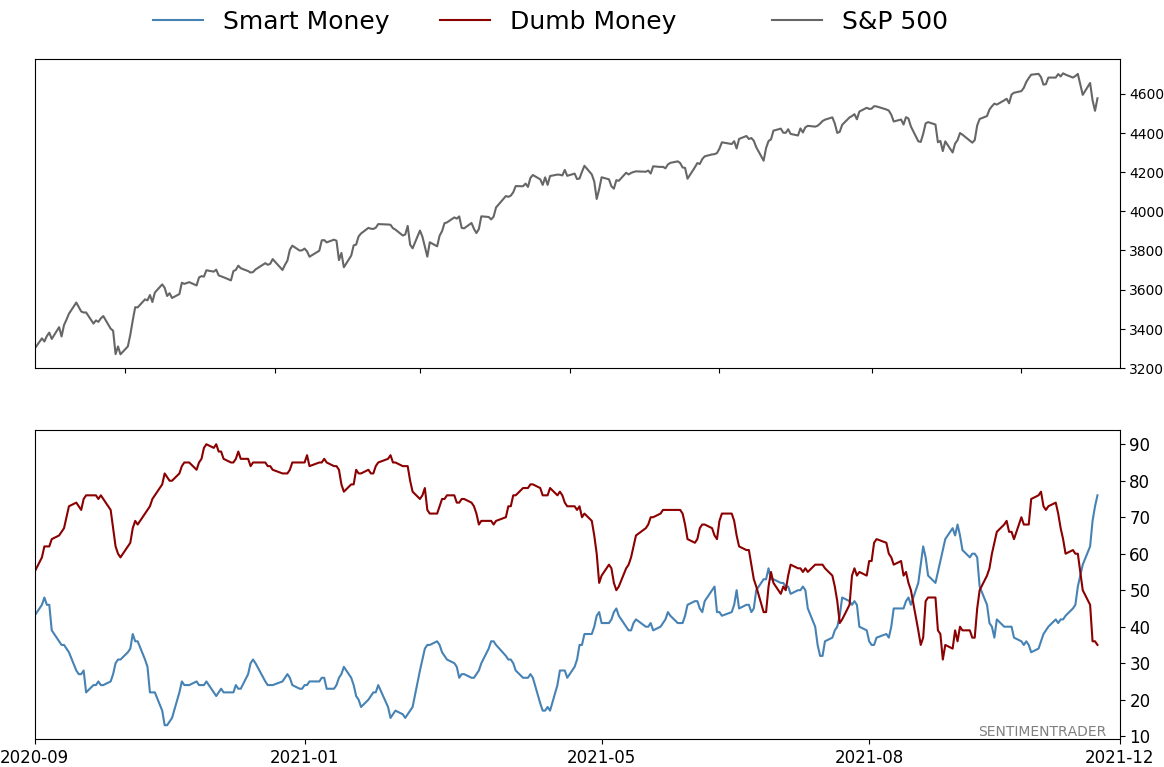
Smart / Dumb Money Confidence
|
Smart Money Confidence: 76%
Dumb Money Confidence: 35%
|
|
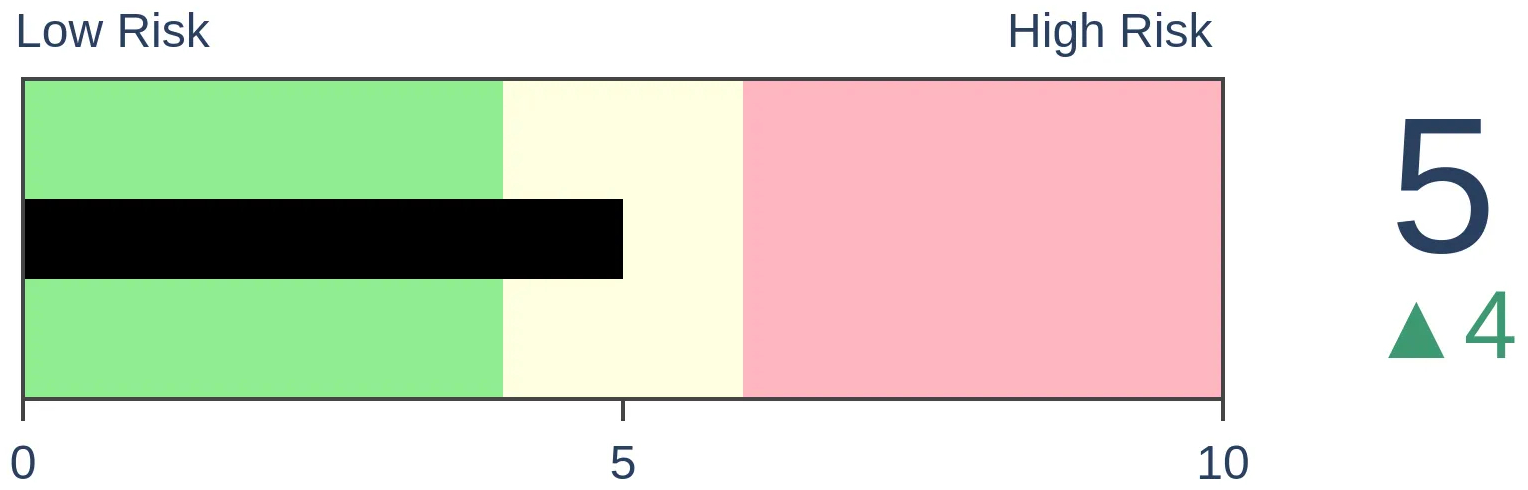
Risk Levels
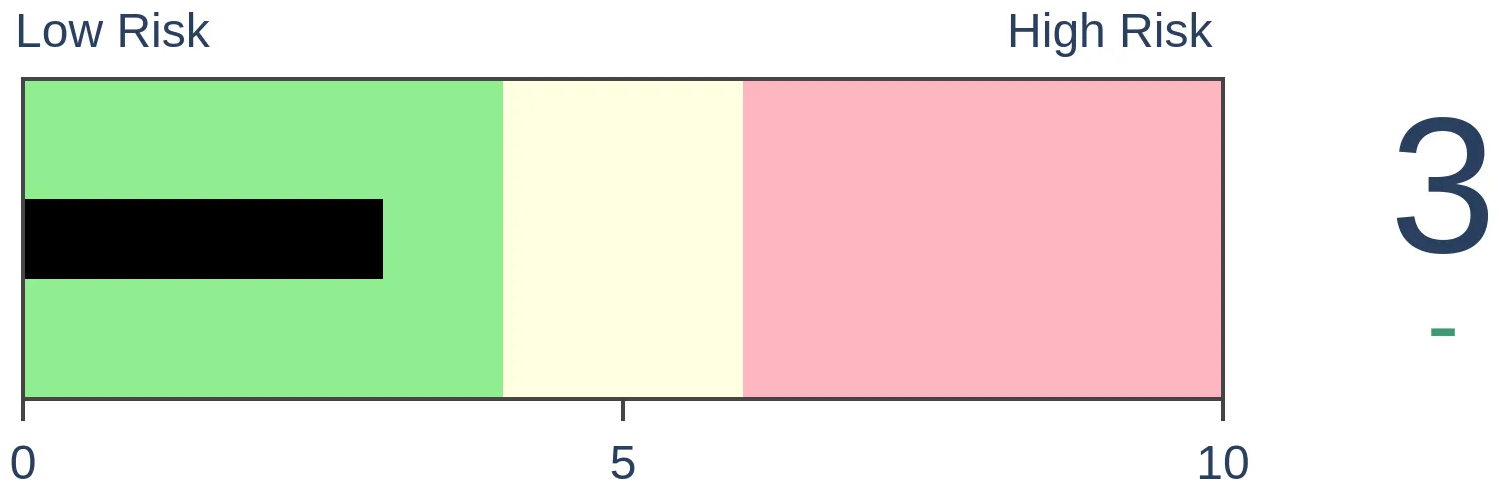
Stocks Short-Term
|
Stocks Medium-Term
|
|
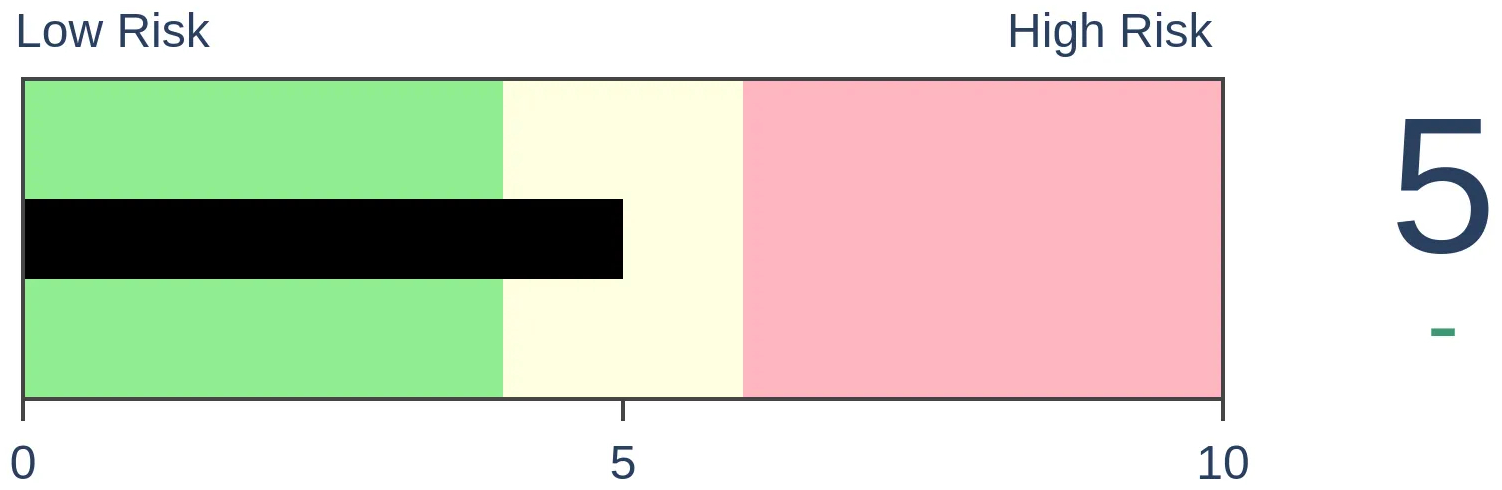
Bonds

|
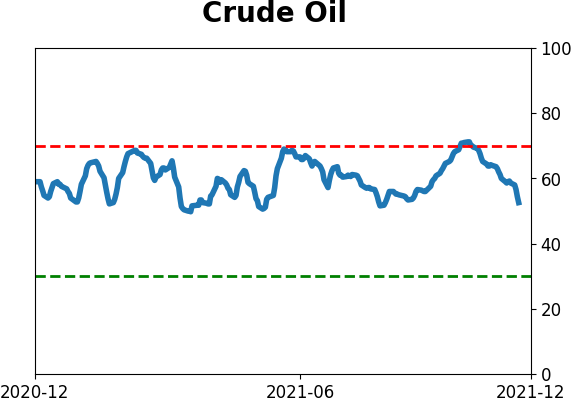
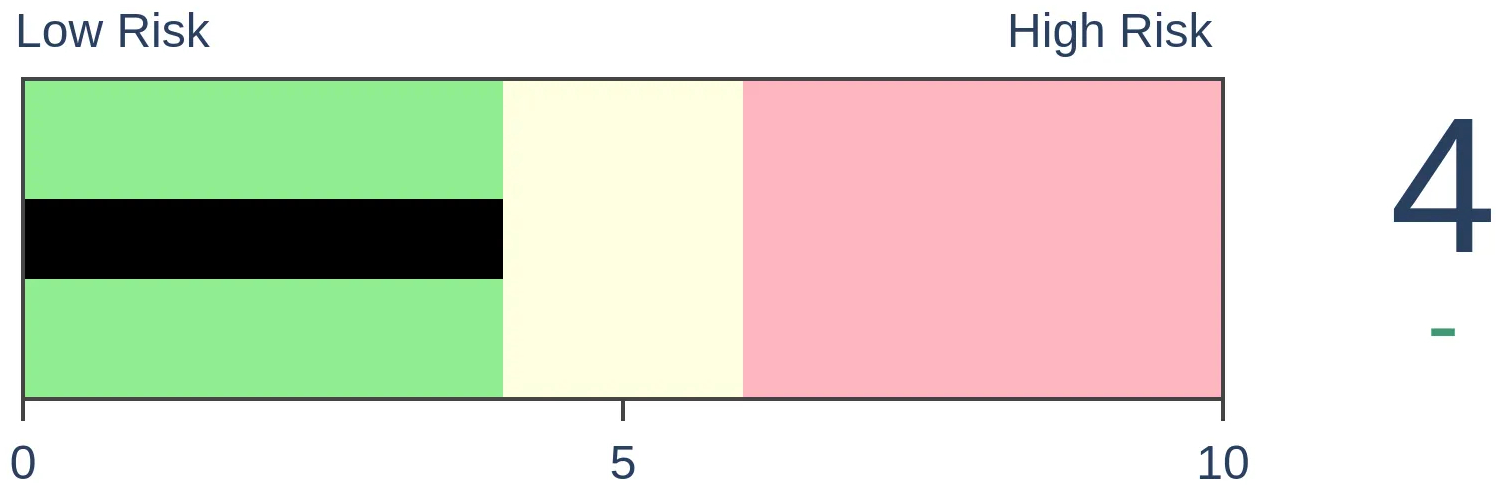
Crude Oil

|
|
Gold
|
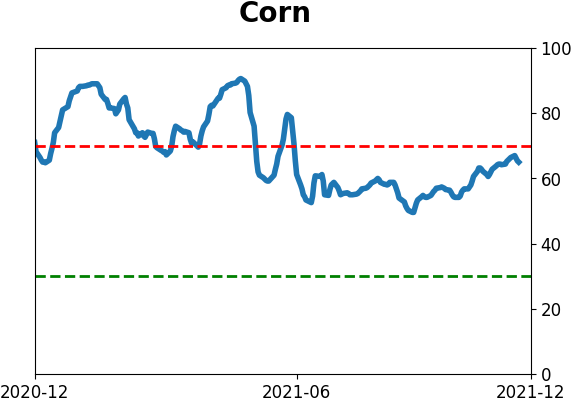
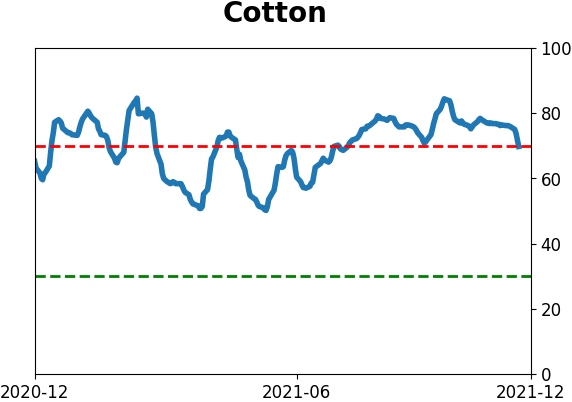
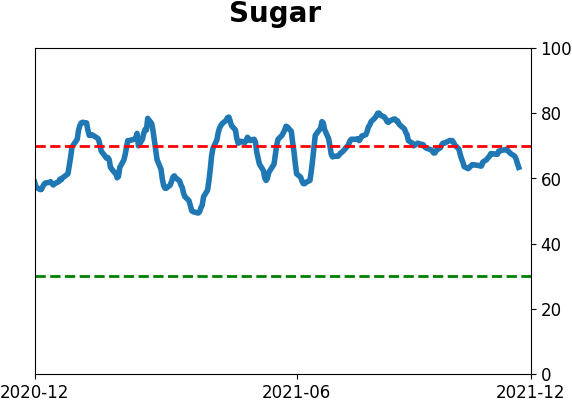
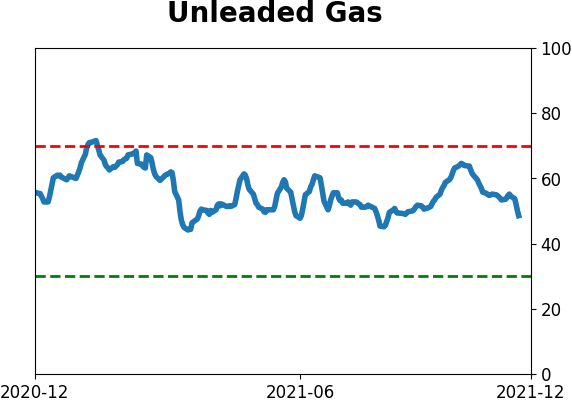
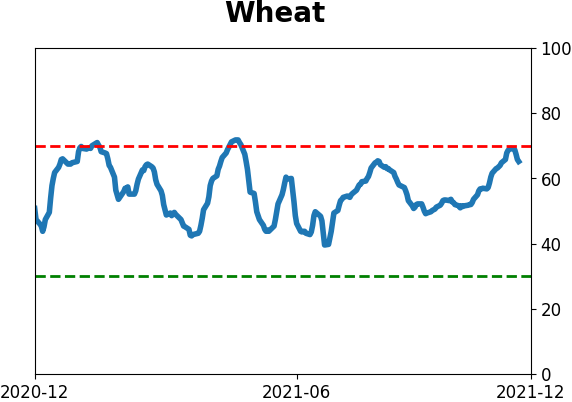
Agriculture
|
|
Research
By Jason Goepfert
BOTTOM LINE
Crude oil has dropped 20% from its peak. This is a relatively quick bear market, and ends a long bull run. Those developments had a tendency to lead to poor future returns in oil, Energy stocks,and the Canadian dollar.
FORECAST / TIMEFRAME
USO -- Down, Medium-Term
|
Key points:
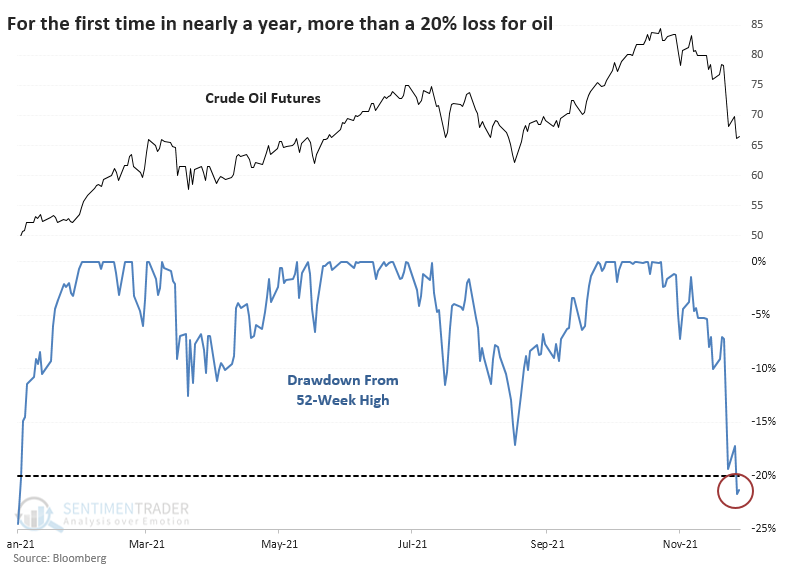
- Crude oil has dropped 20% from its 52-week high in fewer than 30 days
- Other quick reversals led to negative forward returns in oil, Energy stocks, and the Canadian dollar
- The ends of long bull runs also led to mostly negative returns in those markets
A new bear for a widely-watched market
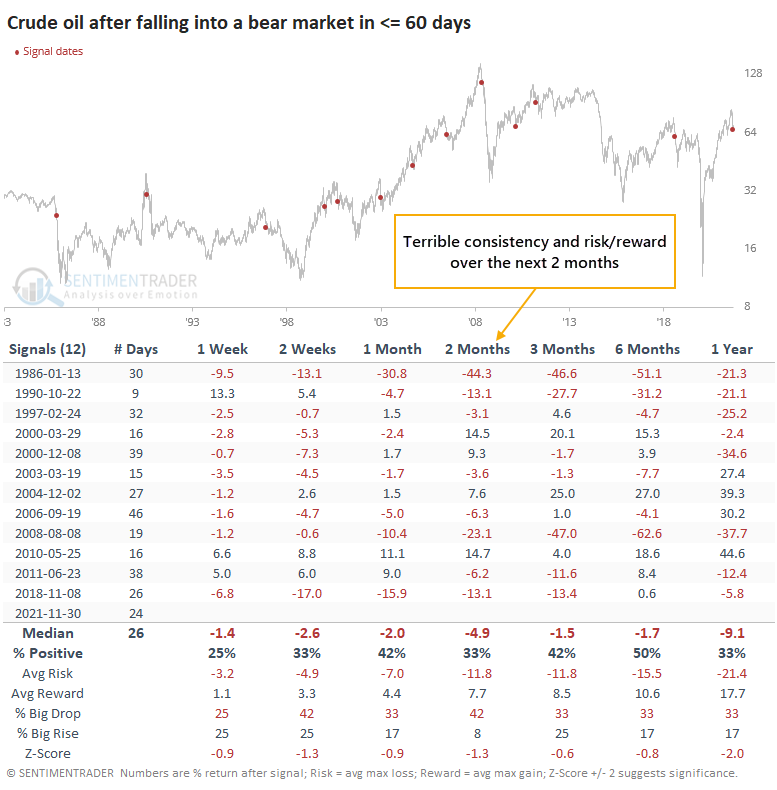
After a plunge to start the week, crude oil bounced back quickly. Dean showed why that was likely just a dead-cat bounce, and already oil has plunged to new lows. The selling pressure was enough to push it more than 20% below its prior 52-week high, the first bear market in nearly a year.
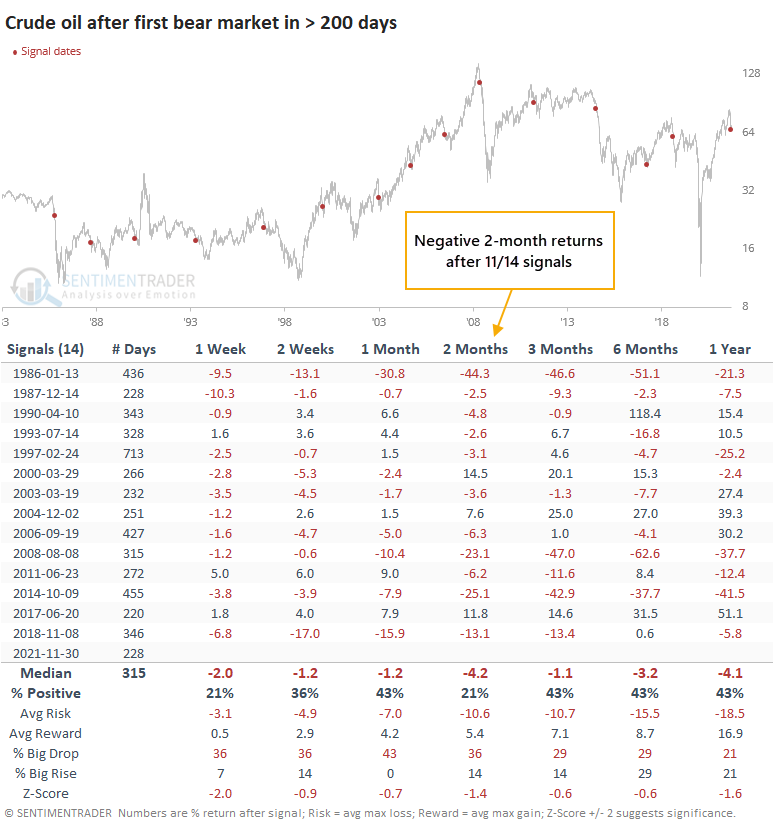
It took crude oil only 24 days to cycle from a new high to a bear market. This is relatively quick but not totally out of bounds for such a hit-or-miss market. Since 1985, there have been 12 other times when oil cycled into a bear market in under 60 days, and it was not a good sign for future returns. Over the next 2 months, oil rebounded only a third of the time.
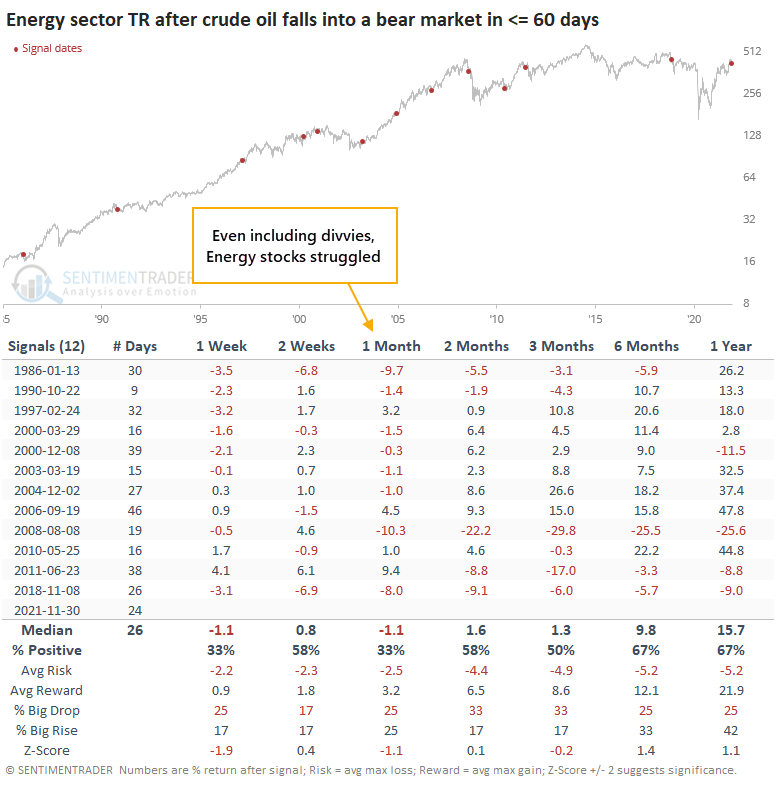
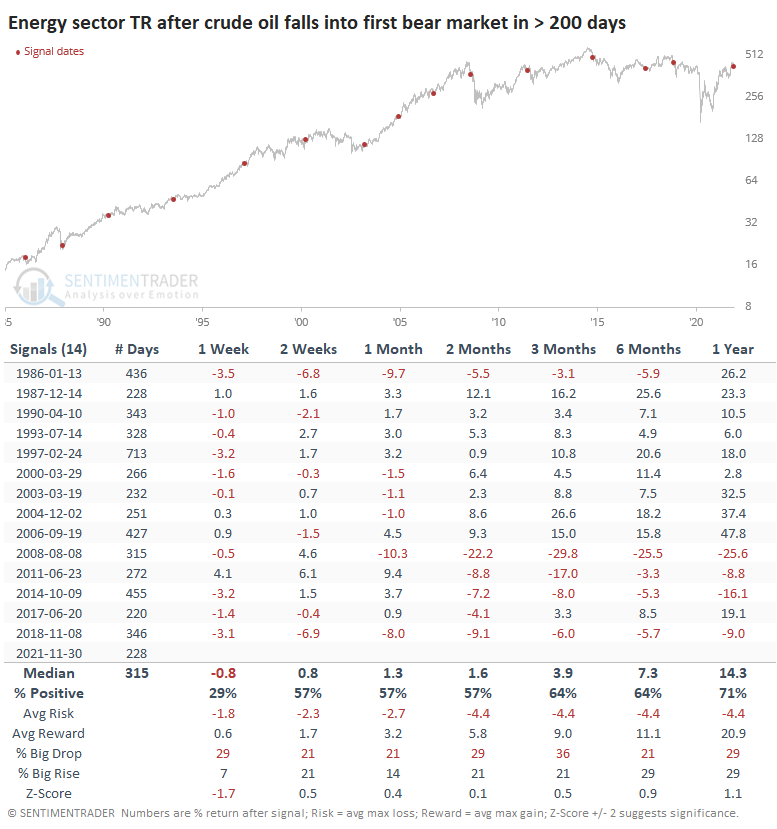
There is not a perfect correlation between crude oil and the price of Energy stocks. Even so, these new bear markets in oil were not all that great of a sign for the sector, even when using total return, which includes sometimes-hefty dividend payouts.
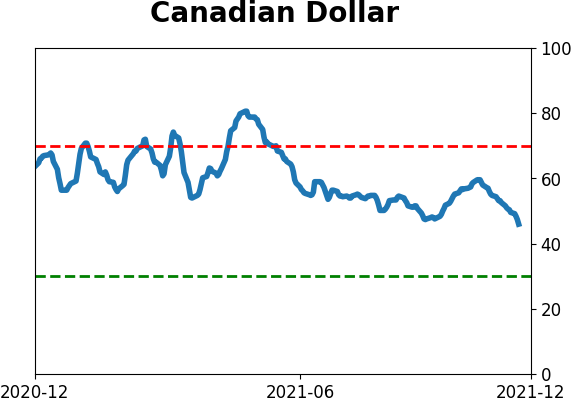
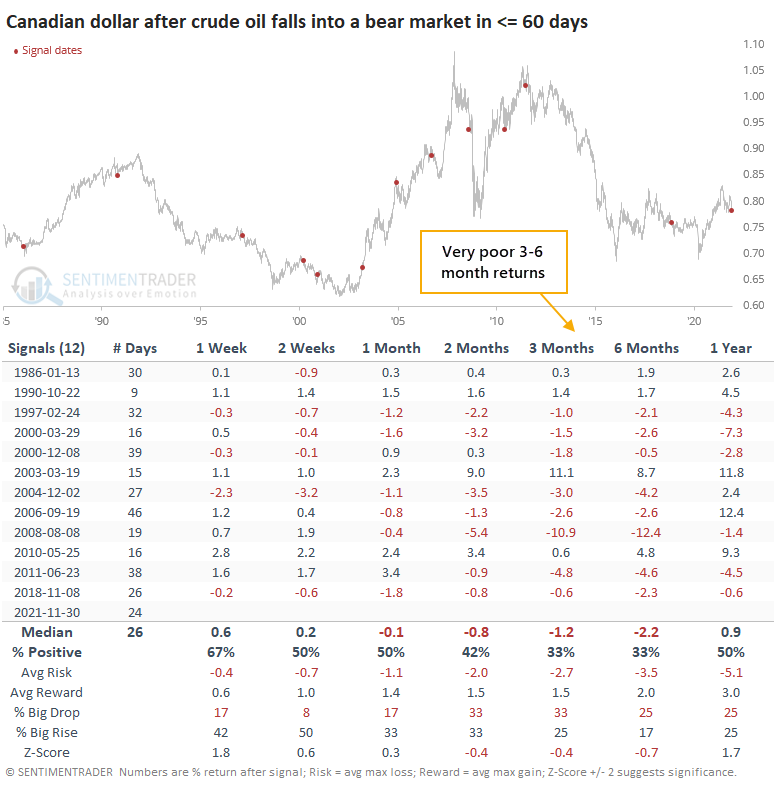
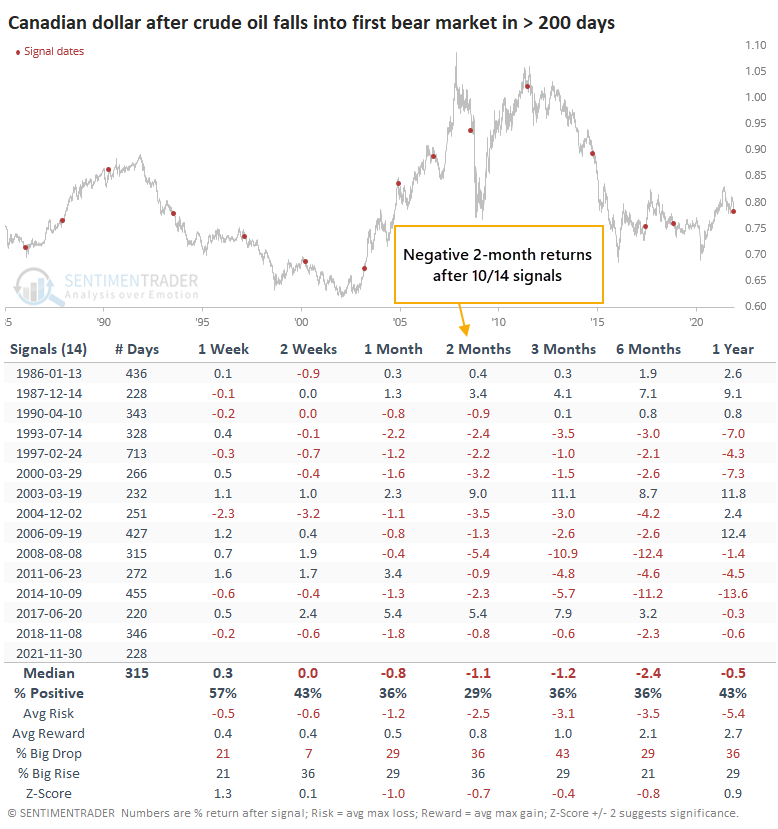
According to Bloomberg, the currency with the most significant 60-day correlation to crude oil is the Canadian dollar. So, it's not too surprising that currency had trouble holding any gains.
The end of a long bull run
This week's drop also ended nearly a year-long bull run in oil. It had been 228 days since oil was more than 20% below a 52-week high, ending one of the longer positive streaks in the history of the futures contract.
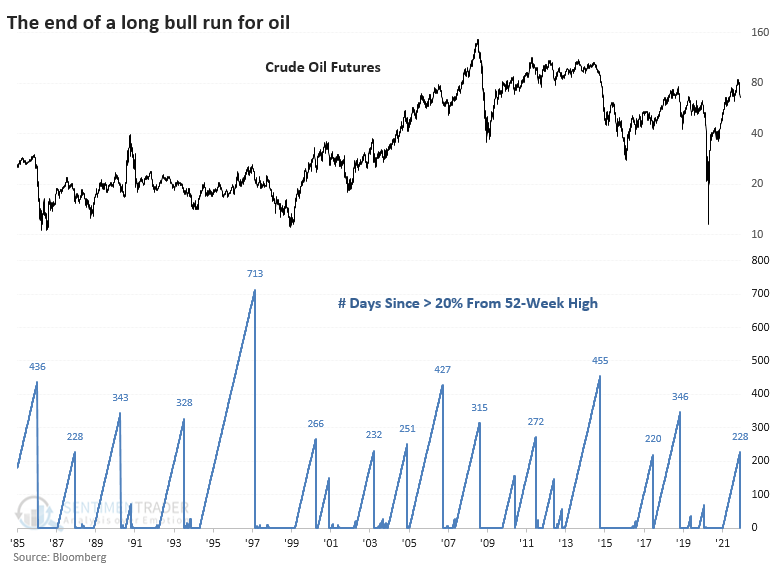
The ends of long periods without a bear market were even worse for oil prices going forward. Over the next 2 months, oil lost ground after 11 out of 14 signals.
These weren't as bad for the stocks that depend primarily on oil and its after products.
Again, though, the loonie did not do well after these signals.
What the research tells us...
Like small-cap stocks, crude oil has suffered a quick reversal from a recent new high. This market is subject to all kinds of structural, geopolitical, and environmental factors that can impact historical comparisons instantly. But if we rely on the general patterns, then quick reversals from a peak, and the ends of long bull runs, have consistently led to poor medium-term returns. This also had a modest negative influence on Energy sector stocks and an enormous negative impact on currencies like the Canadian dollar.
Active Studies
| Time Frame | Bullish | Bearish | | Short-Term | 2 | 3 | | Medium-Term | 11 | 1 | | Long-Term | 13 | 7 |
|
Indicators at Extremes
Portfolio
| Position | Description | Weight % | Added / Reduced | Date | | Stocks | RSP | 10.7 | Added 6.4% | 2021-10-01 | | Bonds | 32.7% BND, 7.1% SCHP | 39.8 | Added 8.3% | 2021-10-26 | | Commodities | GCC | 2.4 | Reduced 2.1%
| 2020-09-04 | | Precious Metals | GDX | 4.6 | Reduced 4.2% | 2021-05-19 | | Special Situations | 9.8% KWEB, 4.7% XLE, 2.9% PSCE | 17.3 | Added 9.78% | 2021-10-01 | | Cash | | 24.1 | | |
|
Updates (Changes made today are underlined)
Much of our momentum and trend work has remained positive for several months, with some scattered exceptions. Almost all sentiment-related work has shown a poor risk/reward ratio for stocks, especially as speculation drove to record highs in exuberance in February. Much of that has worn off, and most of our models are back toward neutral levels. There isn't much to be excited about here. The same goes for bonds and even gold. Gold has been performing well lately and is back above long-term trend lines. The issue is that it has a poor record of holding onto gains when attempting a long-term trend change like this, so we'll take a wait-and-see approach. Momentum has ebbed quickly in recent weeks, and nearing oversold levels in some indicators. This can be a dangerous area, with a lot of short-term volatility, but we'd be more inclined to add medium- to long-term exposure rather than sell on much more of a decline, thanks to already rock-bottom exposure. Other areas look more attractive, including some overseas markets. RETURN YTD: 8.3% 2020: 8.1%, 2019: 12.6%, 2018: 0.6%, 2017: 3.8%, 2016: 17.1%, 2015: 9.2%, 2014: 14.5%, 2013: 2.2%, 2012: 10.8%, 2011: 16.5%, 2010: 15.3%, 2009: 23.9%, 2008: 16.2%, 2007: 7.8%
|
|
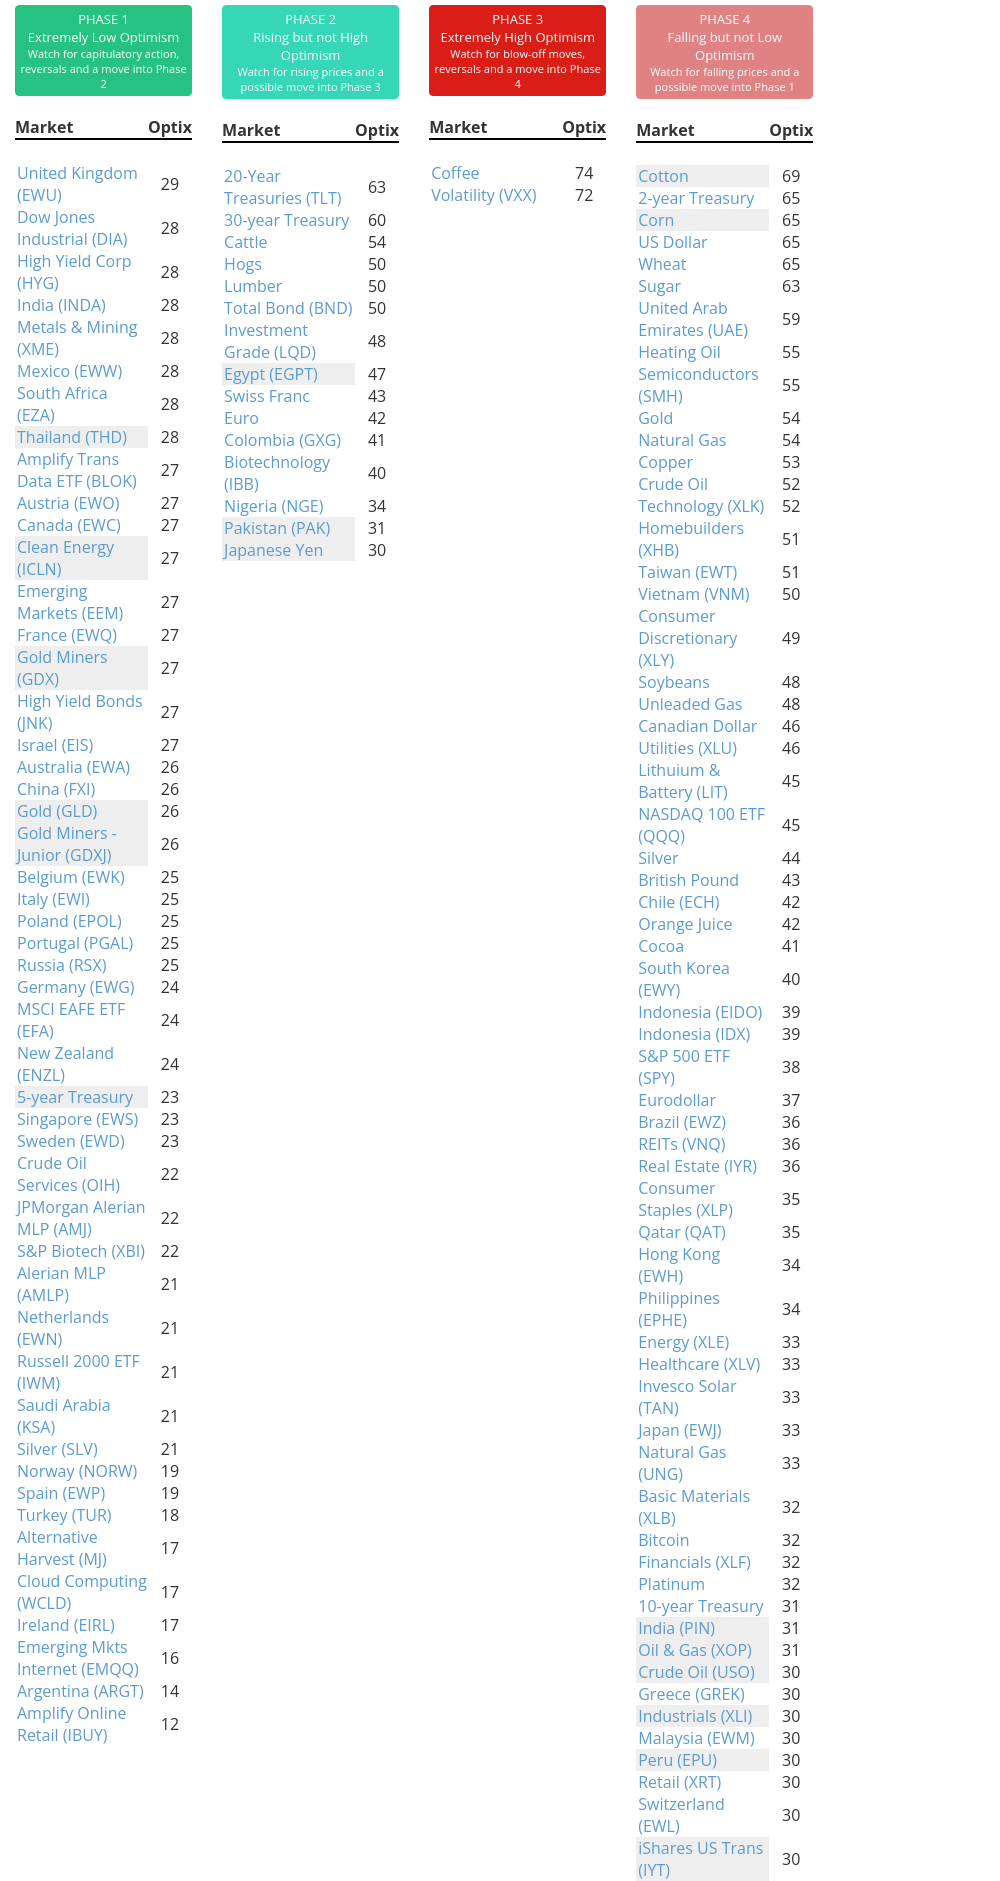
Phase Table
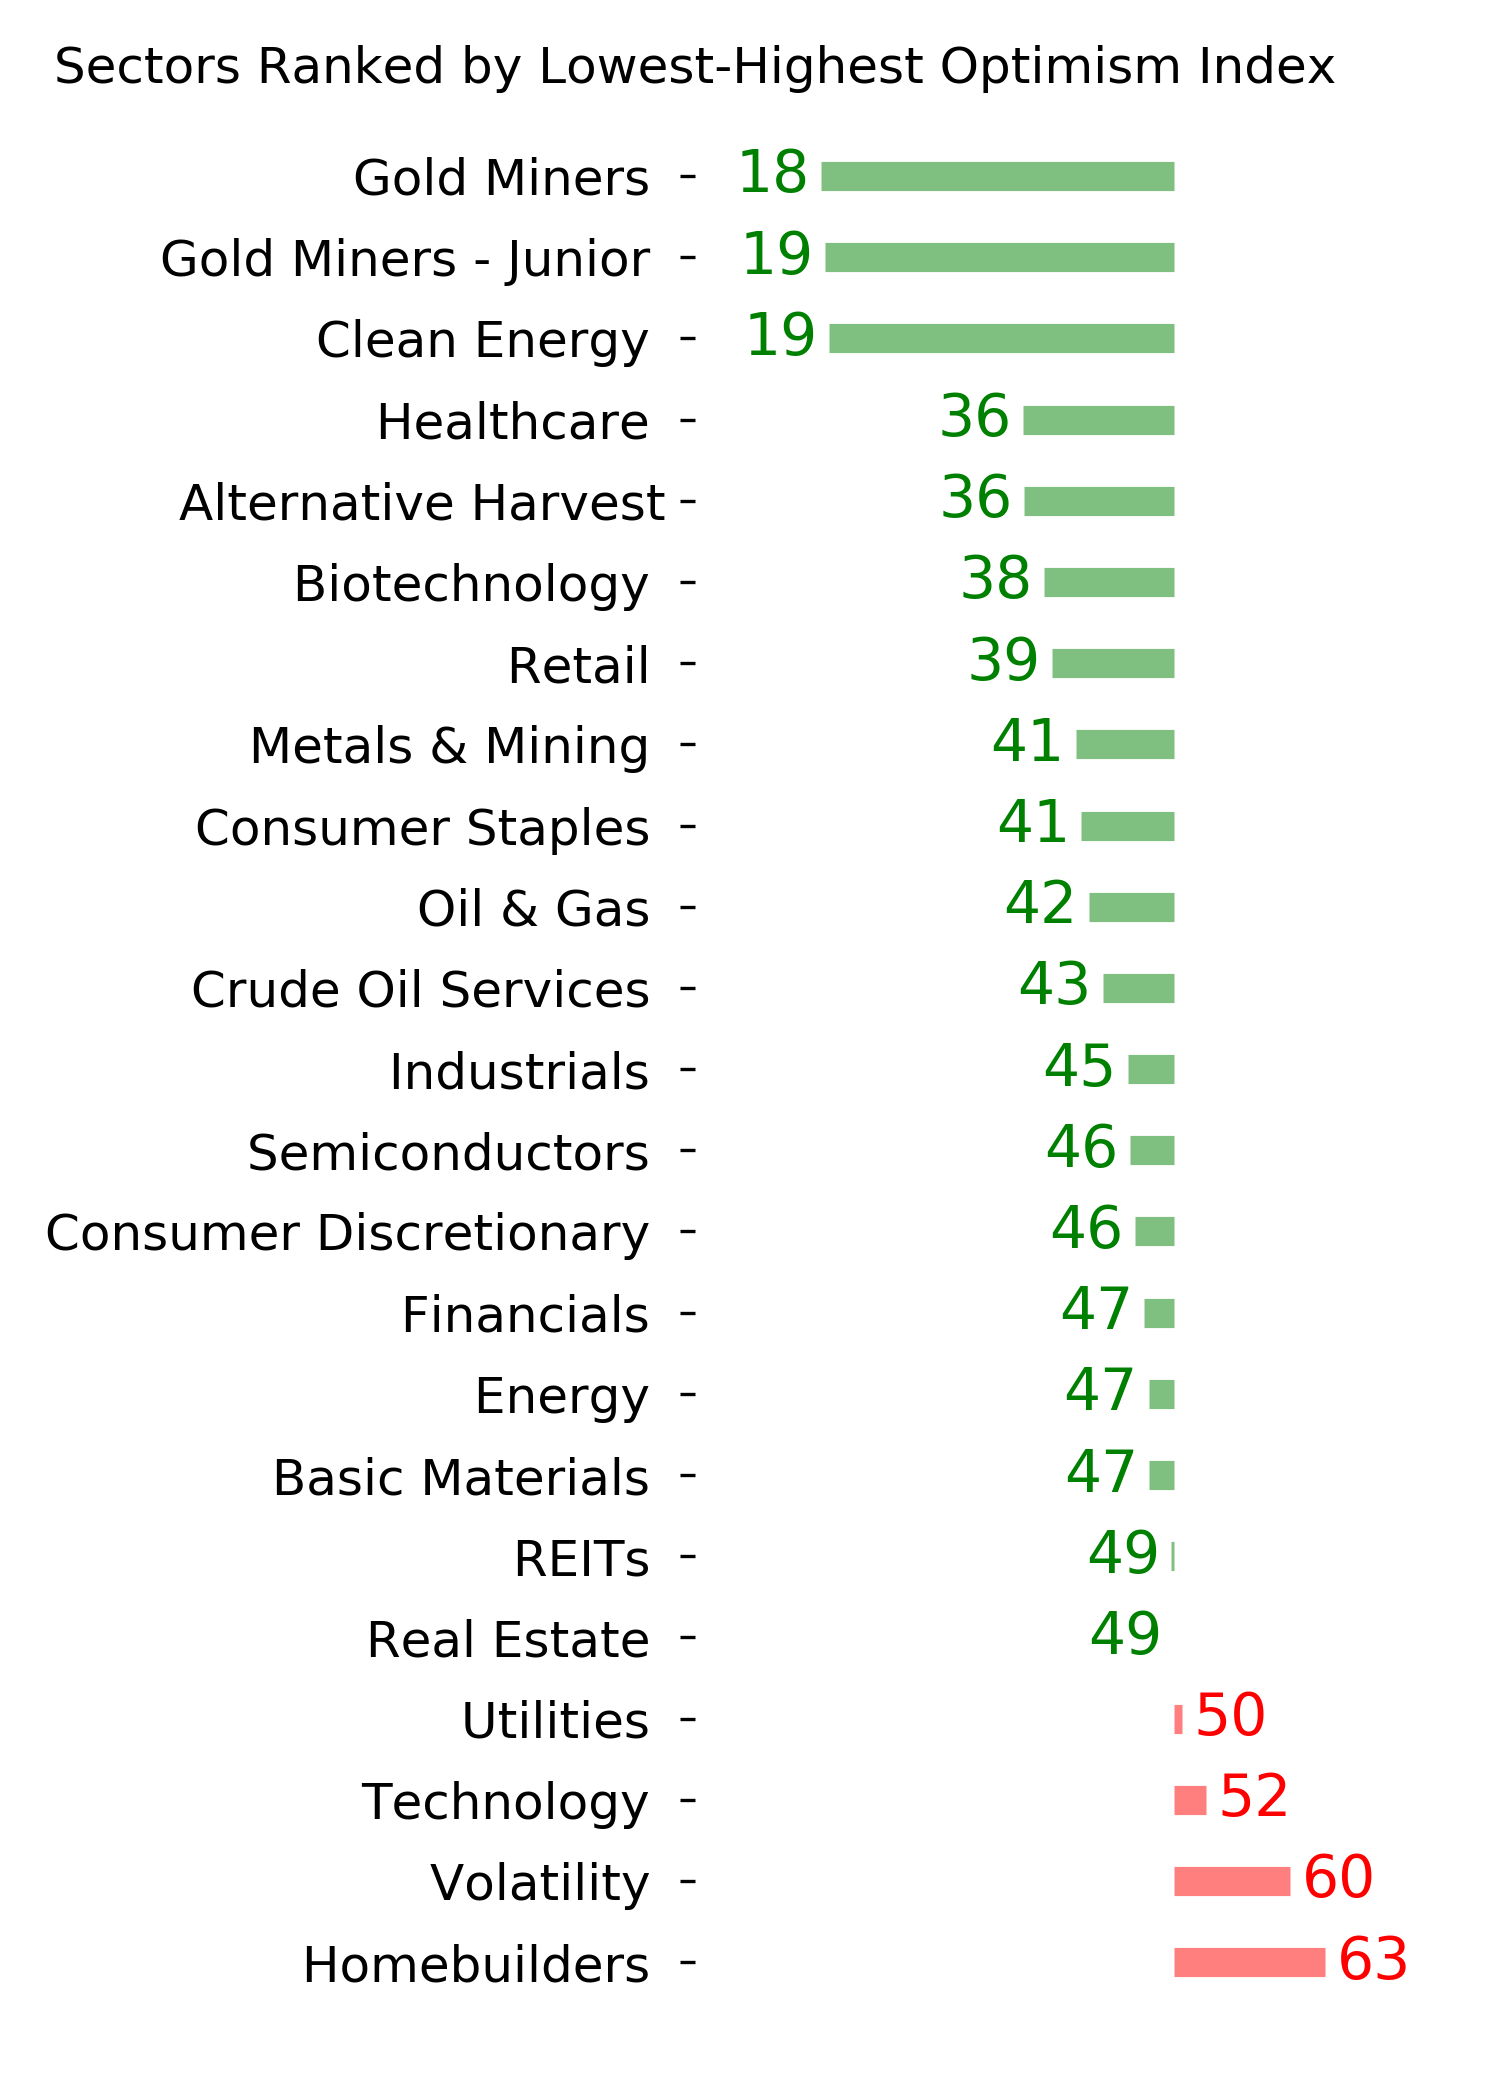
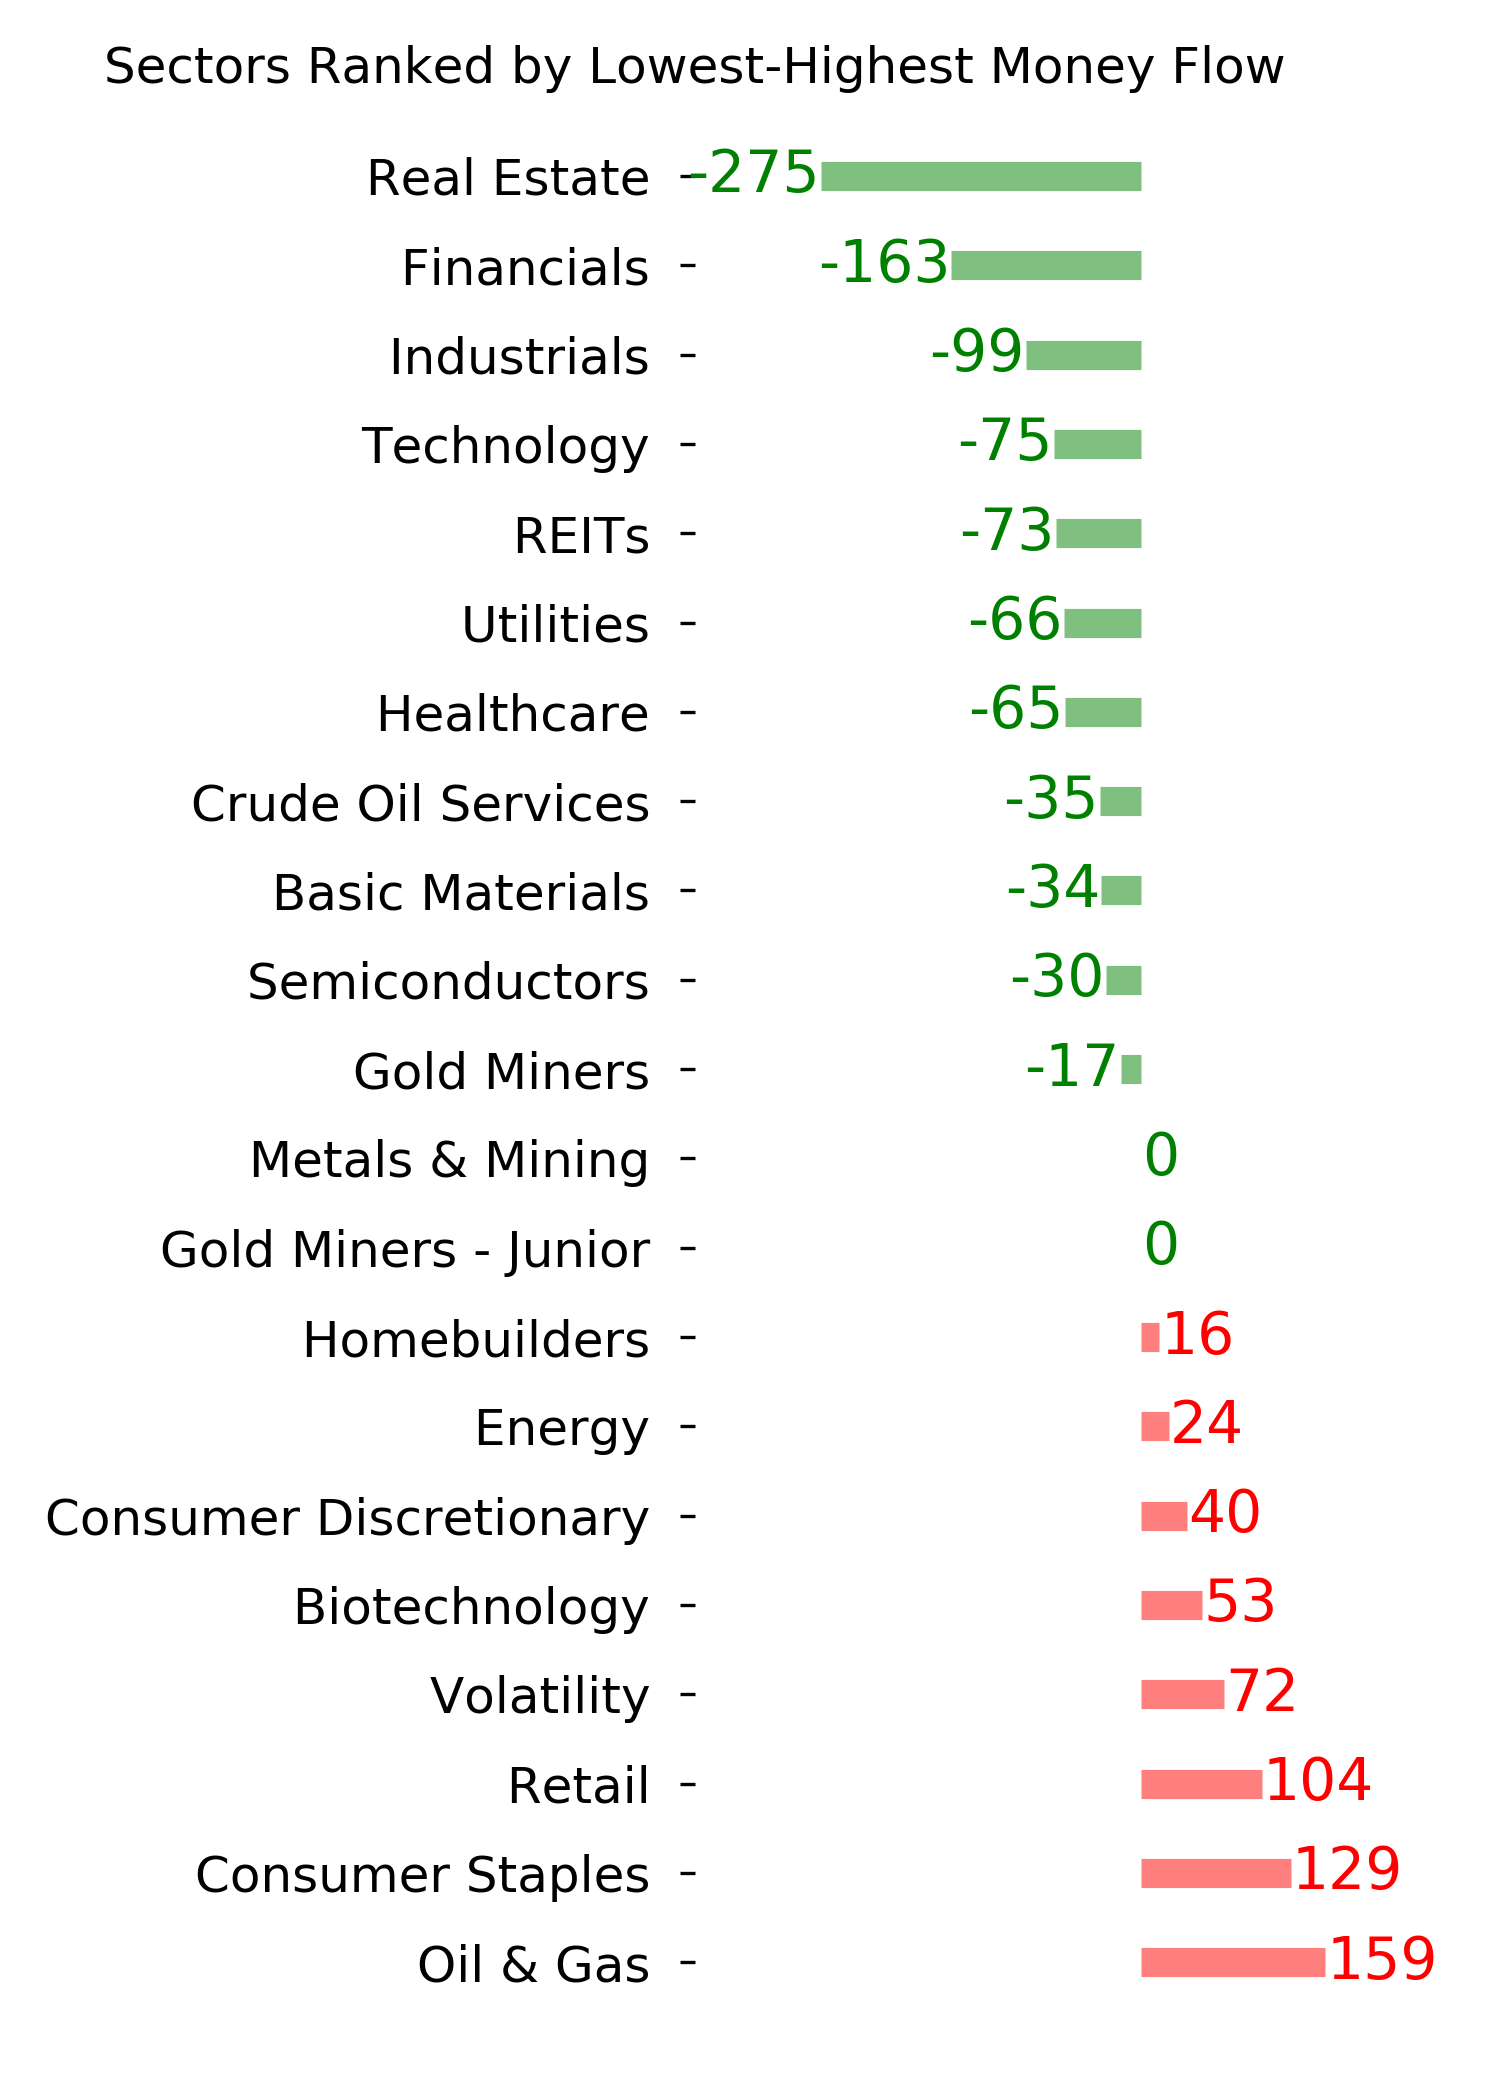
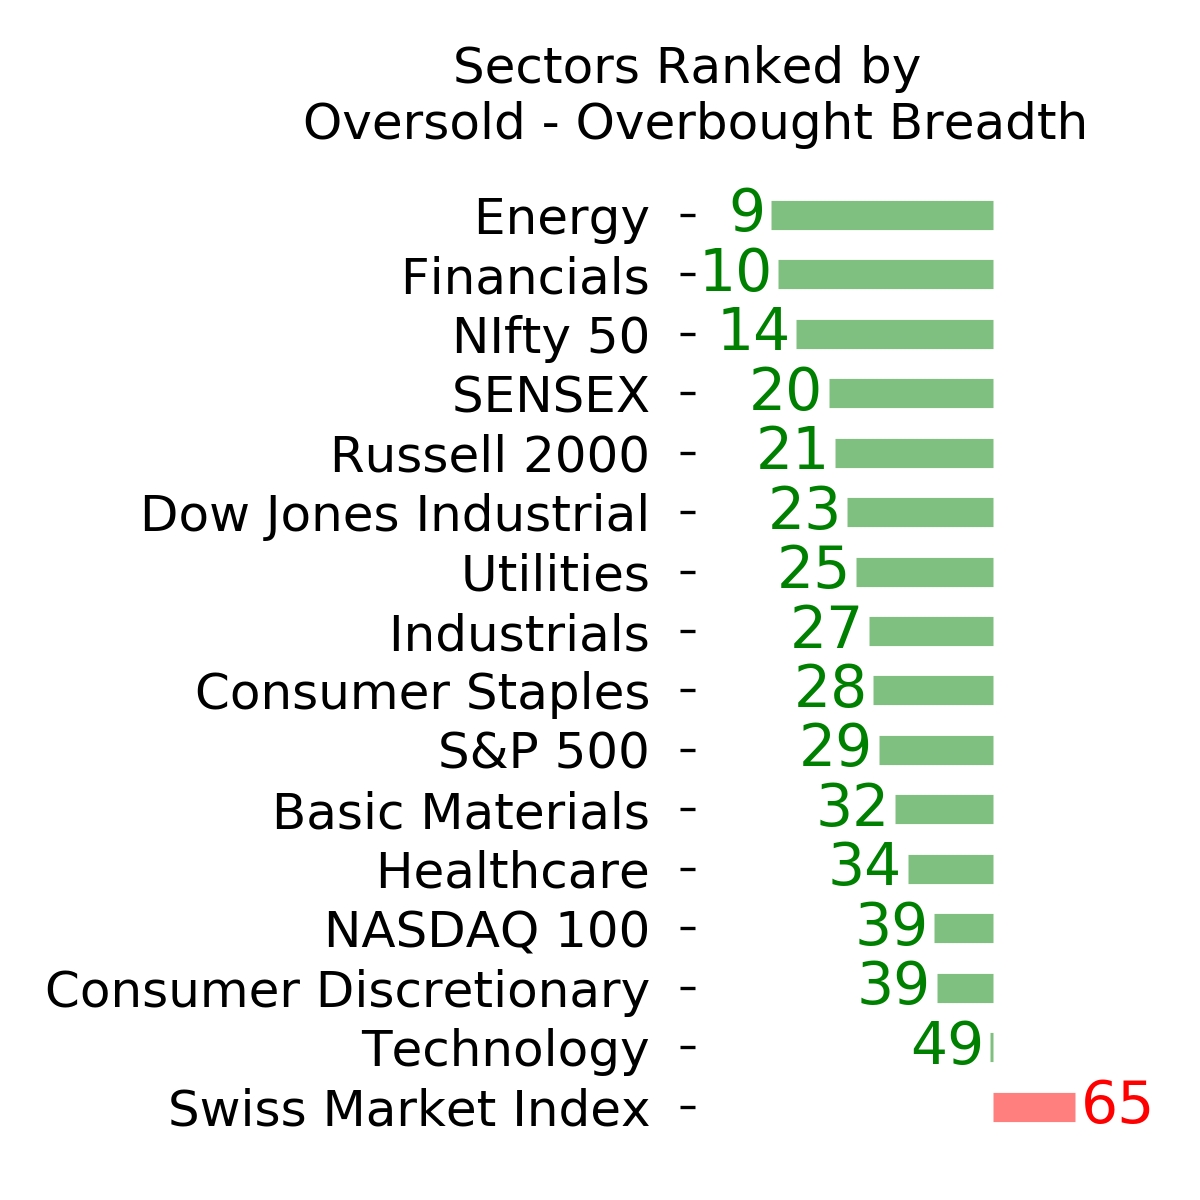
Ranks
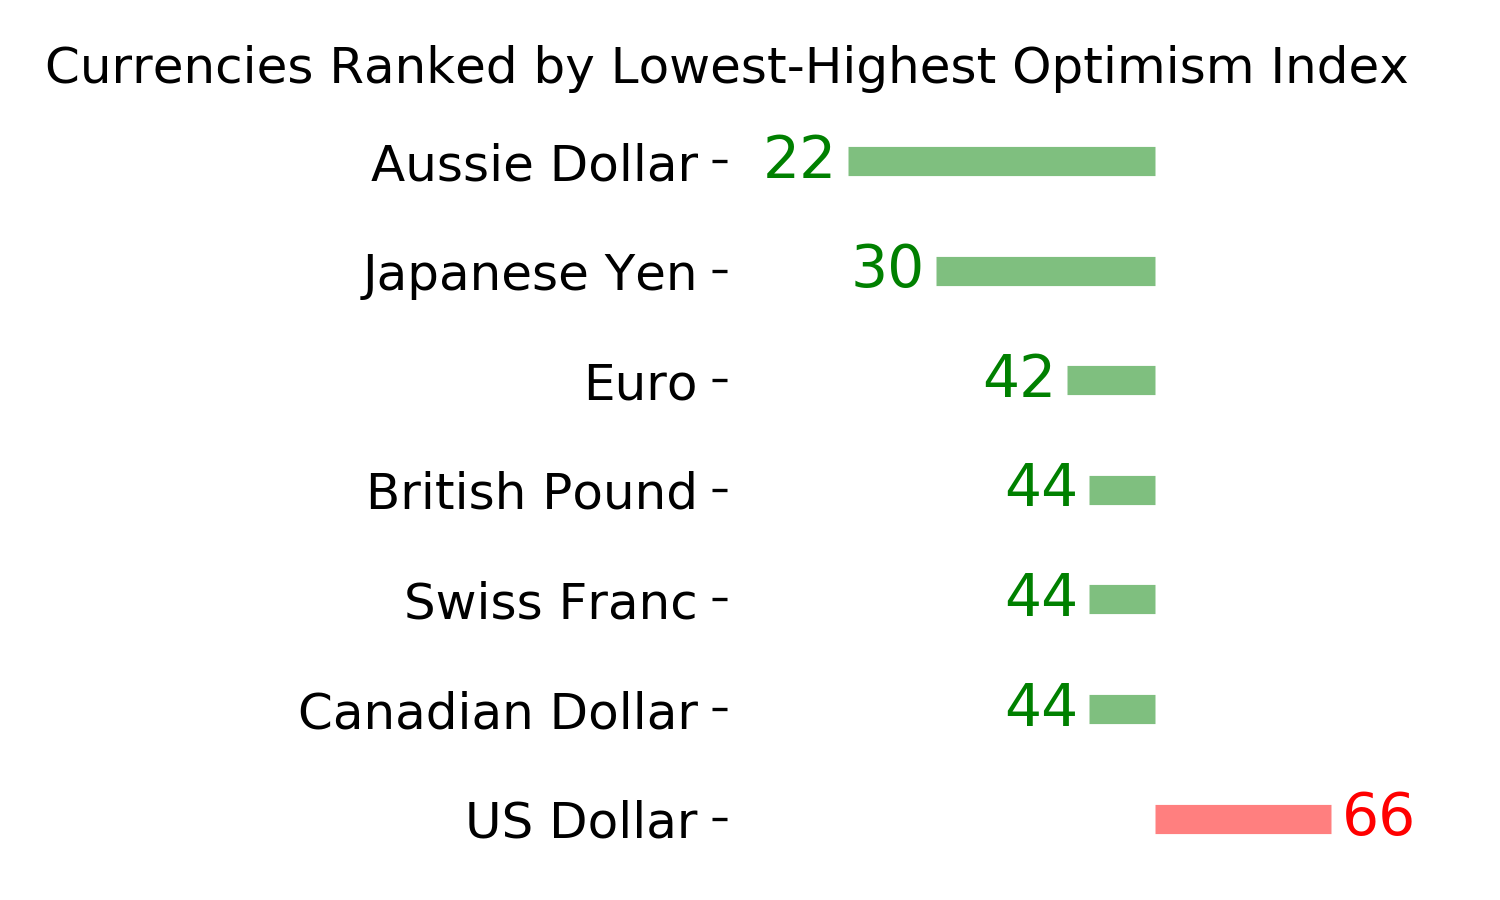
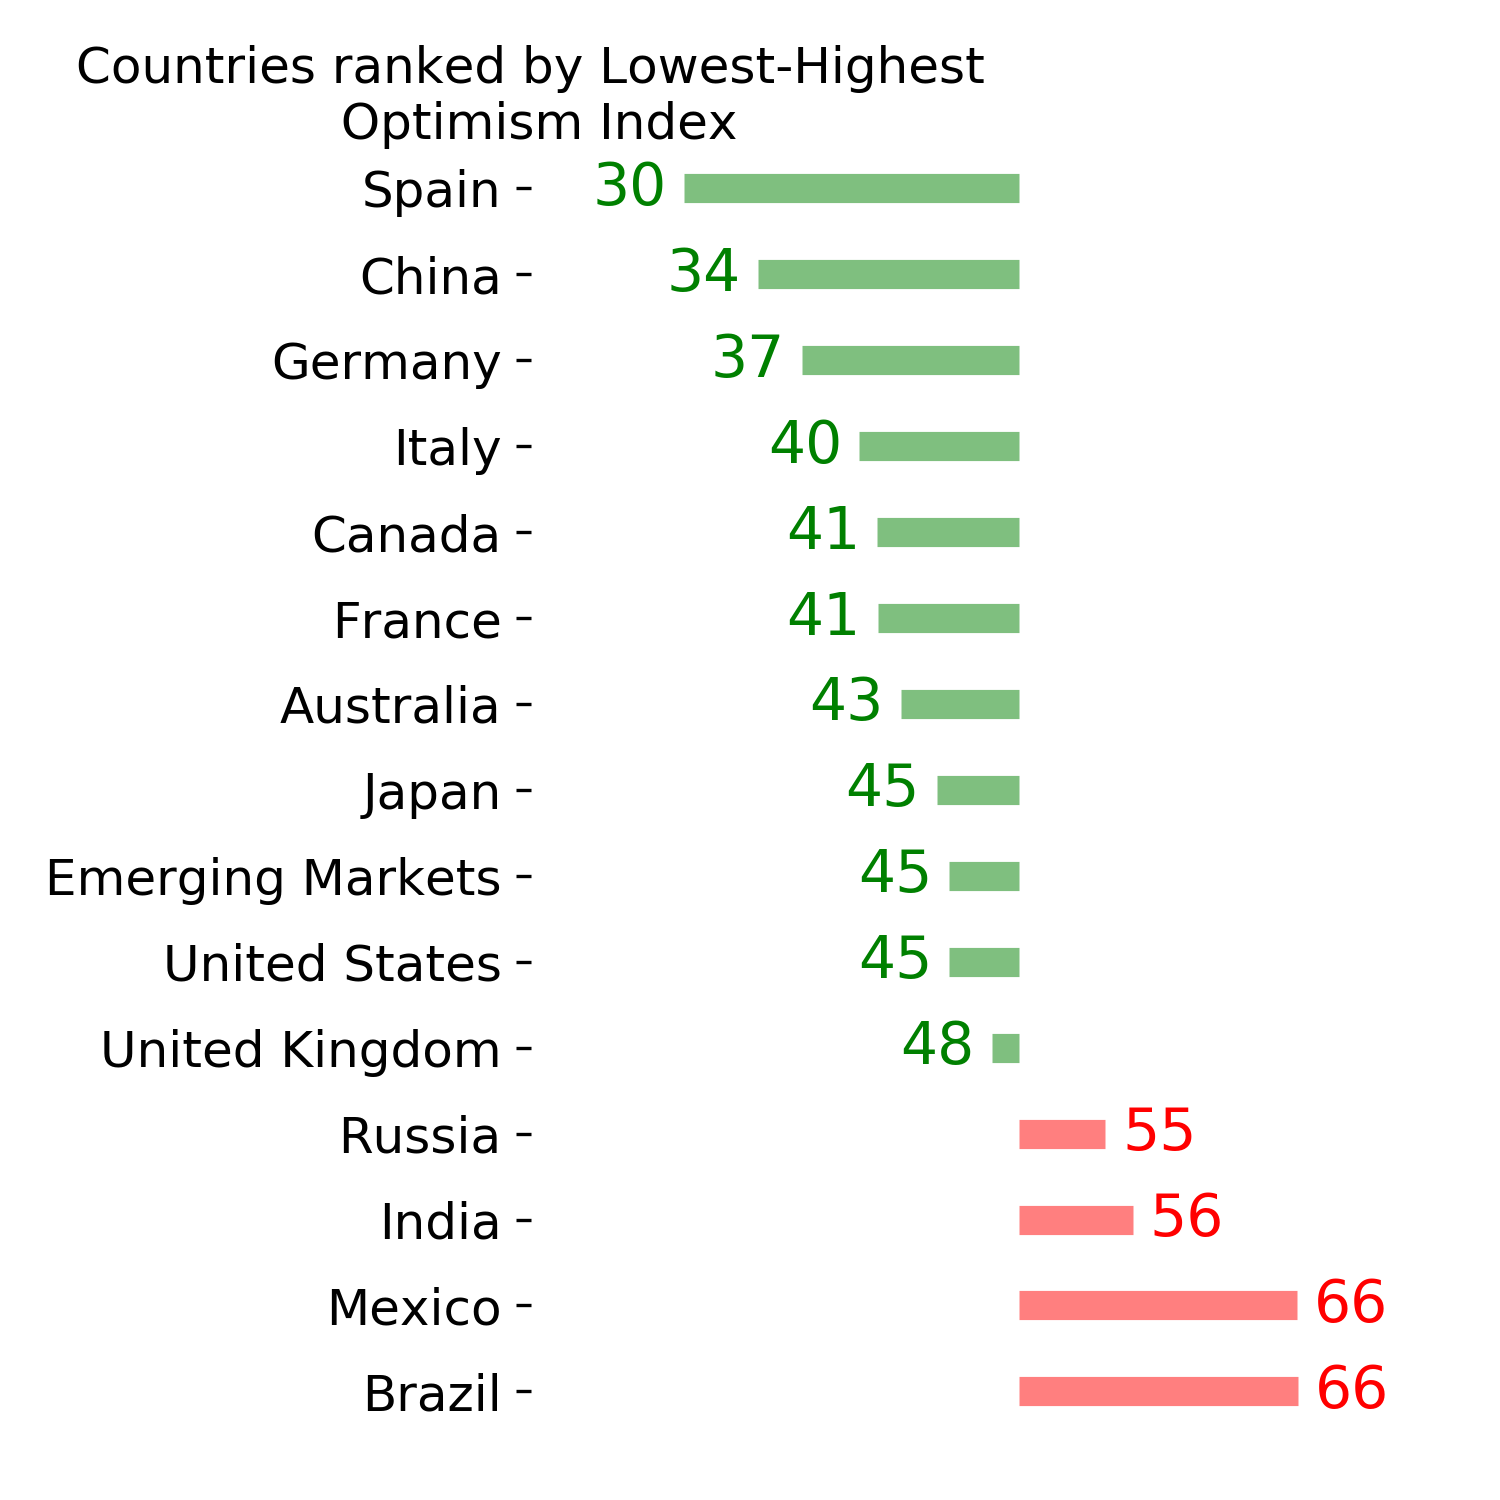
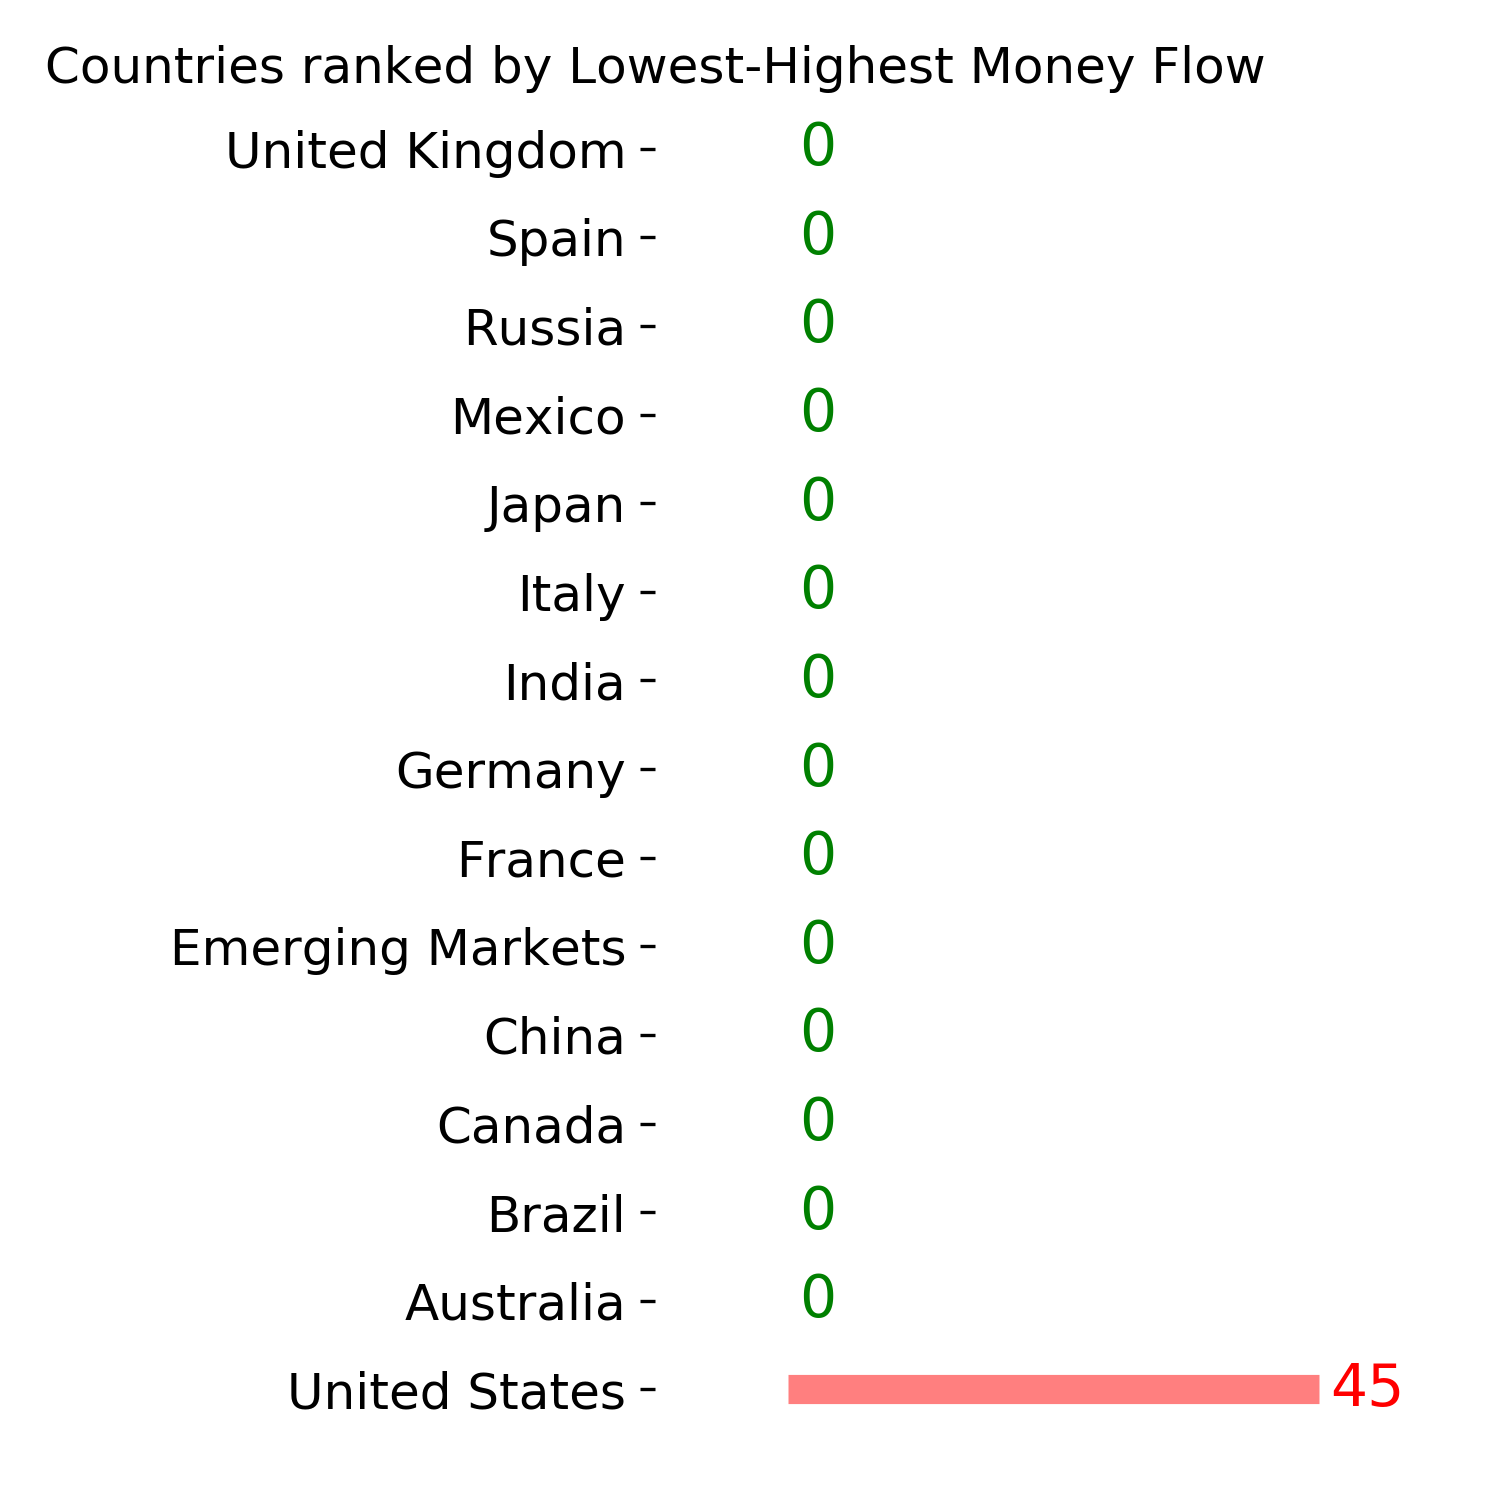
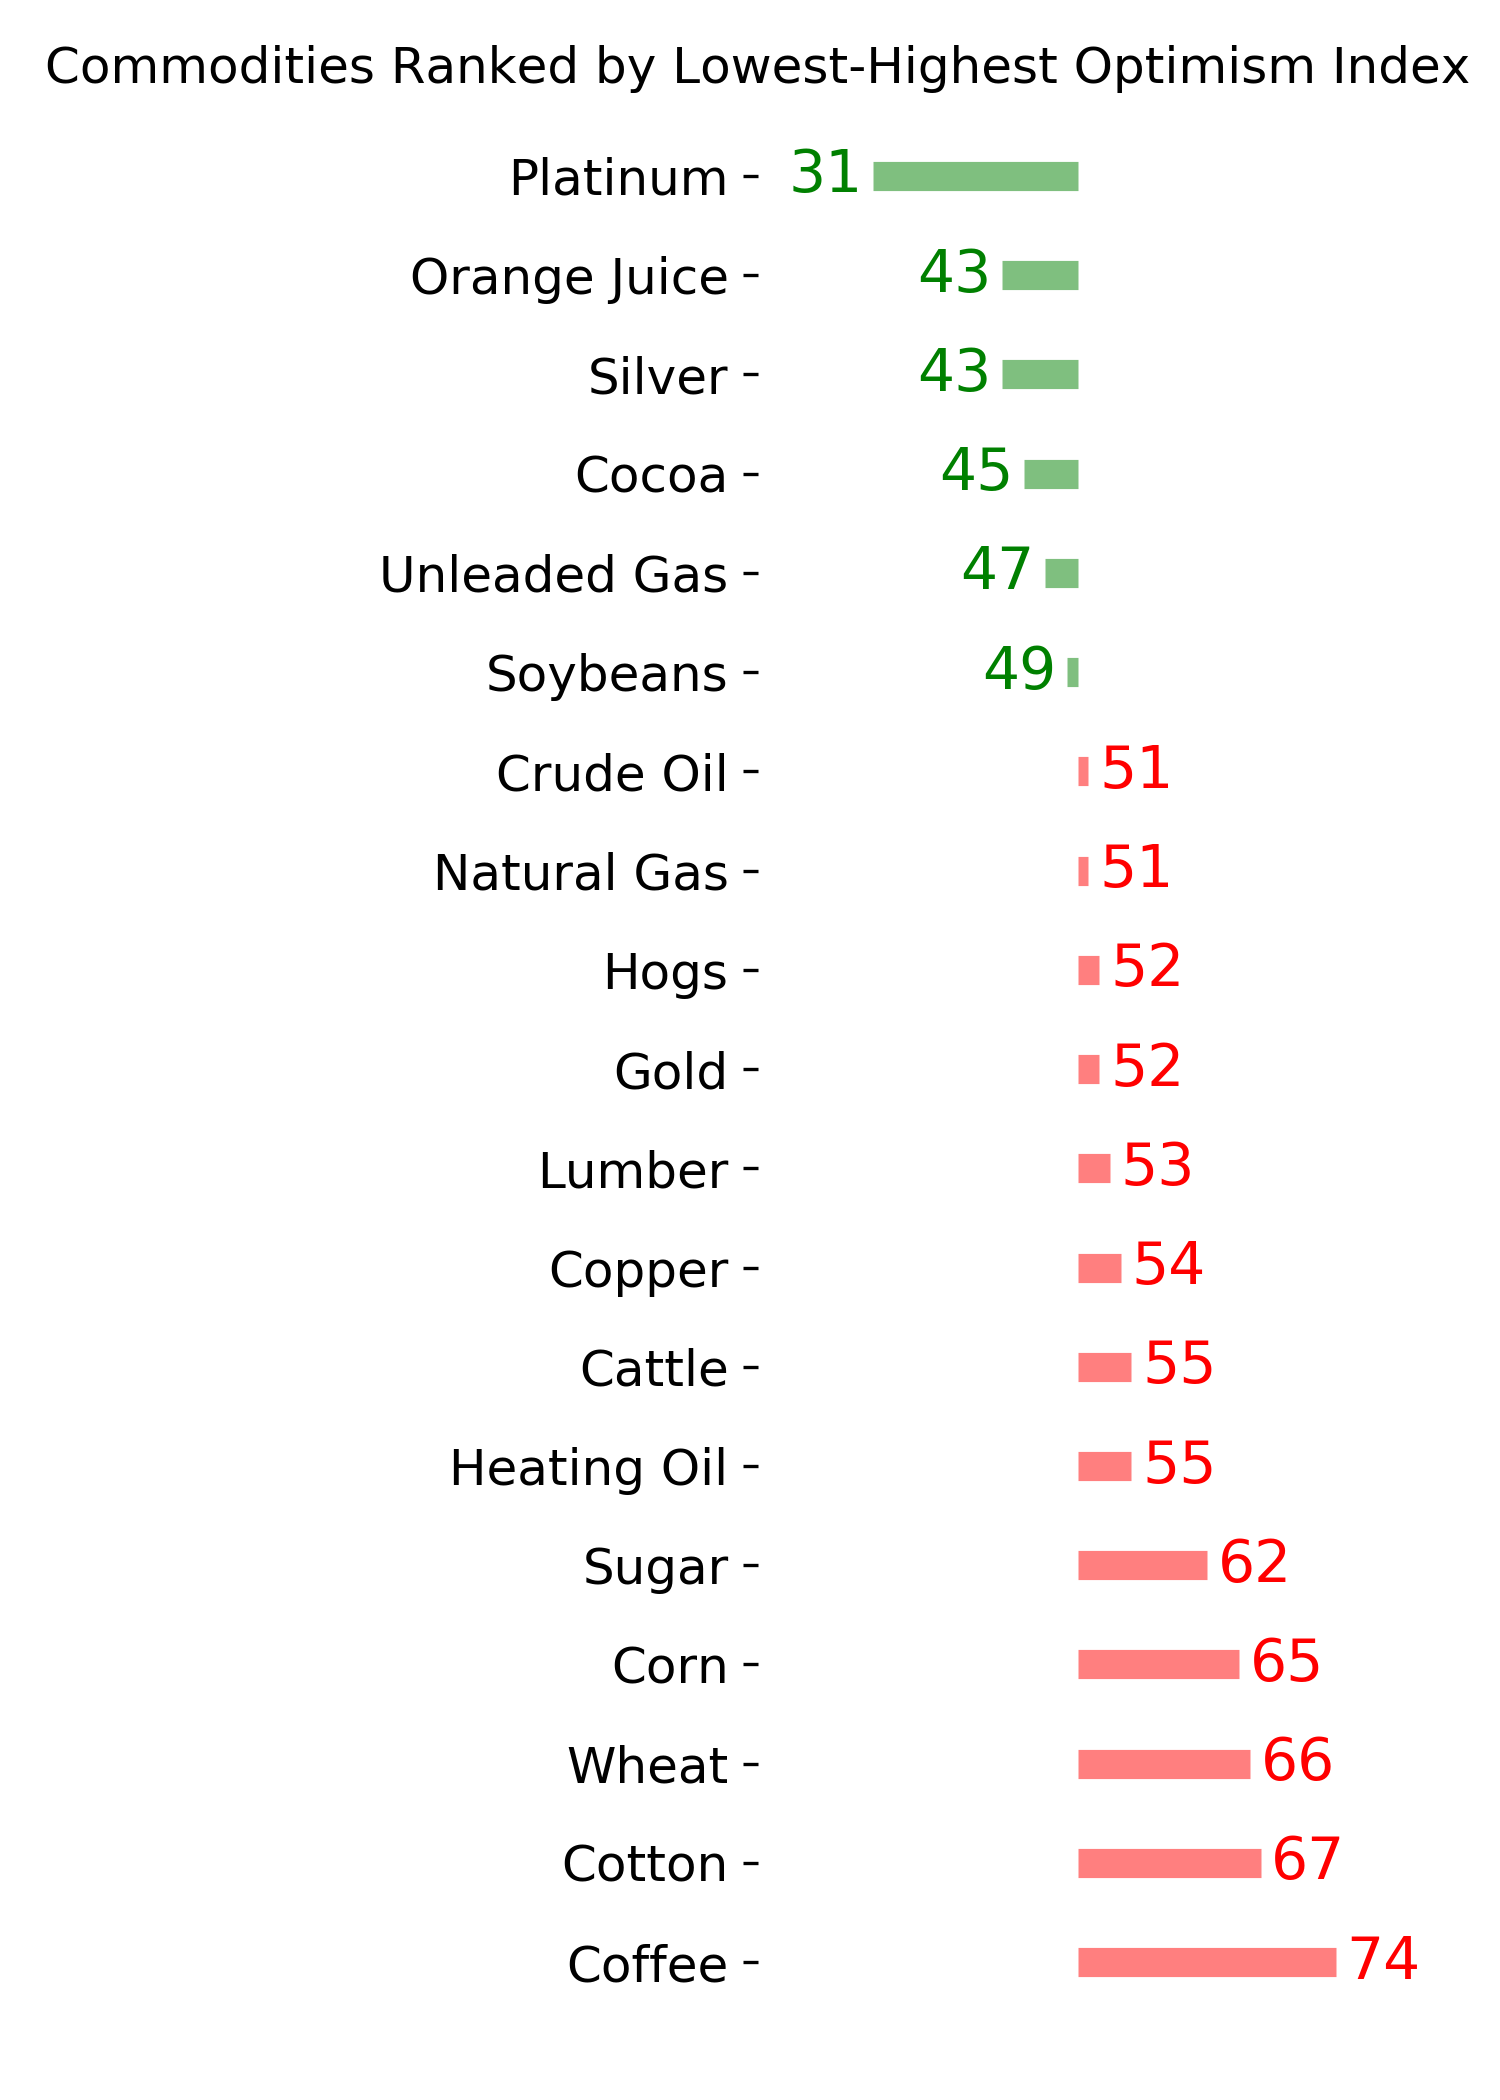
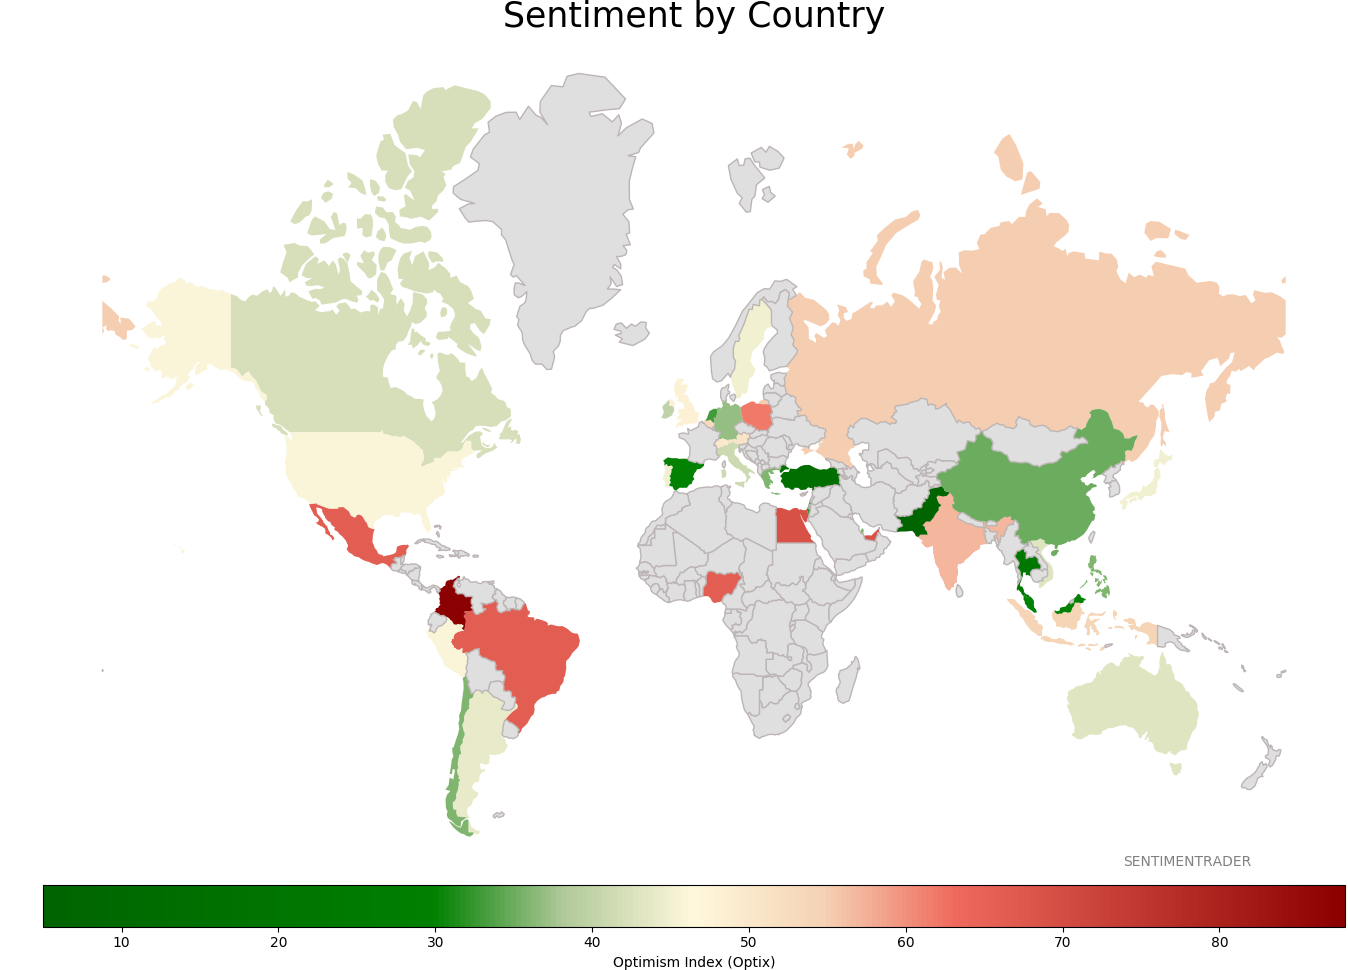
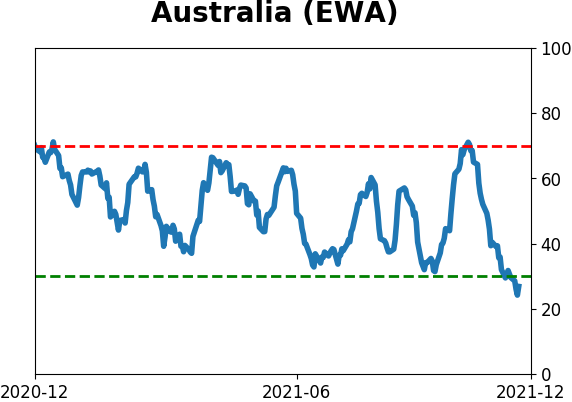
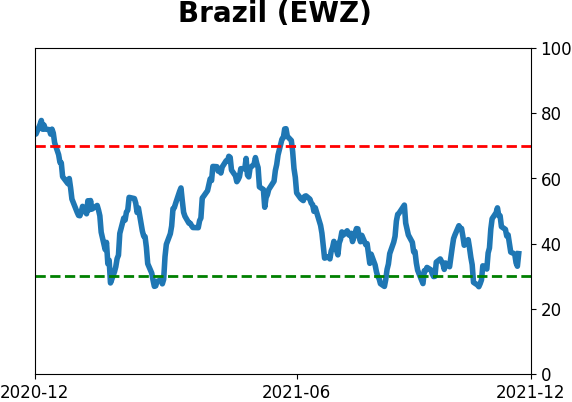
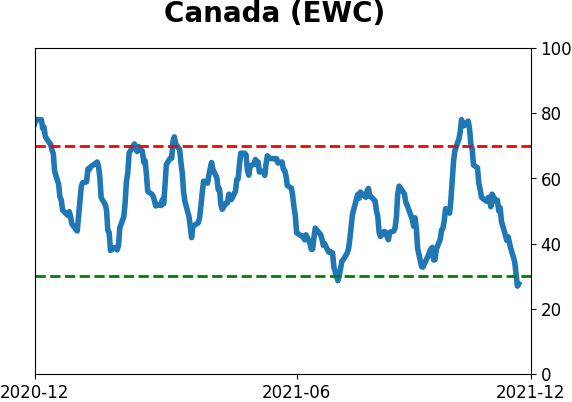
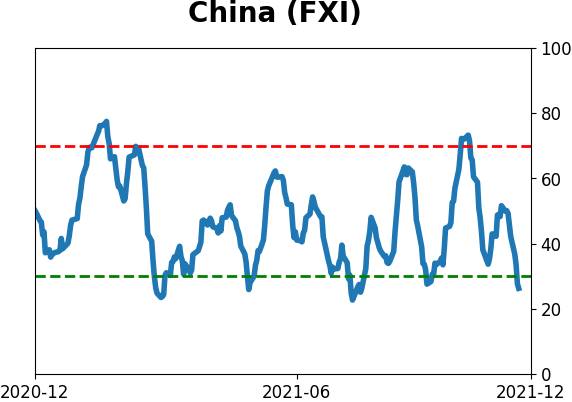
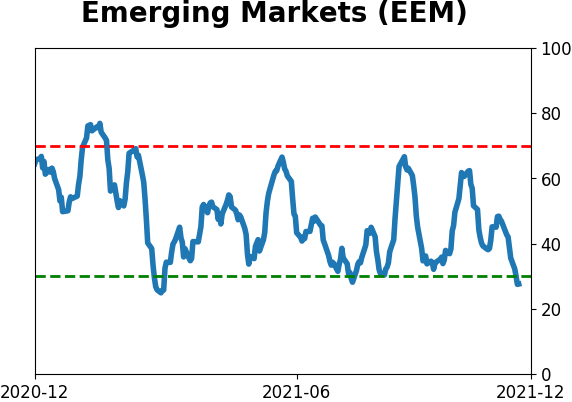
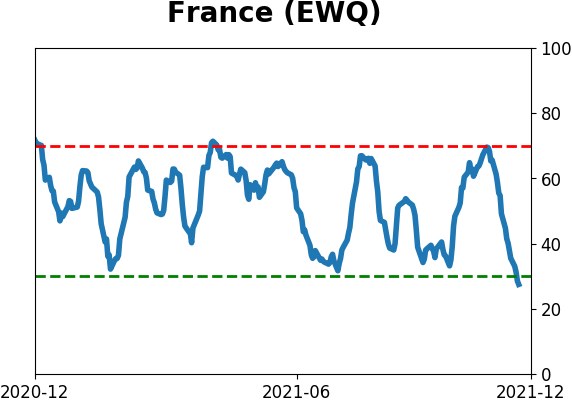
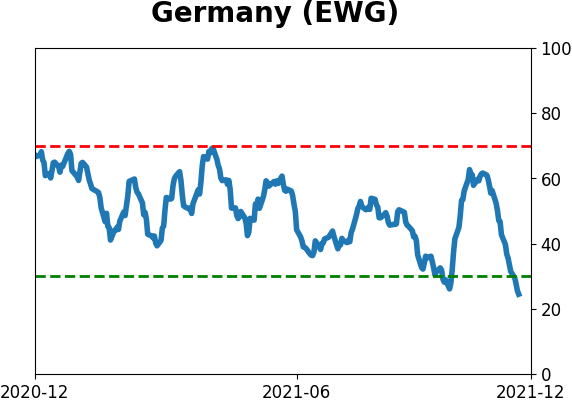
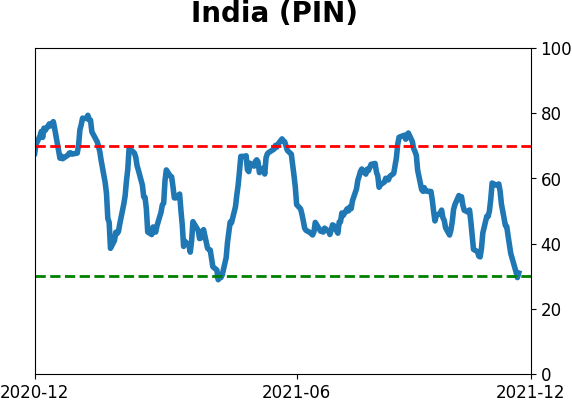
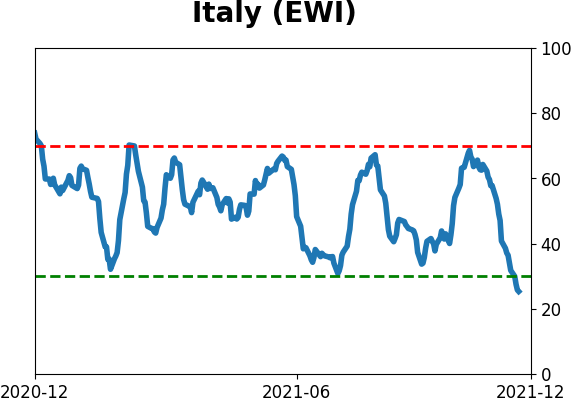
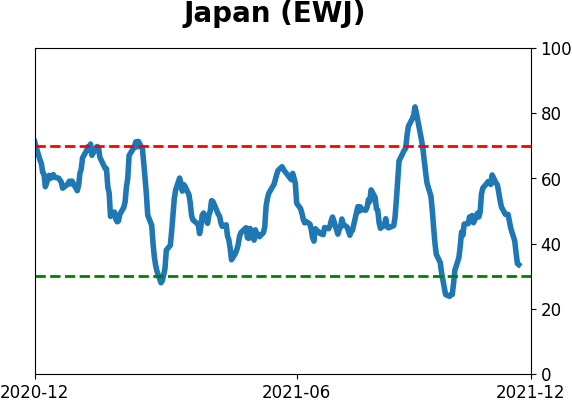
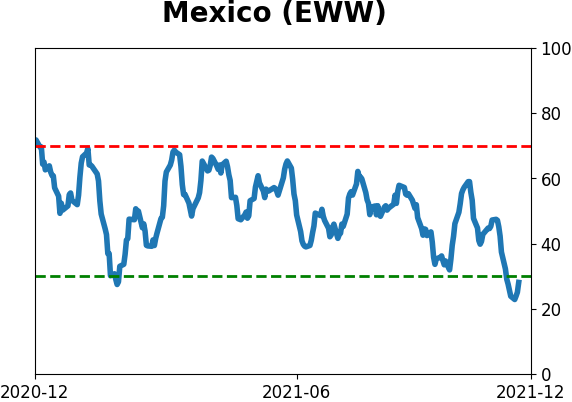
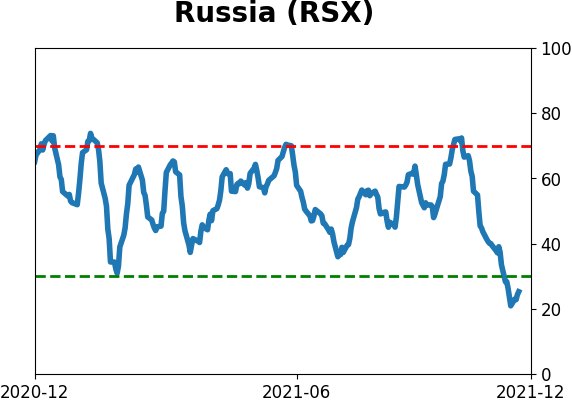
Sentiment Around The World
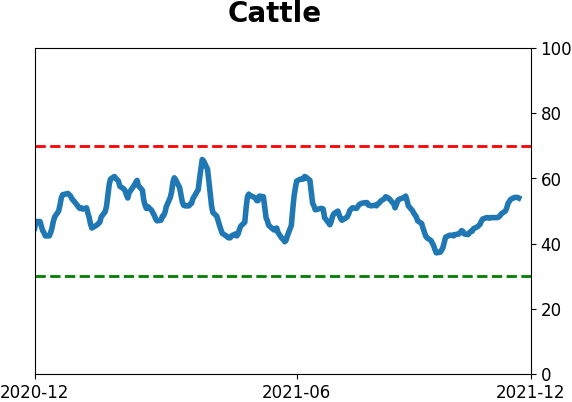
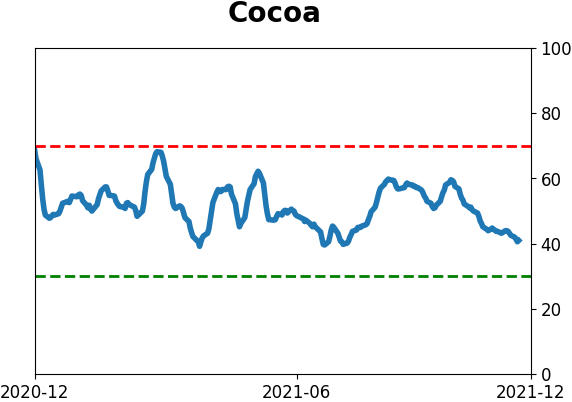
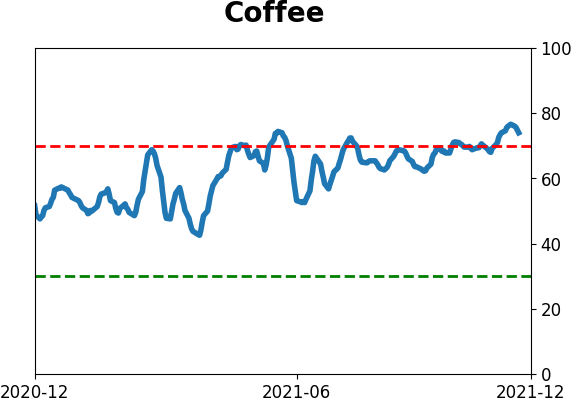
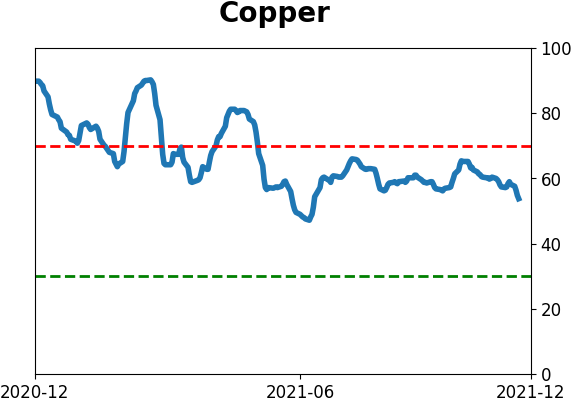
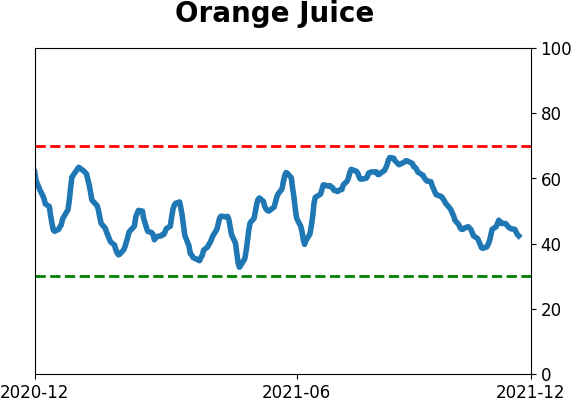
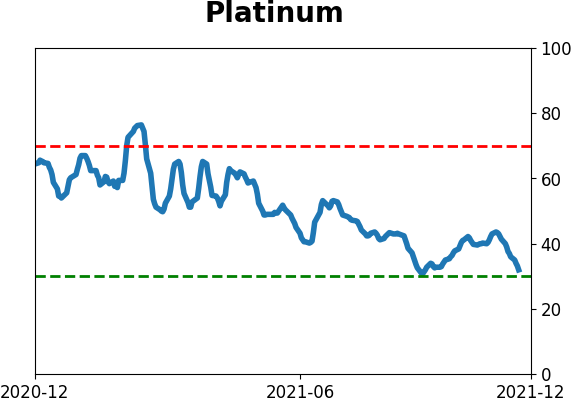
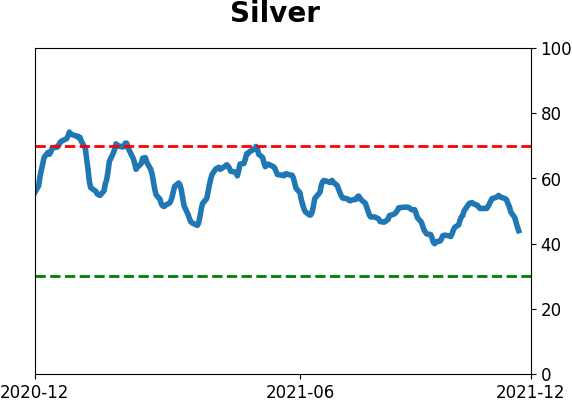
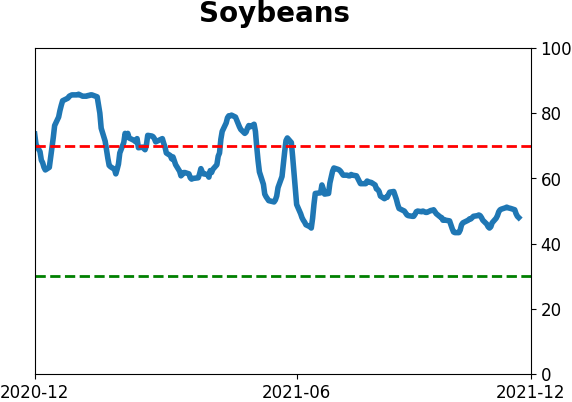
Optimism Index Thumbnails
|
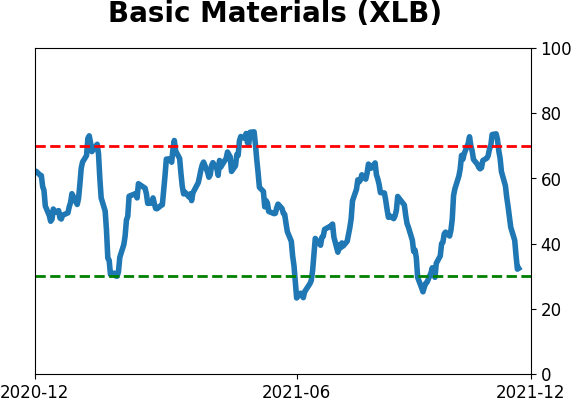
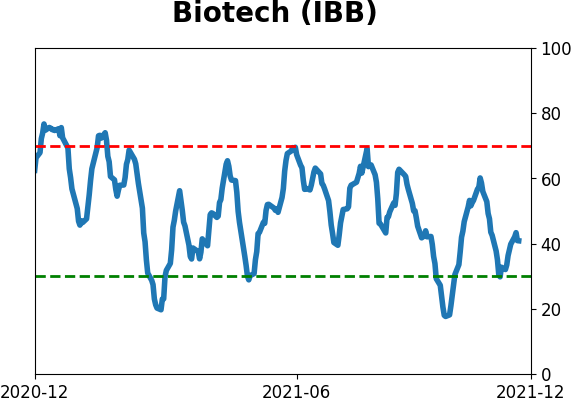
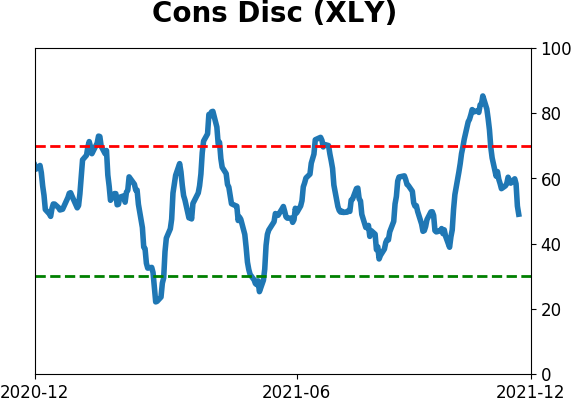
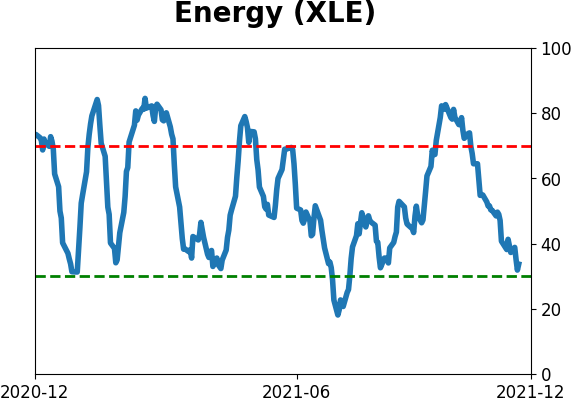
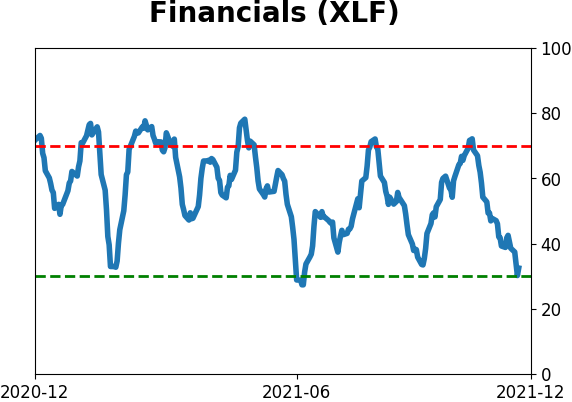
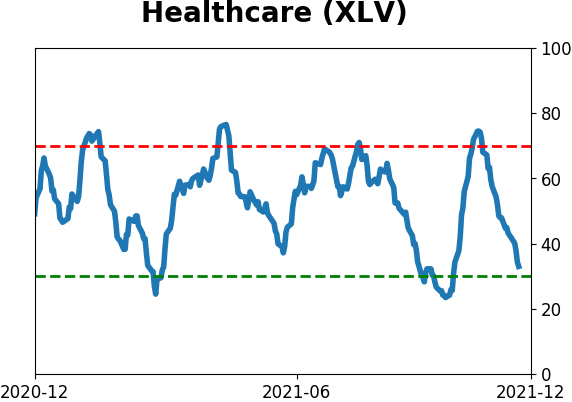
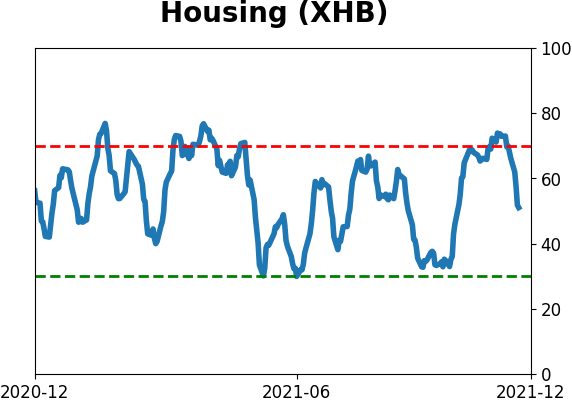
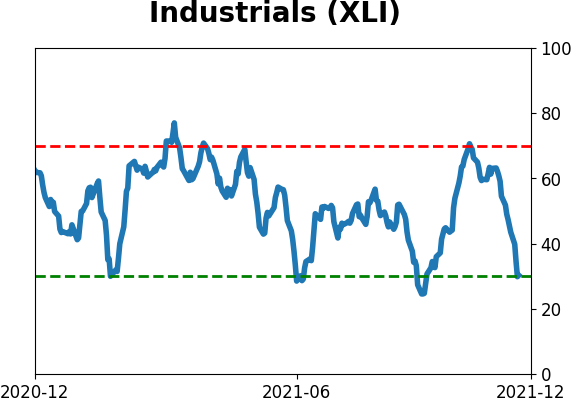
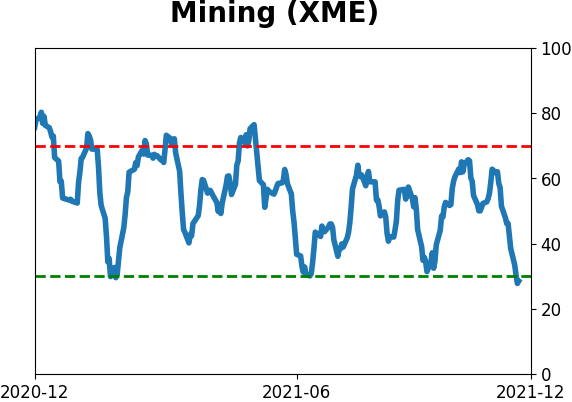
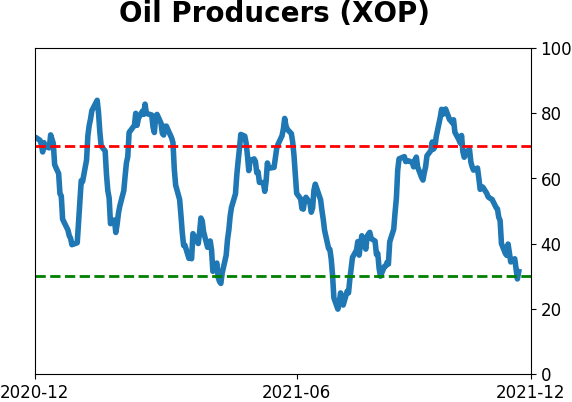
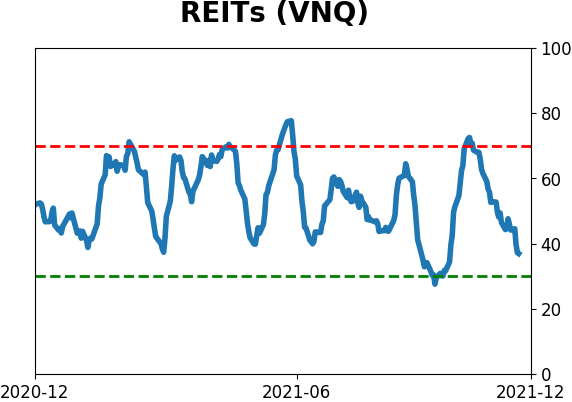
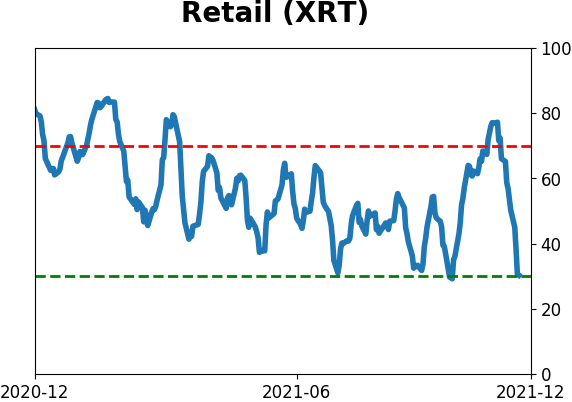
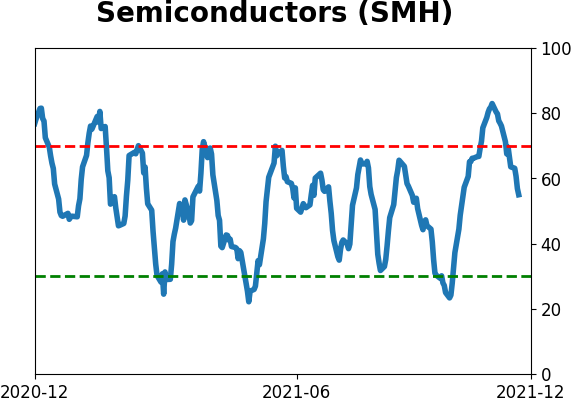
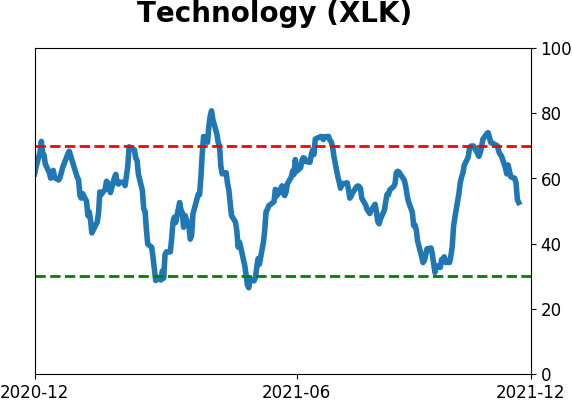
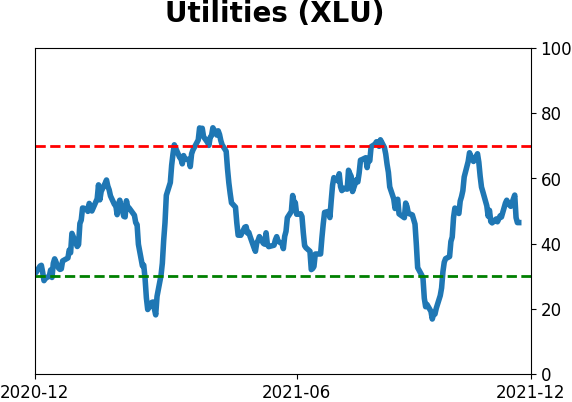
Sector ETF's - 10-Day Moving Average
|
|
|
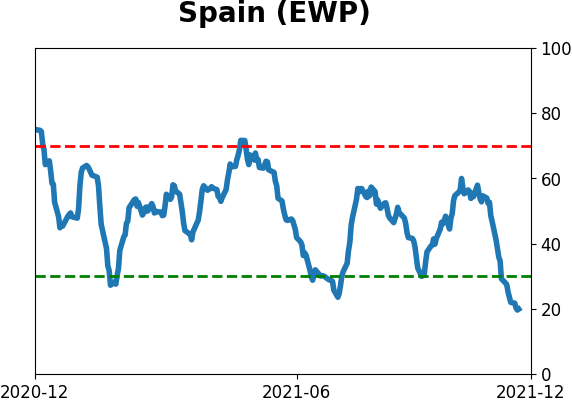
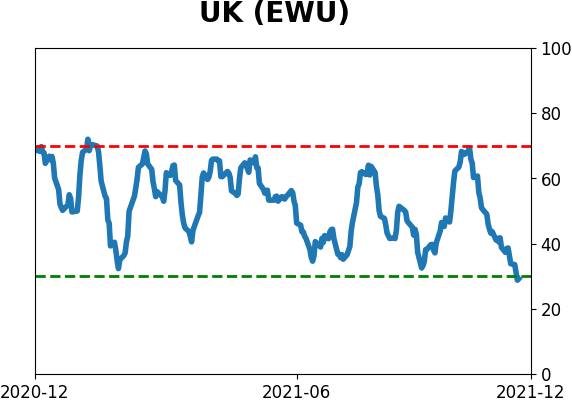
Country ETF's - 10-Day Moving Average
|
|
|
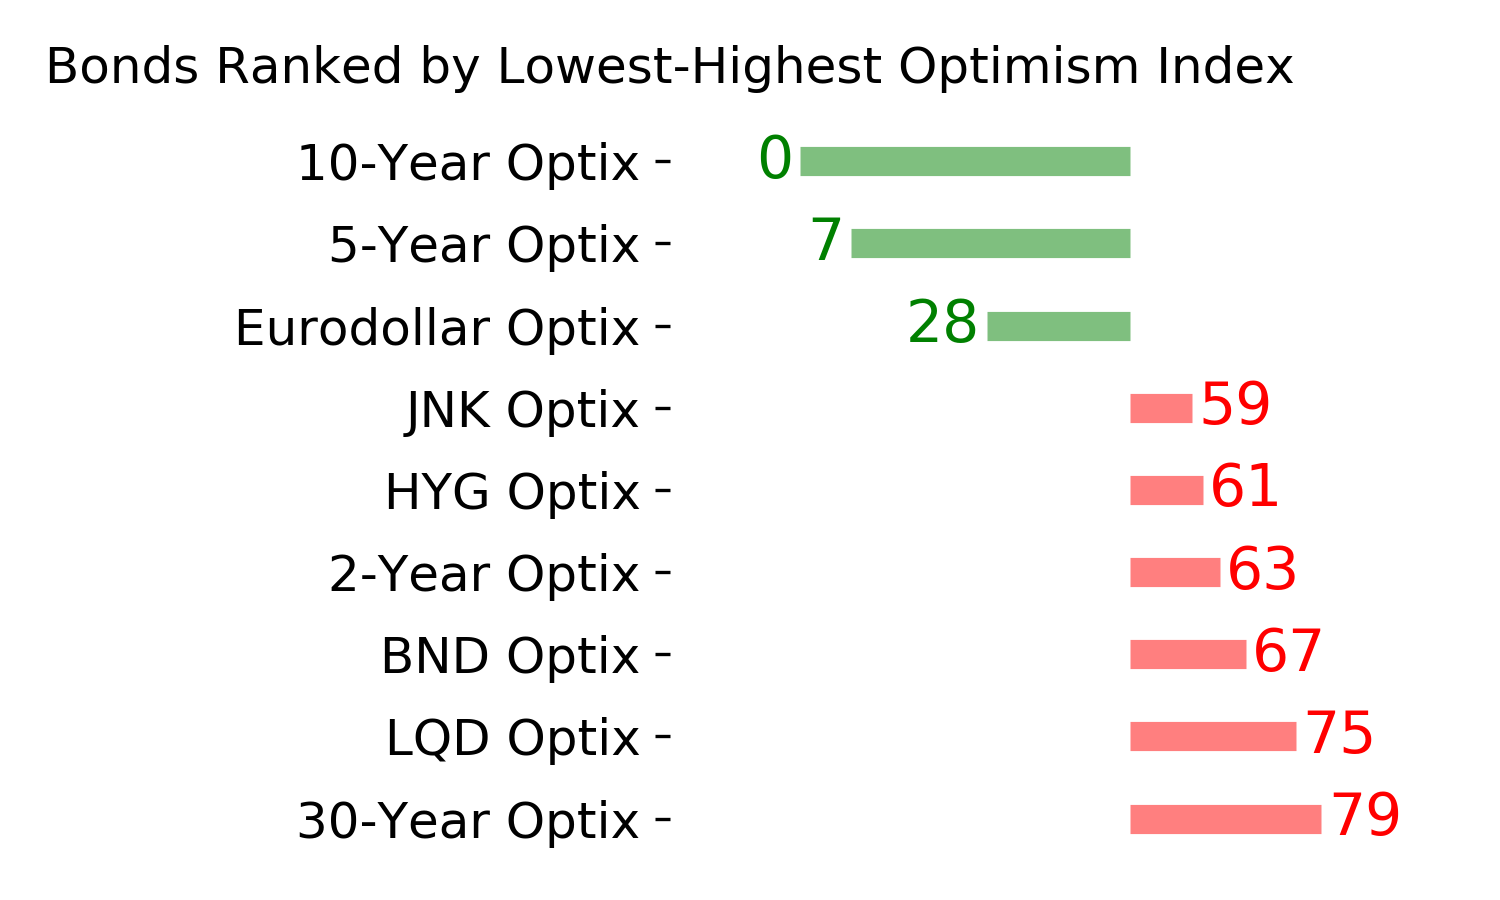
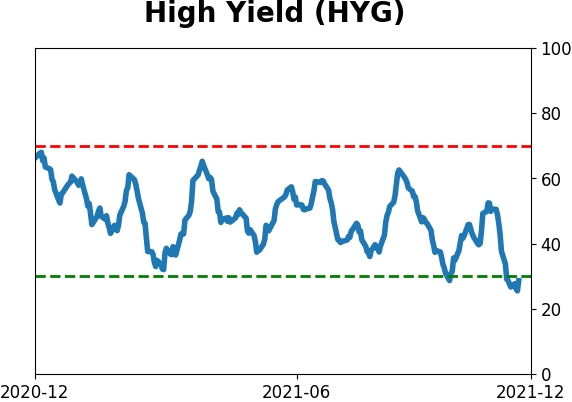
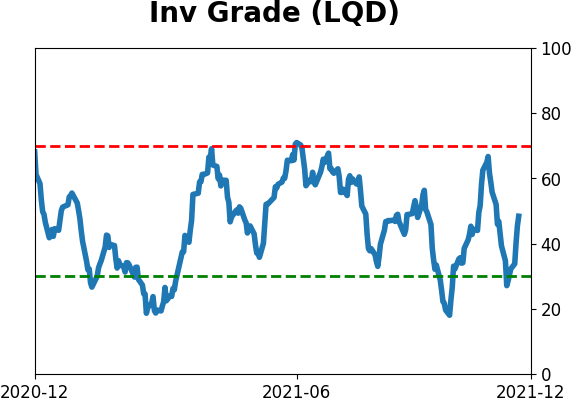
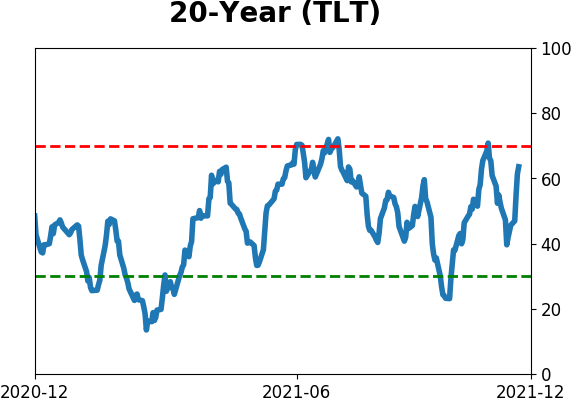
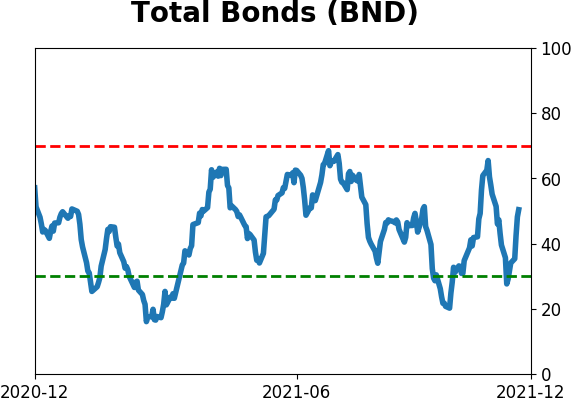
Bond ETF's - 10-Day Moving Average
|
|
|
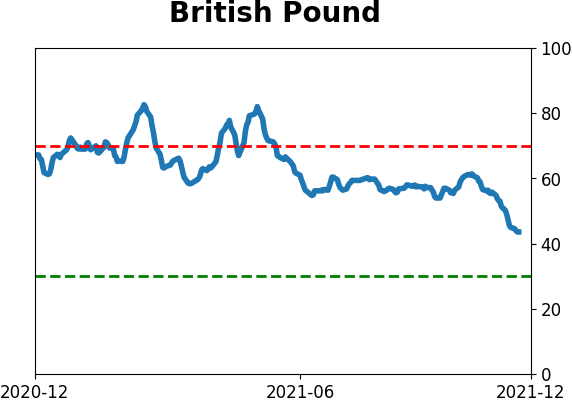
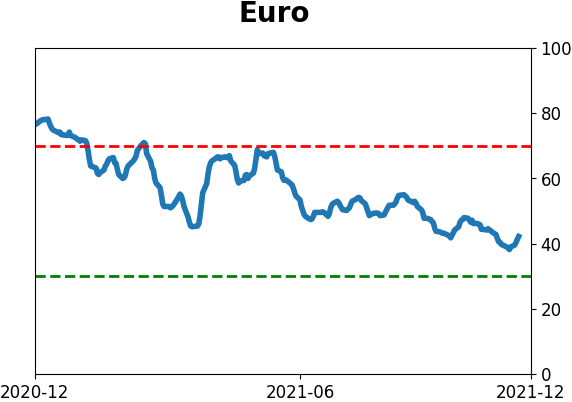
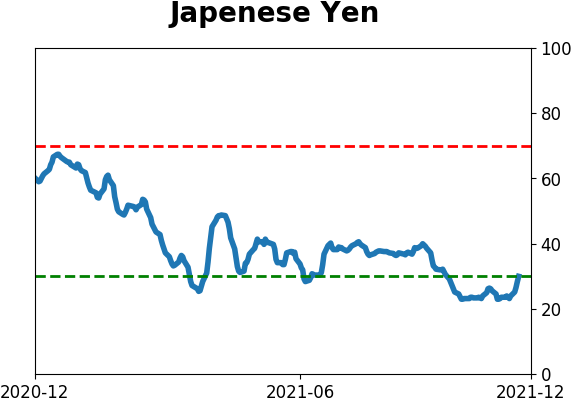
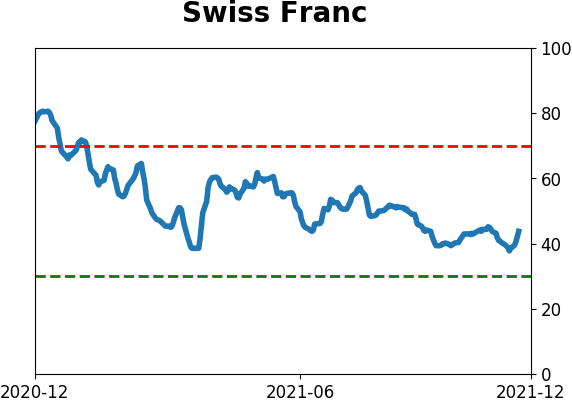
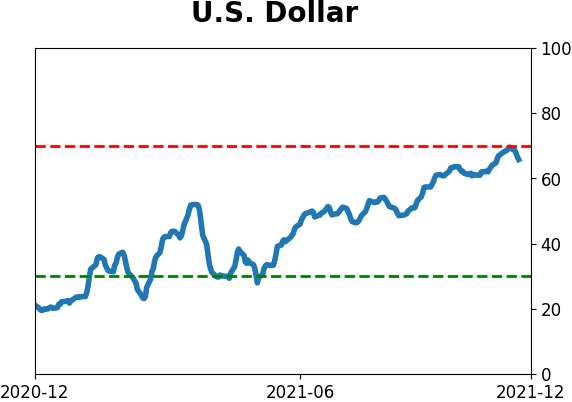
Currency ETF's - 5-Day Moving Average
|
|
|
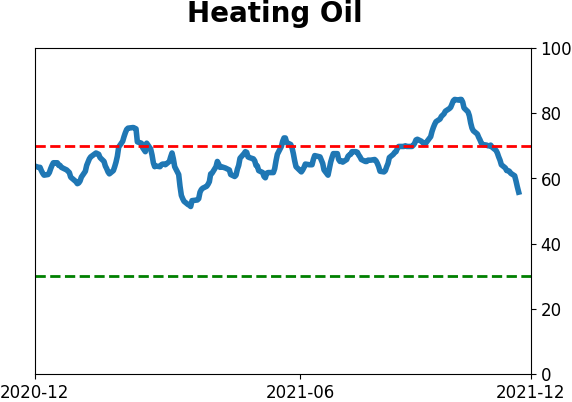
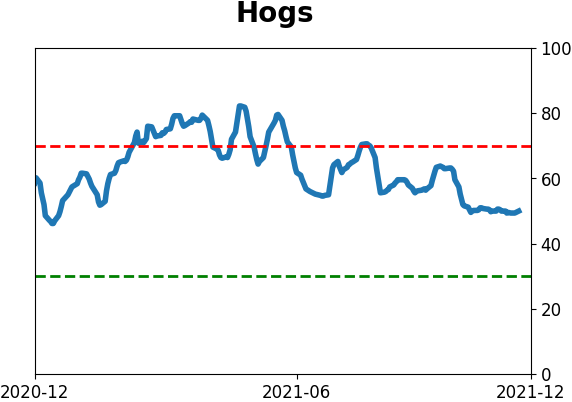
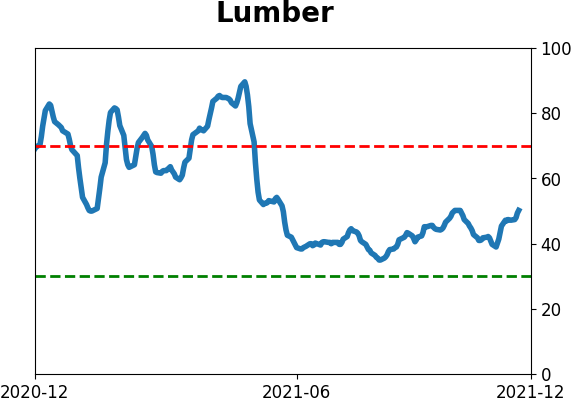
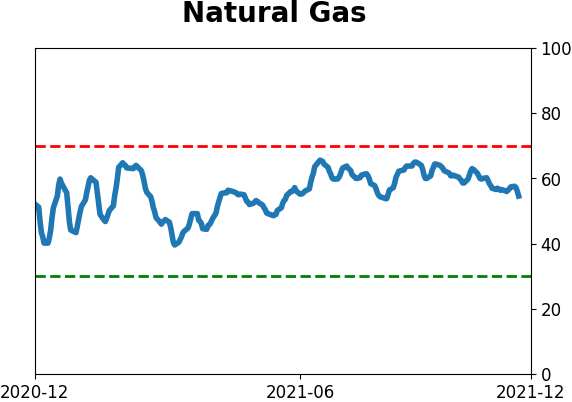
Commodity ETF's - 5-Day Moving Average
|
|