
Following the Smart Money (Part 2)
After publishing yesterday's Following the Smart Money (and all the other strategy posts here on the blog), I realized it might make sense to use the entire capital available to the strategy rather than just using 1,000 shares per trade.
Yesterday's post described using the Smart Money model to trade a Long only strategy. This strategy resulted in 2.91% annual return over a little over 17 years.
If we take the same strategy but use the entire account value to calculate the number of shares to purchase, the returns increase significantly.
Trading Rules
- Trading dates are Sept 16 1996 to Oct 21 2016 (entire history of the model)
- Long only
- No Margin. Account size is $250K.
- Trading SPY ETF - calculate the amount of shares to purchase based on available capital.
- Commission of $10 per trade
- $0.01 per share slippage
- Go long when:
- Smart Money closes above 0.70 (Excessive Optimism)
- Close when:
- Smart Money closes below 0.30 (Excessive Pessimism)
- All orders are entered at the open of the next day’s trading session after a signal is given.
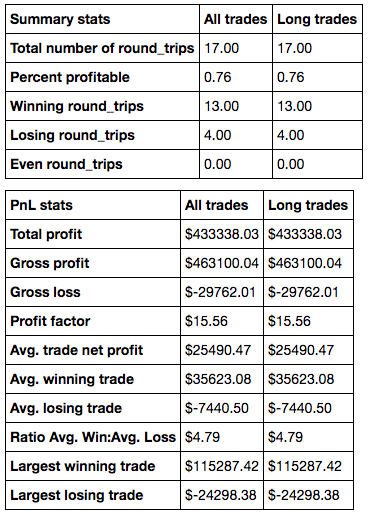
Like before, this approach doesn't deliver a large number of trades, but the trades it does deliver are very rewarding (average winning trade is 8.05%). Using all available capital to purchase SPY shares with this strategy increases the annual return to 6.04%.
Trading statistics are provided below using 183 months of in-sample data and 21 months of out-of-sample data.
[caption id="attachment_930" align="aligncenter" width="379"] Figure 1: Summary & PNL Stats for Smart Money (all capital)[/caption]
[caption id="attachment_924" align="aligncenter" width="282"]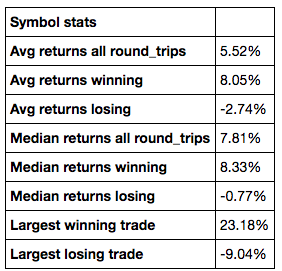 Figure 2: Trading Stats for Smart Money (all capital)[/caption]
Note: In the Performance Statistics table below, the first two row values are shown as decimals rather than percentages (0.06 = 6%).
[caption id="attachment_925" align="aligncenter" width="600"]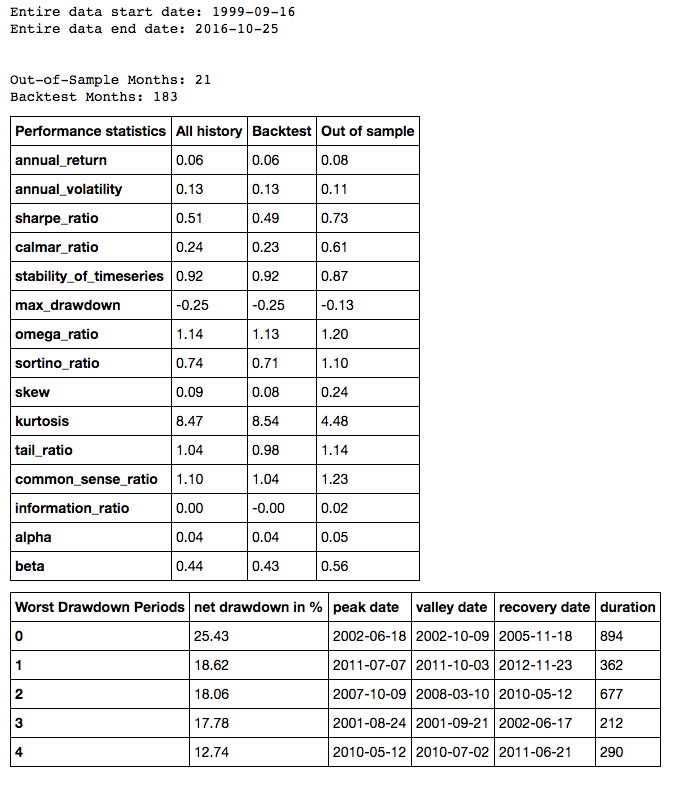 Figure 3: Performance statistics for Smart Money (all capital)[/caption]
Performance Charts
[caption id="attachment_926" align="aligncenter" width="600"]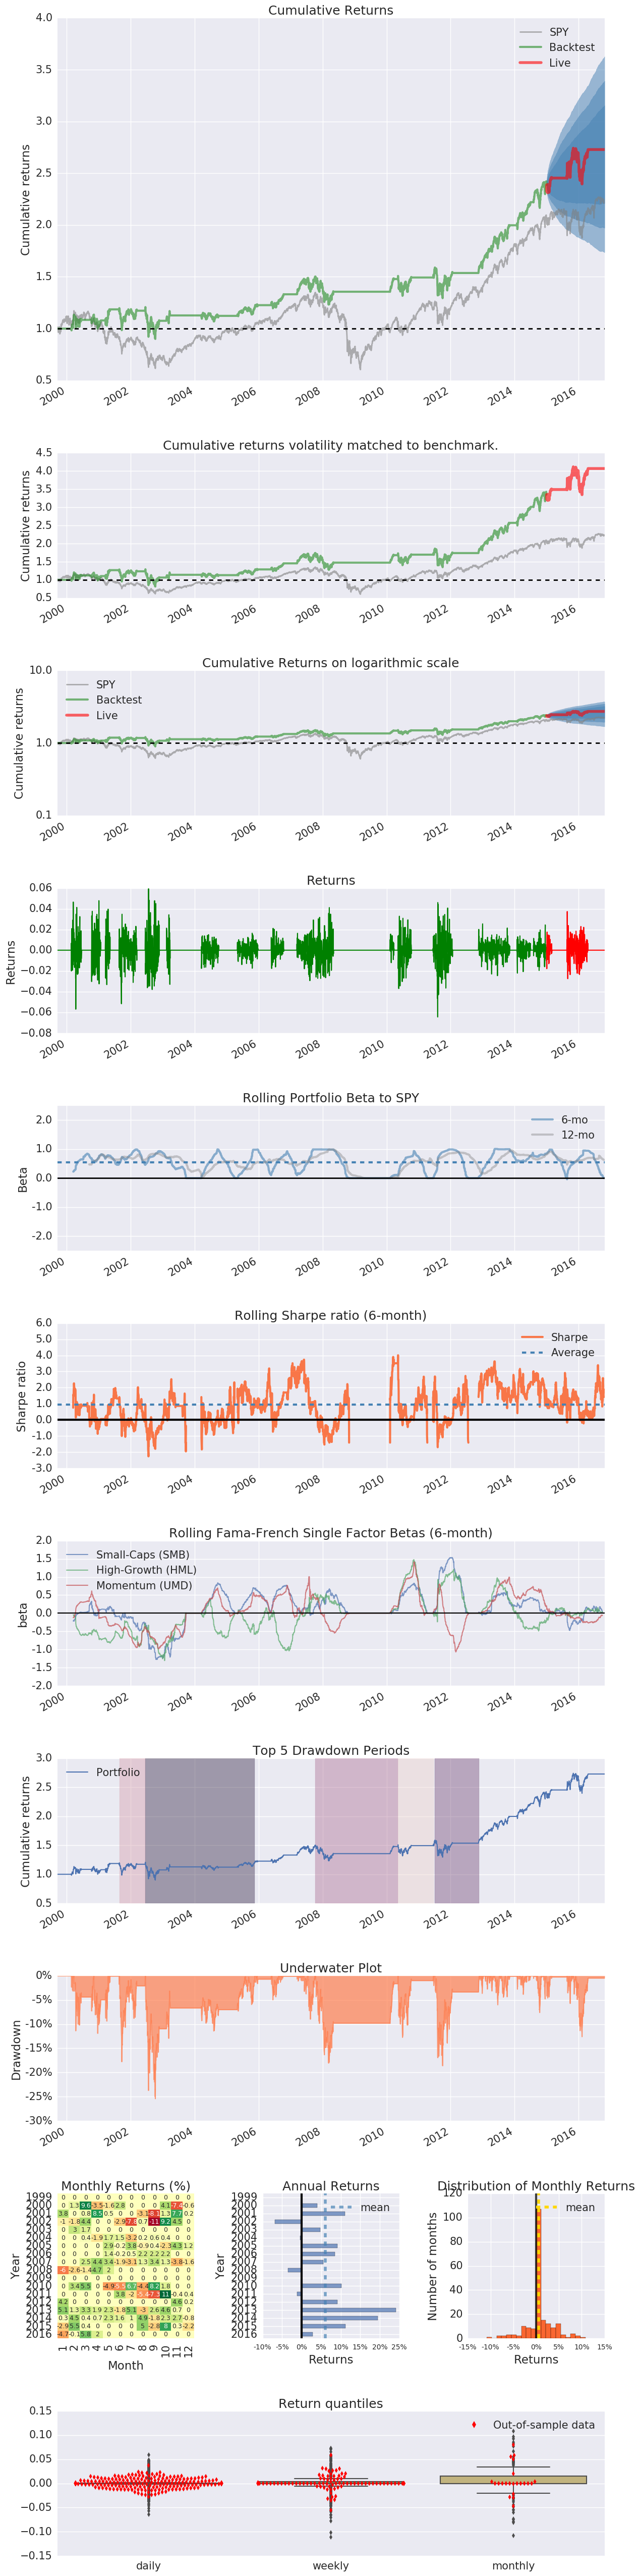 Figure 4: Smart Money Performance Charts (all capital)[/caption]