
Initial surge shouldn't give much back

The two primary reasons to be optimistic about the past couple of weeks are that we've had a historic surge of buying pressure (here and here) and the major indexes have retraced a substantial portion of the February-March decline. When either of those conditions triggered, it was rare to see much, if any, loss going forward, especially over the next 6-12 months.
Let's go over each of them and see if there is any pattern to how stocks reacted after the breadth and/or retracement signal. According to the textbooks, we shouldn't see much of the initial thrust given back, and volatility should calm down almost immediately.
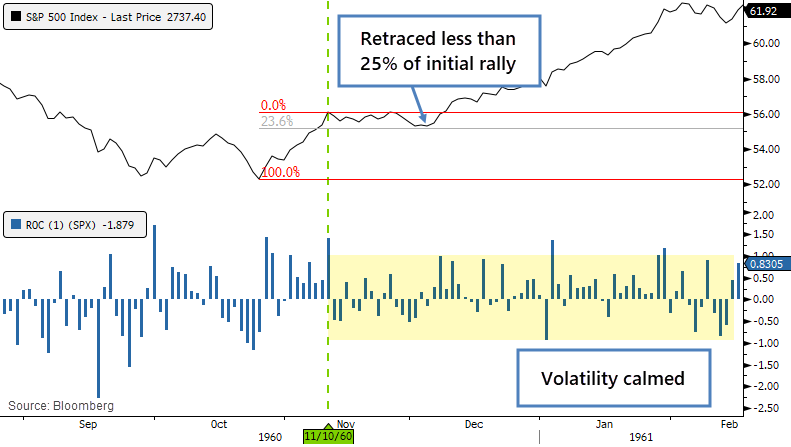
The 1960 thrust was a perfect example. After the initial surge, the S&P 500 gave back less than a quarter of its gains, and its daily swings immediately calmed down. Can't ask for any better than that.
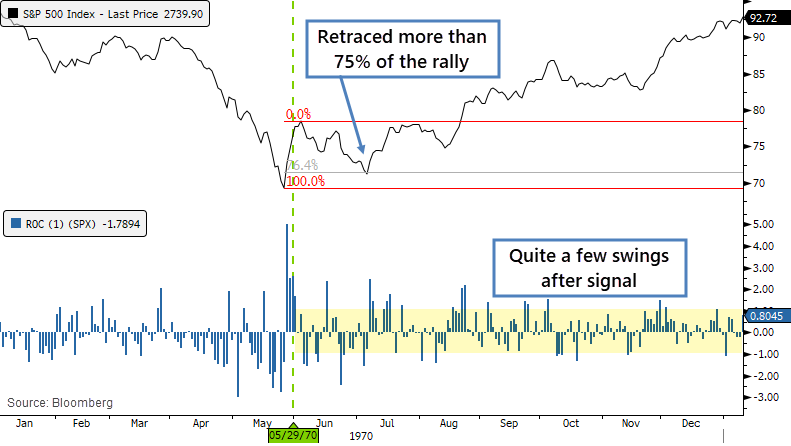
In 1970, it didn't behave so well. The S&P gave back more than 3/4 of the initial surge, but at least it didn't set a lower low. Volatility remained quite high, with a number of +/- 1% daily swings in the months ahead.
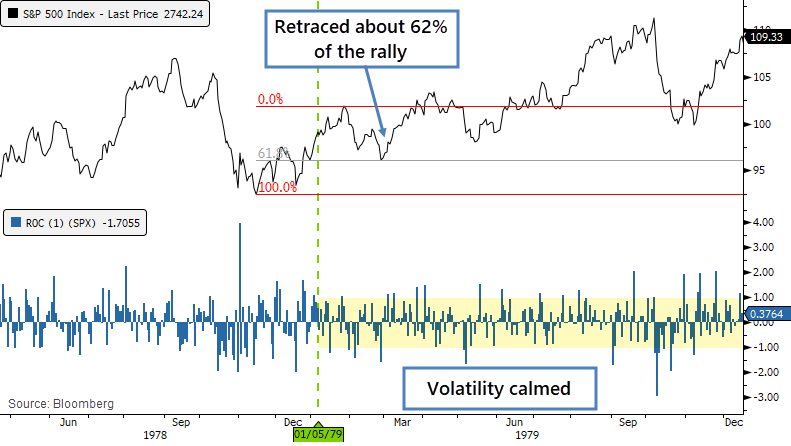
In 1979, the S&P retraced about 62% of the initial rally, and volatility calmed down quite a bit after the signal.
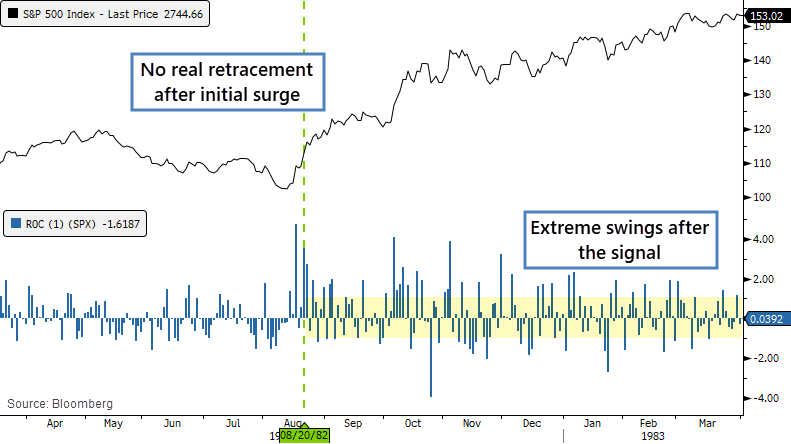
The bottom in 1982 is one of the few major bottoms (really the only one) when volume increased as stocks rallied. There was essentially no retracement after the initial kick-off surge, but volatility remained very high. This was an odd case, since not only volume increased, but volatility did, too, even as stocks rallied. It's extremely rare to see anything like this.
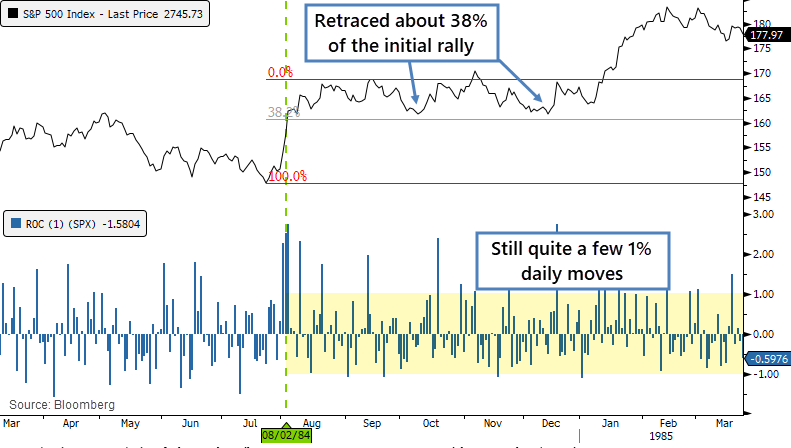
In 1984, stocks went into a holding pattern for almost 6 months after the initial thrust off the low. There wasn't much of a retracement of the initial gain, less than 38%, but volatility was still quite high for a market that was recovering.
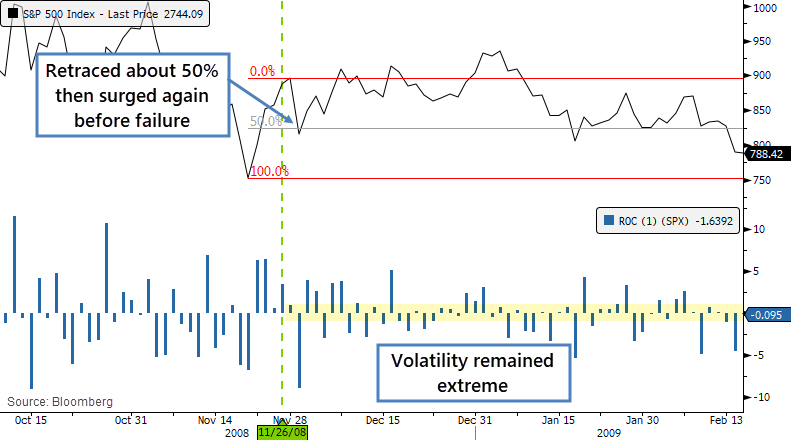
There wasn't another breadth and/or retracement signal until November 2008. That initial breadth surge led to an immediate pullback of about 50% of the initial gain, then the S&P managed a higher high even though volatility was extreme. It topped out about a month later and suffer a lower low.
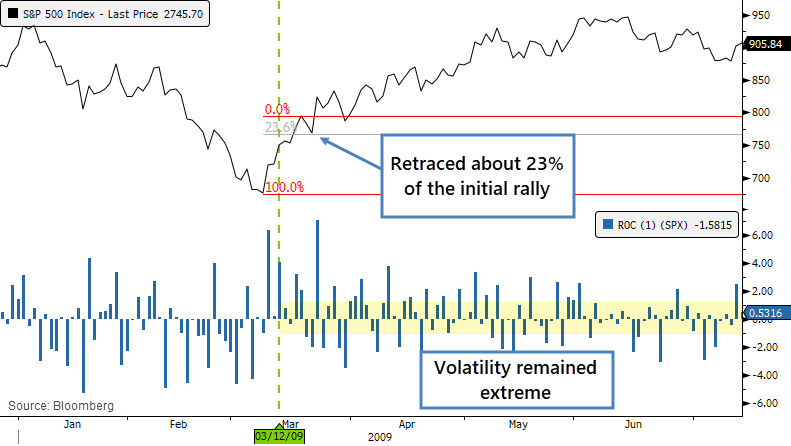
The next signal, in March 2009, marked the end of the bear market. There was a tiny retracement of about 23% of the initial surge but it's barely a blip. Volatility was still very high for months afterward.
More recent signals preceded much less of a dramatic decline, but were also more similar to our current environment in terms of structural factors like an active Federal Reserve, large flows into passive funds, dominant computerized trading, etc.
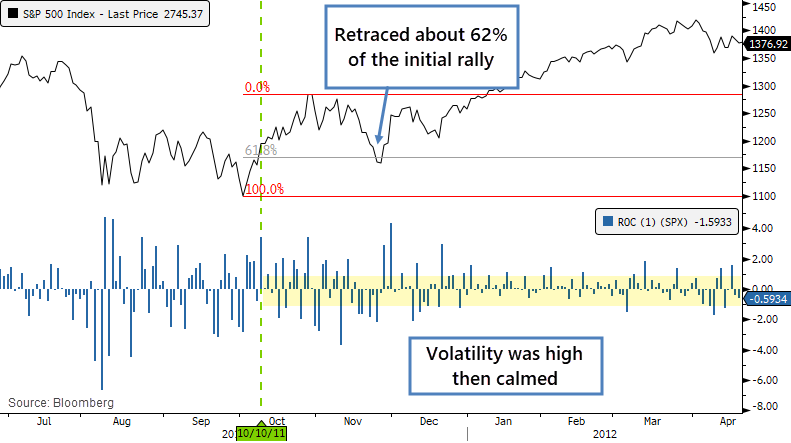
When stocks showed a signal in October 2011, the initial surge kept going for several weeks, then ended up giving back about 62% of that gain. Volatility remained very high, but as stocks recovered to a higher high, those swings dampened.
There was a breadth surge in January 2016, and stocks immediately failed afterward, taking the S&P to a lower low, which caused a high degree of consternation among traders, and almost every day saw a swing of more than 1%. Buyers stepped in right away, though, and it led to another surge by the end of February. That one didn't see any real retracement after the kick-off, and volatility started to drop right away.
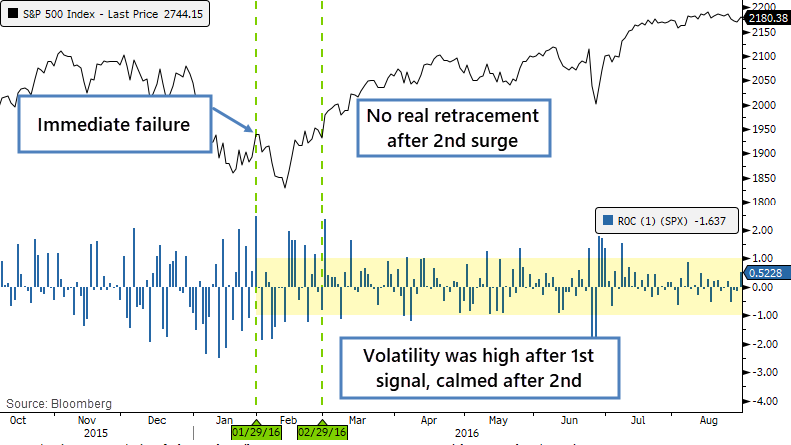
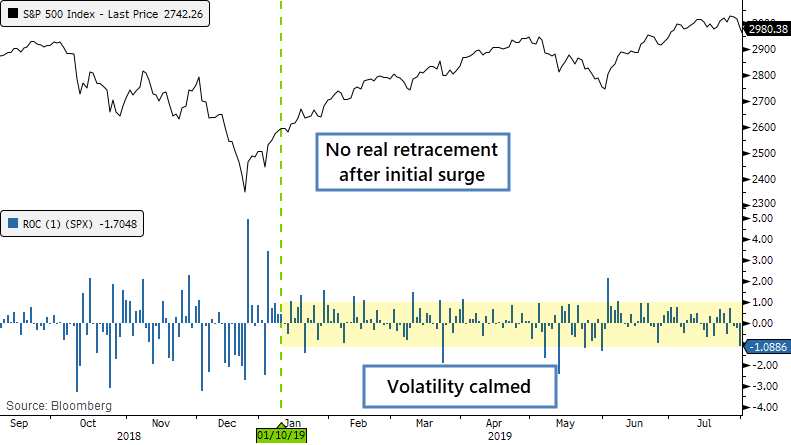
The last signal, from January 2019, also didn't see any retracement from the initial kick-off surge, and volatility calmed immediately. That was a classic v-shaped bottom that is not very common.
There was no clear pattern among all the signals - sometimes there was only a shallow retracement (or none at all) after the initial surge, sometimes a deep one. Sometimes volatility calmed down immediately, sometimes stocks continued to swing by more than 1% daily for weeks or months afterward.
Very generally, we might be able to say that the better bottoms saw volatility ease quickly after the signal. Ideally, of course, the retracement of the initial gain would be limited, but even some of the deep ones ended up leading to massive longer-term gains. They were also scary, and a couple of them led to lower lows.
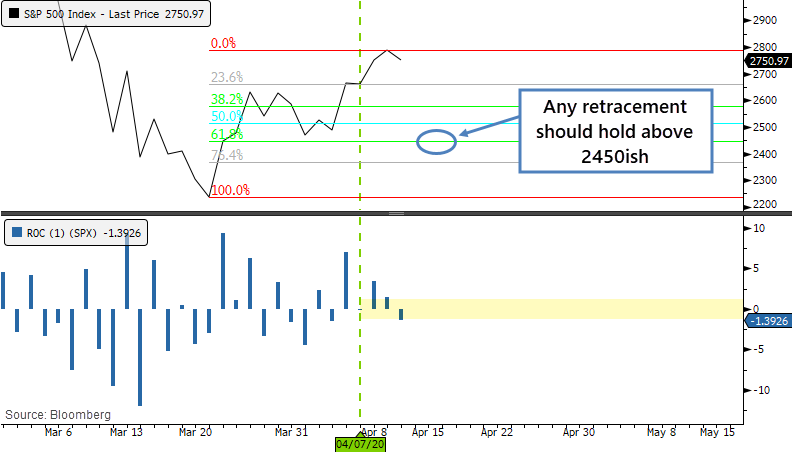
If the S&P gives back more than 62% of its gain, around the 2450 level, then it would indicate a deeper-than-usual retracement and cast the surge's effectiveness into doubt. That would also happen to show a lower low, further confirmation of a failure.