
New highs - with asterisks

The S&P 500 finally did what it's been trying to do for days now, and crept to a new high.
This ended its shortest bear market in history. Using the completely arbitrary definition of a 20% decline from a multi-year high, it has taken the index only 110 days to cycle to a fresh high. That's several months faster than the other fastest recoveries in 1967 and 1982. In the table below, the "# Days" column shows the number of trading days from the time the S&P fell 20% from a multi-year high to when it first hit a new high.
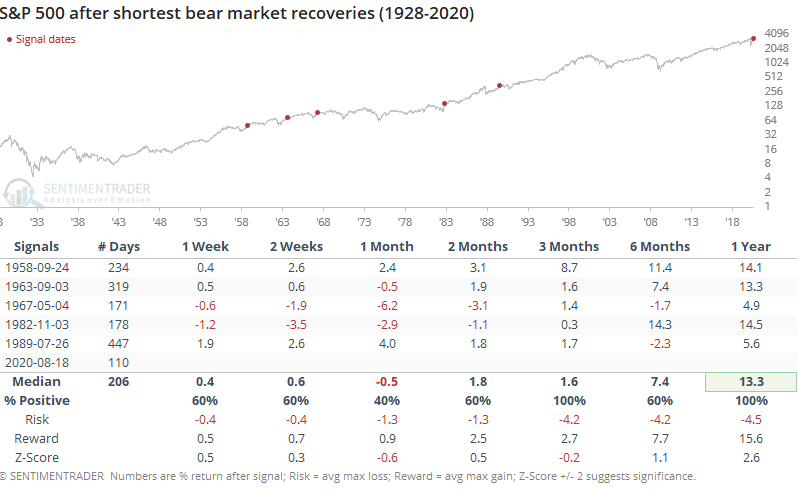
Returns were mixed over the short- to medium-term, but with limited downside, and all continued higher over the next year.
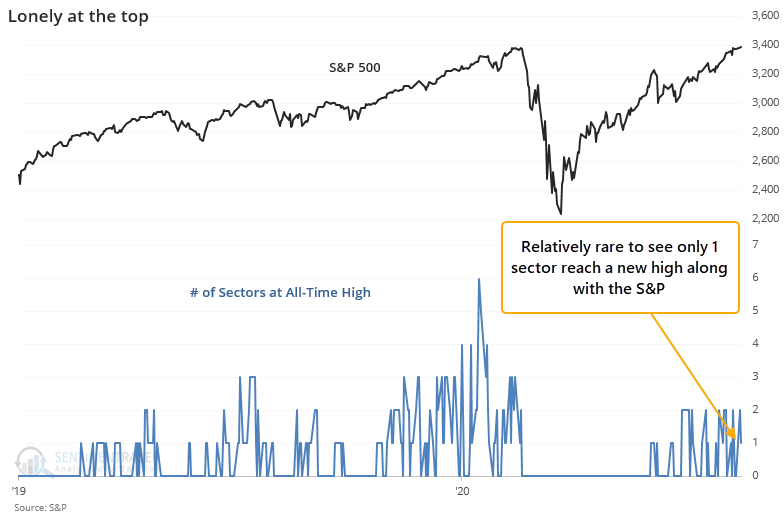
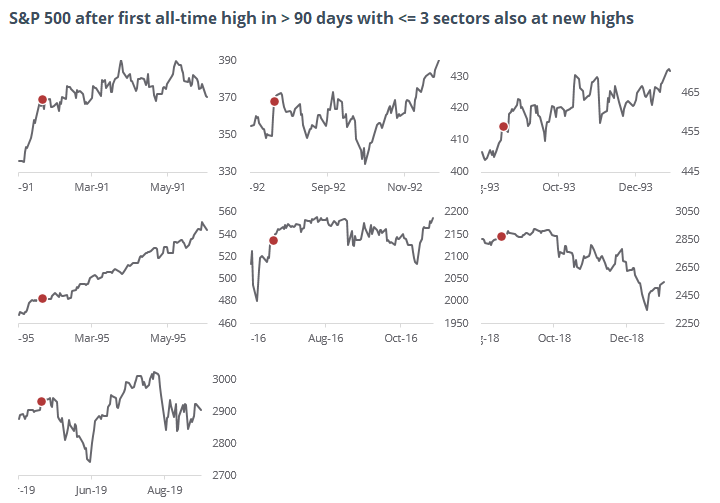
This is its first new all-time high in months, but the S&P's sectors are struggling somewhat to keep up. Only one of them, Consumer Discretionary, managed to close at an all-time high on Tuesday.
When the S&P reaches its first new high in months with only 1 or 2 sectors following suit, its future returns were mediocre with only one exception (1995).
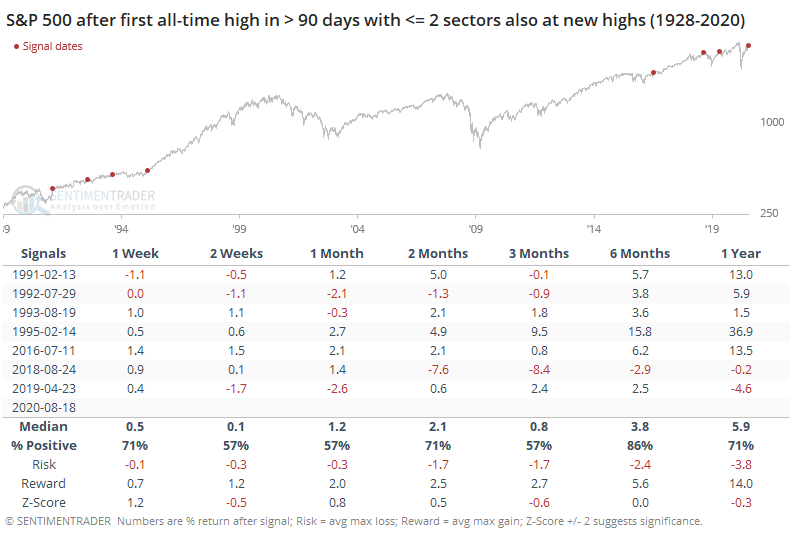
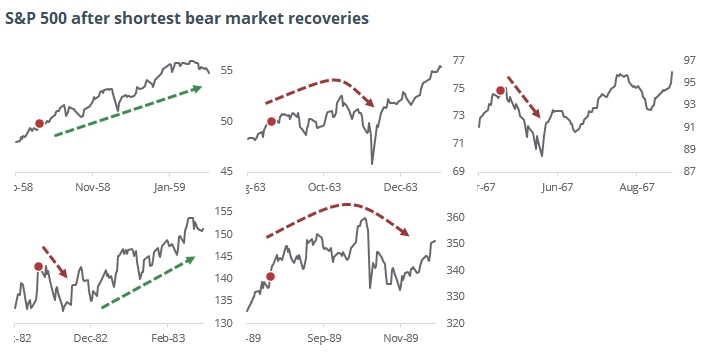
The thumbnail charts show how the S&P meandered after these signals. Again, this is excepting 1995 when it took off to the upside in one of the great "creeper" trends of all time that frustrated everyone but pure trend-followers.
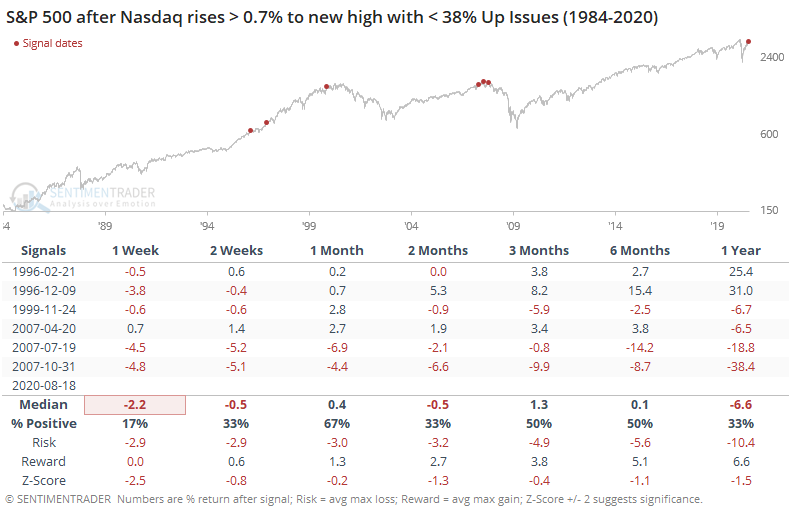
As noted yesterday, Tuesday was odd because the Nasdaq Composite rose more than 0.7%, and yet its Up Issues Ratio was only 38%, meaning that only 38% of stocks on that exchange closed higher than where they closed on Monday.
That's an exceptionally weak reading for a day like that for the Composite. It didn't lead to great returns for the broader market.
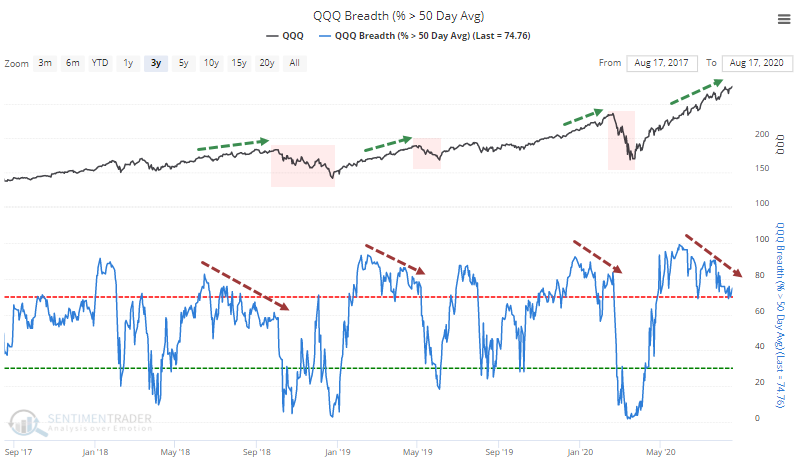
Even among the roaring tech stocks, there are some divergences popping up. We don't place much weight on these because they can persist for a long time before they matter (if they even do). Still, other times in recent years when the divergence has persisted list this, those shorter-term gains were erased during subsequent pullbacks.
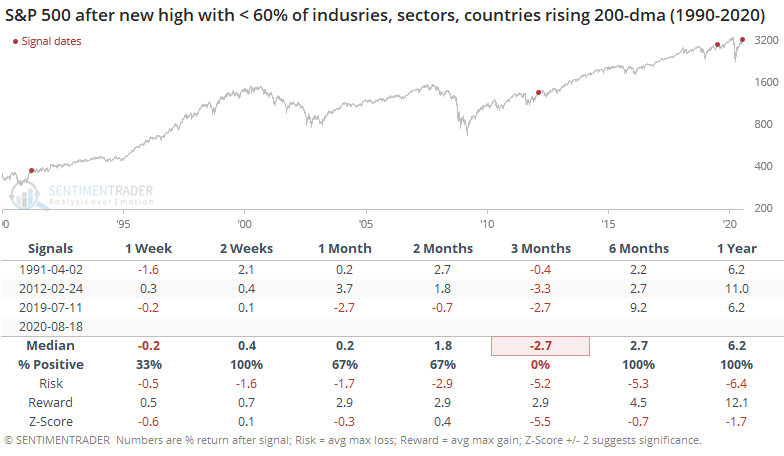
It's also odd to see a new high in an index like the S&P 500 with so few of its industries in solid uptrends. Only 57% of industries have a rising 200-day moving average.
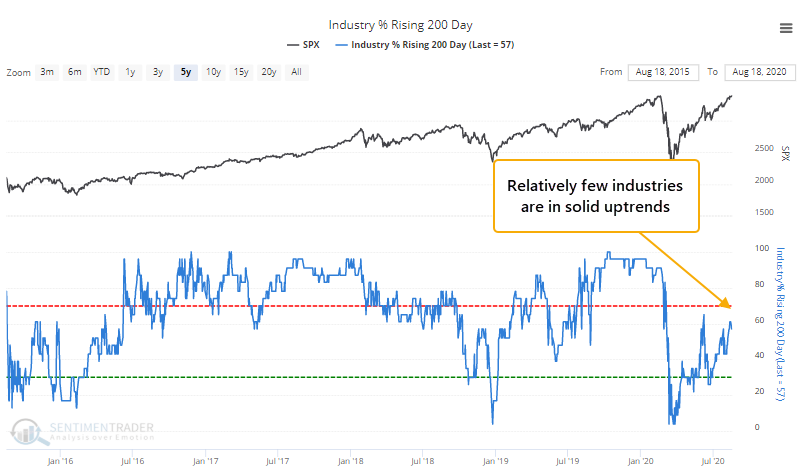
Even worse, only 55% of sectors have a rising average, and a pathetic 23% of countries do. There have only been three times in 30 years when the S&P hit a high and no more than 60% of industries, sectors, and countries were in solid uptrends.
We've seen a lot of these oddities over the last few weeks, and yet here we are talking about new all-time highs in the major indexes. Clearly, "odd" hasn't mattered.
It's possible that we've focused too much on minutiae (it's always possible to complain about something) and we're in the midst of another one of those nothing-matters markets like '95, '13 or '17 (and part of '19). So far, the signs are pointing that way because, well, we're sitting at new highs. We've seen factors like this (sketchy market environment, high optimism, odd breadth readings) enough times over the past 20 years to still put a lot of weight on them, acknowledging that sometimes they simply fail. Maybe this is one of those times, with the breadth thrusts, recoveries, and trend changes from the spring totally overwhelming everything else, not to mention, of course, the fiscal and monetary backstops. I don't know. The only thing I know is that I don't like betting on "this time is different" and that means believing that risk is still high, accepting the idea that it's wrong and the creeper trend will persist.