
Sometimes the Middle is Not a Bad Place to Be (Part III)

This is part 3 of a 3-part series, click here for part 1 and here for part 2
In Part I, I highlighted the fact that Mid-cap stocks significantly outperformed both Large-cap and Small-cap stocks on a buy-and-hold basis between 1981 and 2020. In Part II we looked at how the different cap sizes performed when we split each 12-month period into a "Power Zone" and a "Dead Zone."
We also learned that over the past 40 years:
- Mid-caps outperformed Large-caps on a buy-and-hold basis by better than 2-to-1
- Mid-cap outperformed Large-caps by over 3-to-1 during November through May
- Large-caps outperformed Mid-caps by about 2.8-to-1 during June through October
We also learned that Large-caps have outperformed Mid-caps in recent years. So, an open question is "Will there be a reversion to the mean with Mid-caps once again outperforming, or have Mid-caps simply lost their edge?" While only time will offer a definitive answer, there are a few things we can look at to handicap the situation.
Mid-caps and Bad Quarters
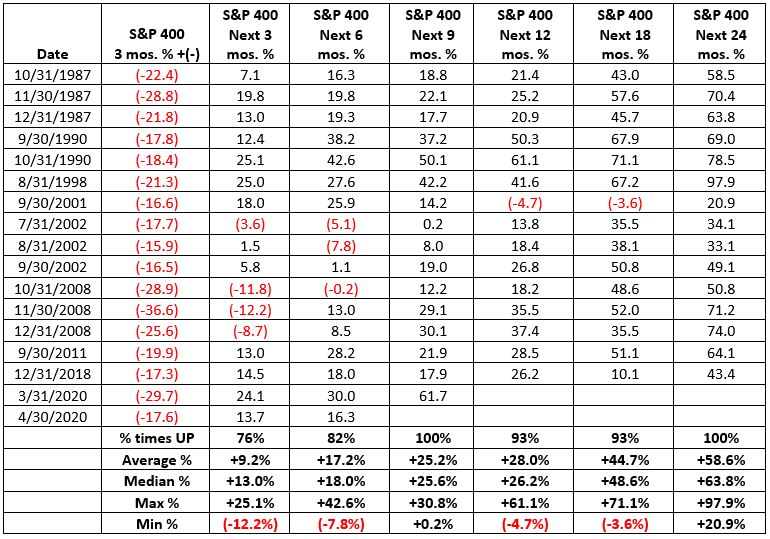
For our purposes we will define a "bad quarter" as any 3-month period that sees the S&P 400 MidCap Index decline by -15% or more. Then we will see what happens to the Mid-cap index both on an absolute basis and relative to the S&P 500 Index going forward.
The table below lists all 3-month periods that ended with the S&P 400 MidCap Index registering a decline of -15% or more (using monthly total return data). It also displays the total return for the MidCap Index over various time periods following each such decline. The results are fairly compelling, i.e., the subsequent returns tend to be fairly substantial.
In the next table we see:
(Total return for the S&P 400 MidCap Index minus the Total return for the S&P 500 Index)
A positive value means the Mid-cap index outperformed the S&P 500 Index during that particular timeframe and vice versa and a negative value means the Mid-cap index underperformed the S&P 500 Index.
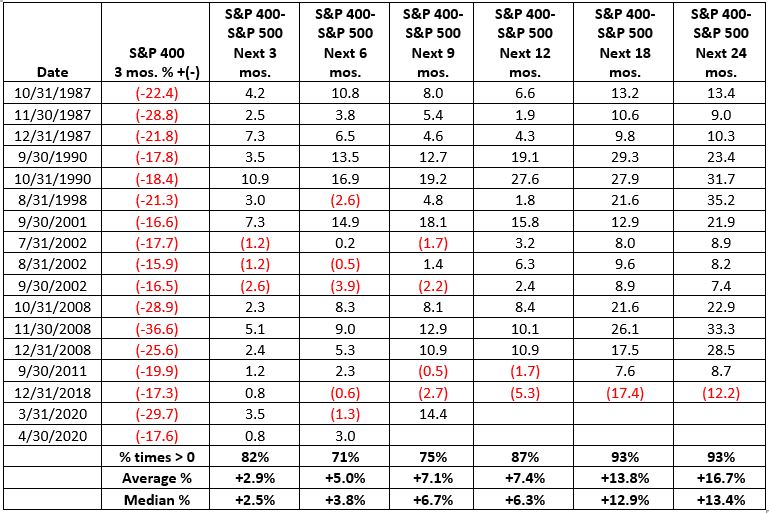
As you can see in the tables above, typically (though not always) after a 3-month losing period of -15% or more, the S&P 400 MidCap Index has generated substantial gains AND has significantly outperformed the S&P 500 (large-cap) Index.
Note that following the signal on 3/31/2020 (through 12/31/2020) the S&P 400 MidCap Index was up +61.7% on an absolute basis, outperforming the S&P 500 Index by 14.4 percentage points. What percentage of the investing population do you suppose is aware of that fact?
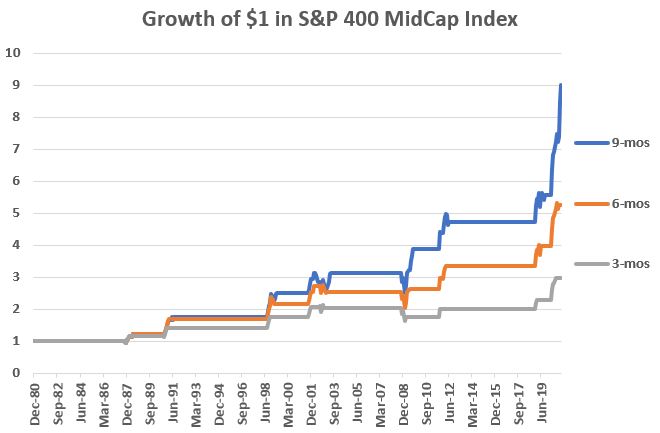
To get a sense of the consistency of performance in the past, the chart below displays the cumulative total return for the S&P MidCap 400 Index 3, 6 and 9 months after each of the dates shown in the tables above.
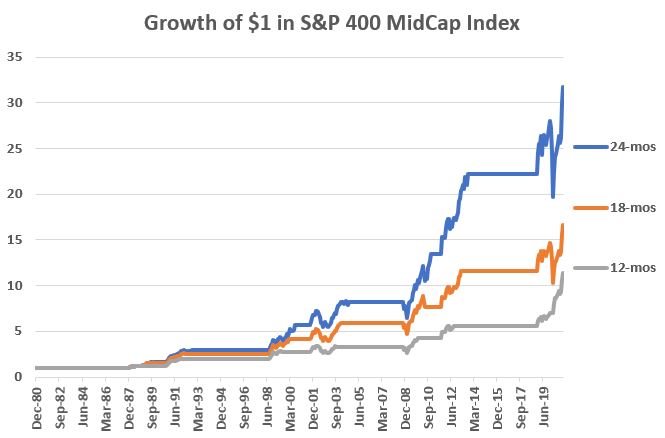
The chart below displays the cumulative total return for the S&P MidCap 400 Index 12, 18 and 24 months after each of the dates shown in the tables above.
The last date in the tables above was 4/30/2020. Does the data in the charts and tables above mean that it is smooth sailing for stocks in general – and Mid-cap stock specifically – through 4/30/2022? Not at all. But the data presented in this piece – and Parts I and II – do suggest giving bullish case for Mid-cap stocks the benefit of the doubt.