
Stocks' Internal Momentum Has Turned Up

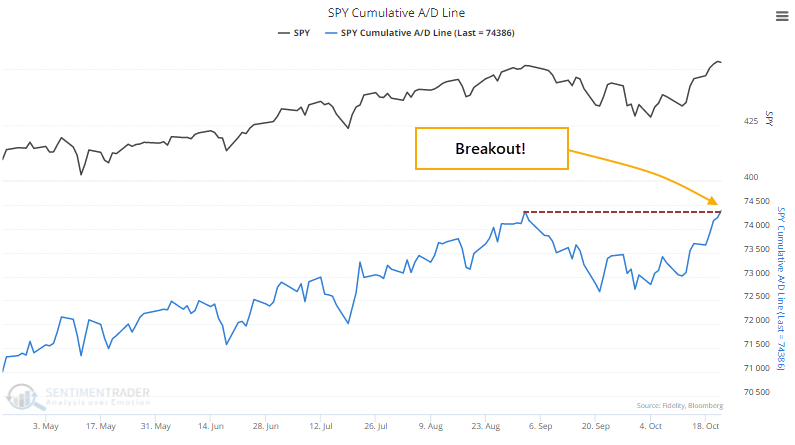
The most benchmarked index in the world is trying to hold a breakout to record highs. Supporting its case is the fact that most of its stocks have been rising, and breadth within the index confirms its good performance.
Even though the S&P 500 settled back a bit on Friday, most of the stocks in the index gained ground. That was enough to push the S&P's Cumulative Advance/Decline Line to a new high, the first in more than 30 sessions.
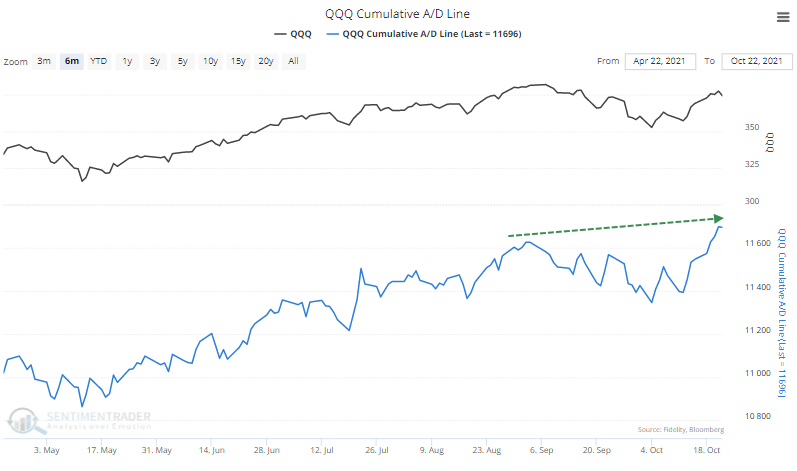
Among other major indexes, the Nasdaq 100 has also seen a breakout in its Advance/Decline Line.
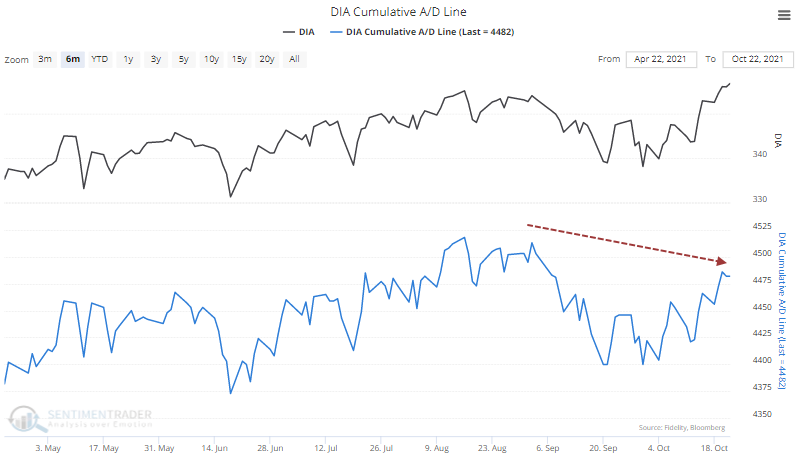
The Line for the Dow Industrials isn't quite there.
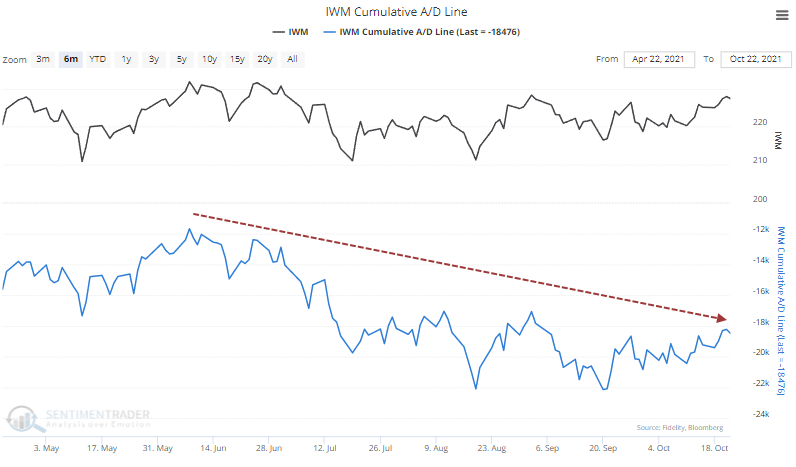
The biggest laggard, by far, is the small-cap Russell 2000.
Small-caps have a significant influence on the granddaddy of them all, for every security traded on the NYSE. That has also been lagging but is within spitting distance of a new high.
LESS CHANCE OF A BIG DECLINE
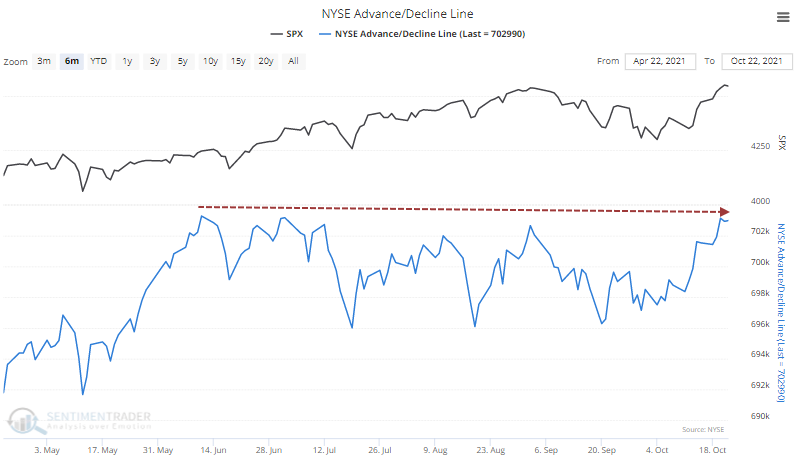
Many times over the past couple of decades, we've discussed the idea that stocks are less likely to suffer a large drawdown in the following months when the advance/decline line breaks out to a new high. We typically use the NYSE Advance/Decline Line, but our version of that indicator hasn't quite made it over the hump. It very well might on Monday if stocks have a good day.
Below, we can see that since 1928, the S&P 500 was three times more likely to suffer a 10% decline at some point within the next three months if the S&P's Advance/Decline Line was not at a multi-year high. When it did break out to a new high, as it did on Friday, there was only a 4.6% probability of a 10% or greater decline within the next few months and less than a 2% chance of a 20% decline.
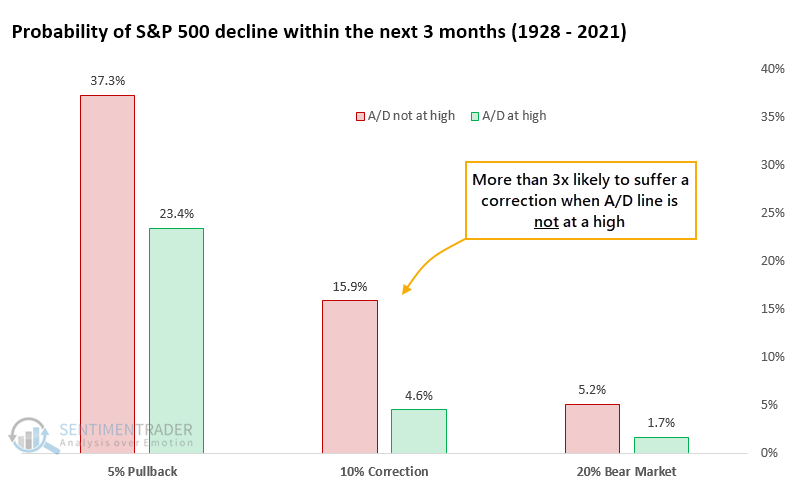
The S&P 500 can suffer a significant decline shortly after a breakout to a new high in the Advance/Decline Line. But it's exceptionally rare and comes quickly out of the blue. Since 1928, the only two instances were the Black Monday crash in October 1987 and the pandemic crash in March 2020.
OTHER INDICATORS TURNING UP
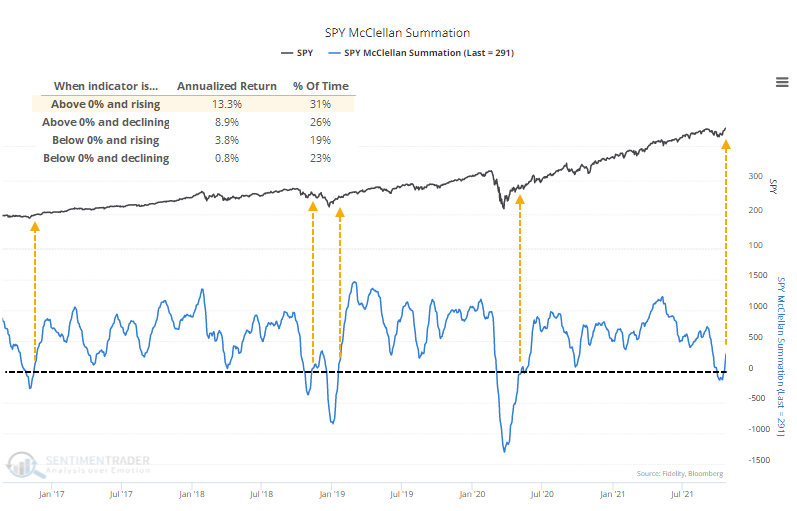
Thanks to last week's rally in most stocks, the McClellan Summation Index for the S&P 500 is now above zero, rising, and far from overbought - the best possible combination. That reverses the dip that we noted a couple of weeks ago.
Stocks within the S&P witnessed a short-term breadth thrust entering last week, and buyers have been persistent enough that it is positively influencing some of the more critical, longer-term breadth indicators. Again, that doesn't mean the index can't suffer a big decline in the months ahead - we should know by now that anything can happen at any time - but we try to focus on base rates and probabilities, and those argue for mostly clear sailing ahead.