
This thrust signal suggests higher stock prices

Key points:
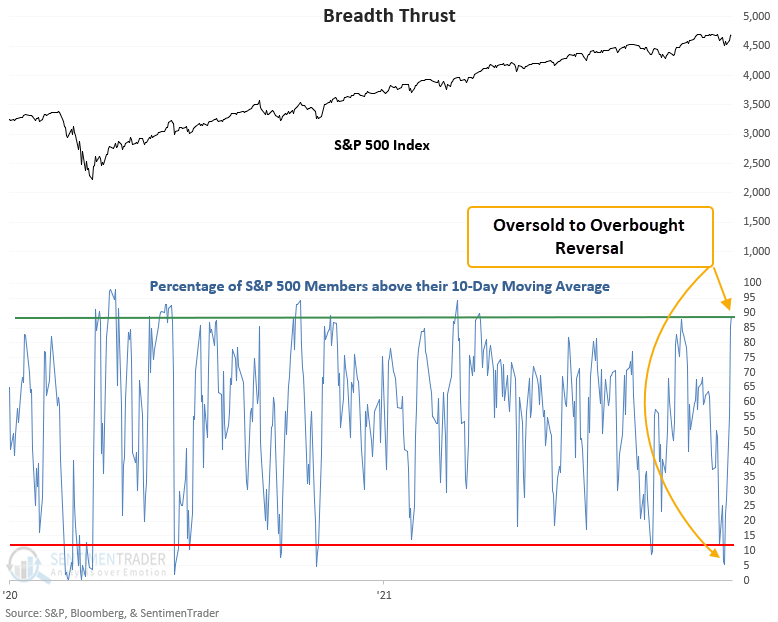
- S&P 500 members above the 10-day average surged from 5% to 89%
- It took fewer than 10 sessions to go from oversold to overbought
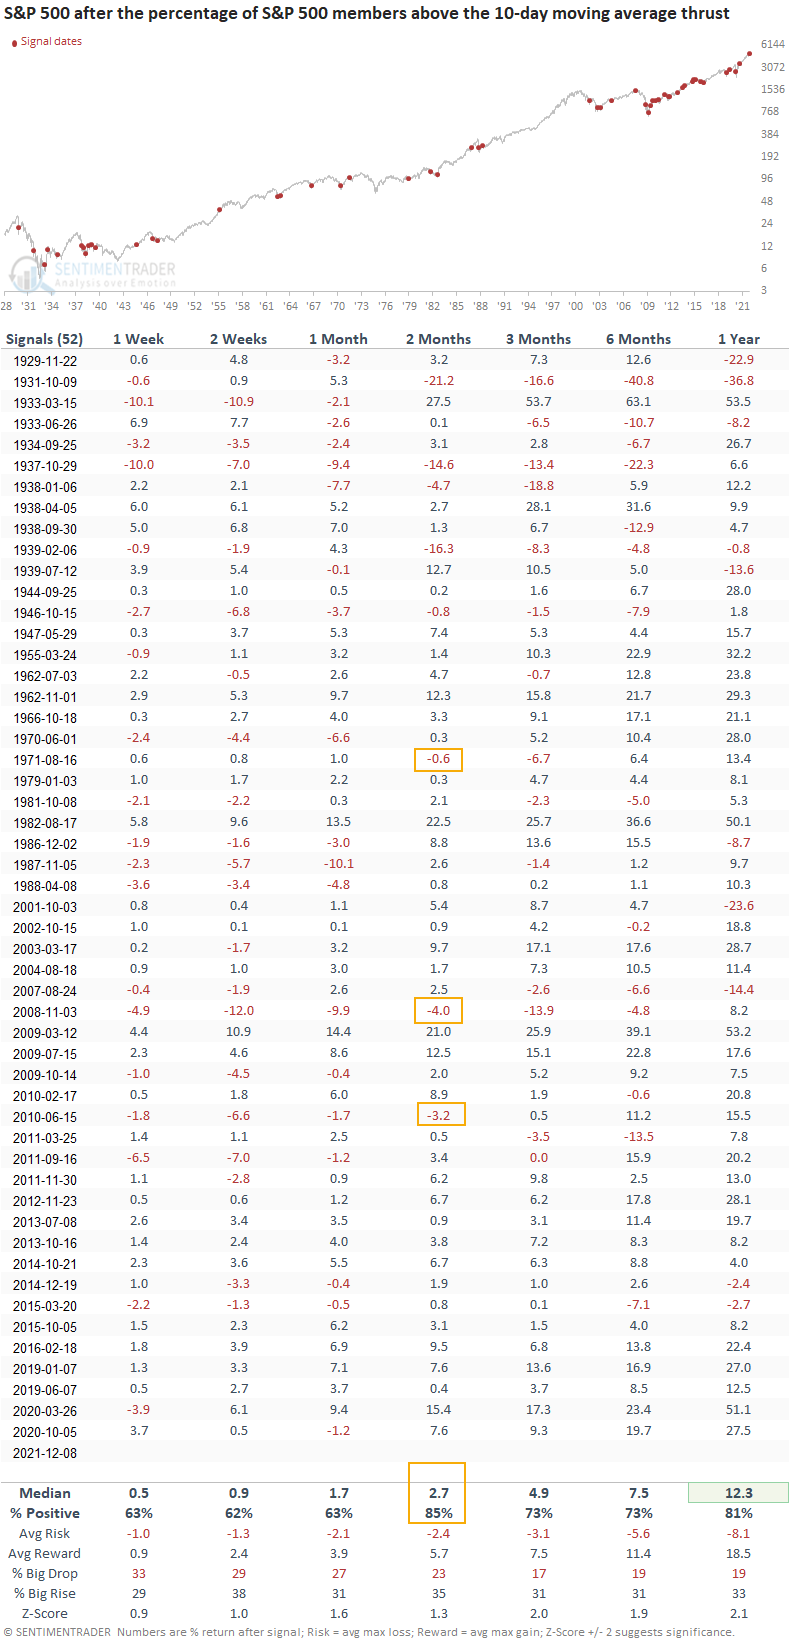
- The S&P 500 rallied 88% of the time over the next 2 months after other signals
A short duration breadth indicator reverses higher
A new signal from a voting member in the TCTM Composite Thrust Model issued an alert at the close of trading on Wednesday. The component is called the percentage of members above the 10-day reversal model.
The percentage of members above the 10-day average model identifies when the number of members trading above the 10-day moving average cycles from oversold to overbought in a short period of time.
Sharp and sudden upward shifts in participation are historically bullish
The number of S&P 500 members above the 10-day moving average increased from 5% to 89% in only 5 sessions. That's the quickest reversal since last October.
This signal triggered 52 other times over the past 93 years. After the others, future returns and win rates were solid across all time frames. The 2-month time frame shows 36 out of 39 winners since 1947 and is currently riding a 15 signal winning streak. The worst drawdown in the previous 39 signals was -4%.
Signals associated with a market correction of 10% or less
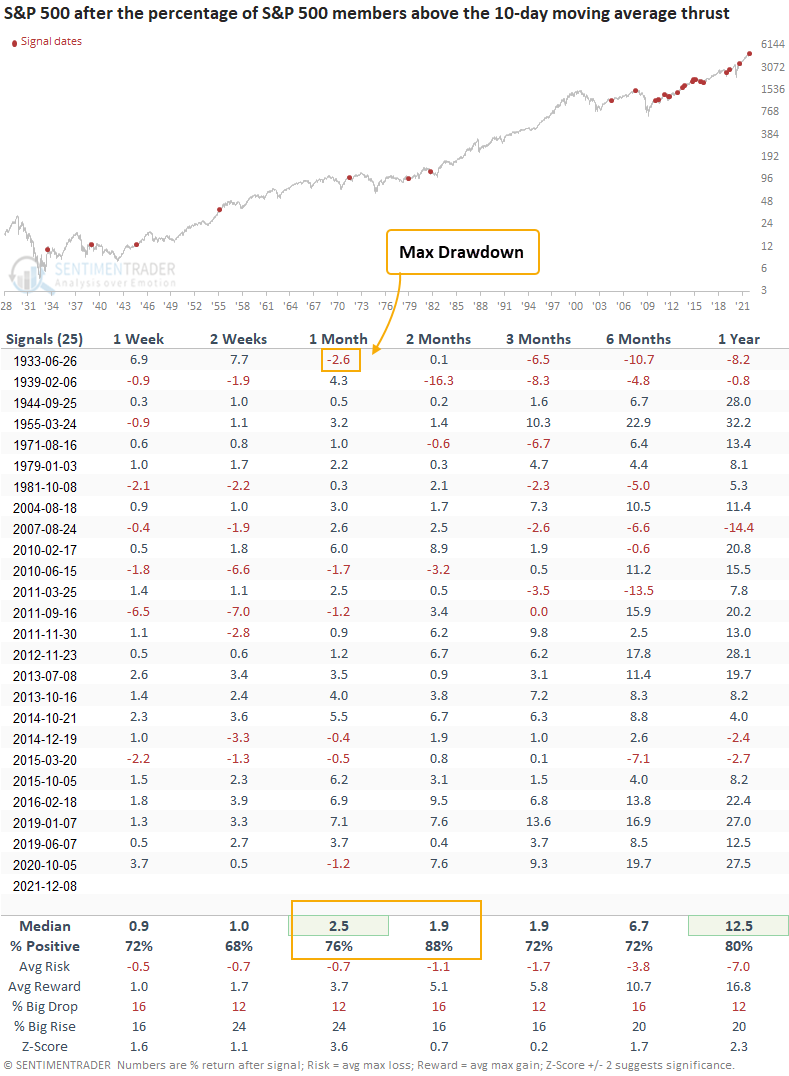
If we isolate instances based upon whether they occurred within the context of a market correction, the signal has triggered 25 other times in the last 89 years. After the others, future returns and win rates were solid across all time frames with a significant risk/reward profile in the 1-month window. The 2-month window shows an excellent win rate of 88%.
 What the research tells us...
When the percentage of members trading above the 10-day moving average reverses from oversold to overbought in 10 sessions or fewer, stock prices continue to rise. Similar setups to what we're seeing now have preceded solid returns and win rates across all time frames, especially in the 2-month window.