
Underlying momentum has turned negative

Momentum is ebbing, in the major indexes and below the surface.
One of the better gauges for this is the McClellan Oscillator. Most of the major sectors are now showing a negative Oscillator.
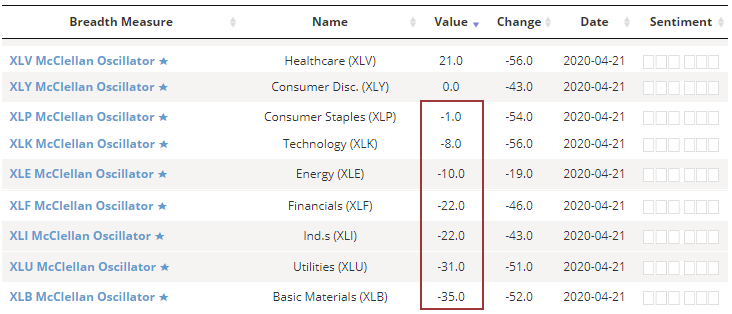
The negative readings come soon after most of them saw big positive momentum. On average, the sector Oscillators were recently above +100.
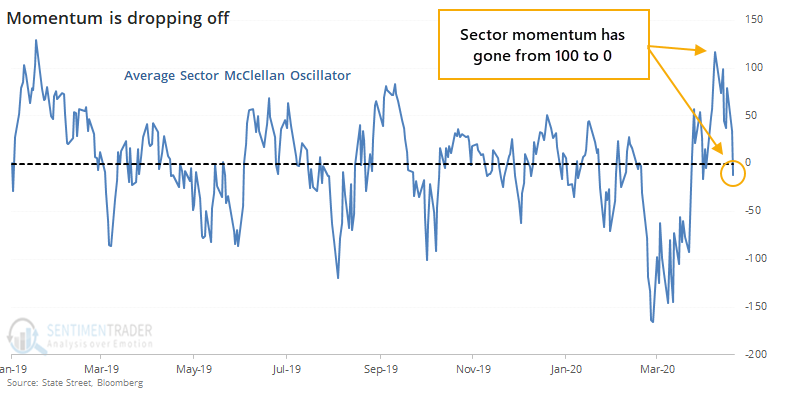
This is the quickest cycle from extremely positive to negative momentum since 2013. Below, we can see every time since 1990 when the average Oscillator for sectors was higher than 100, then dropped into negative territory.
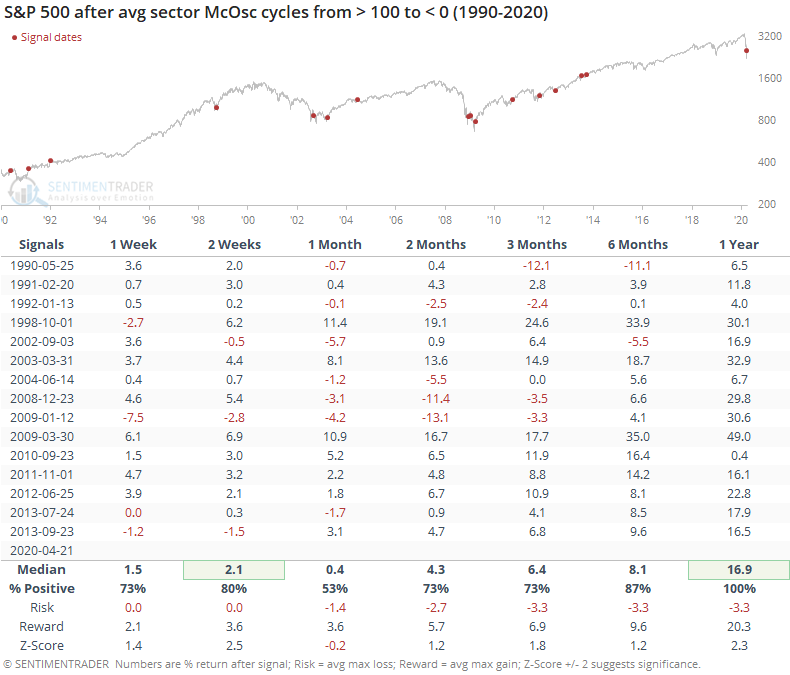
There was some choppiness over the next month or so, but with a positive bias. Over the next 6-12 months, returns were heavily skewed to the upside.
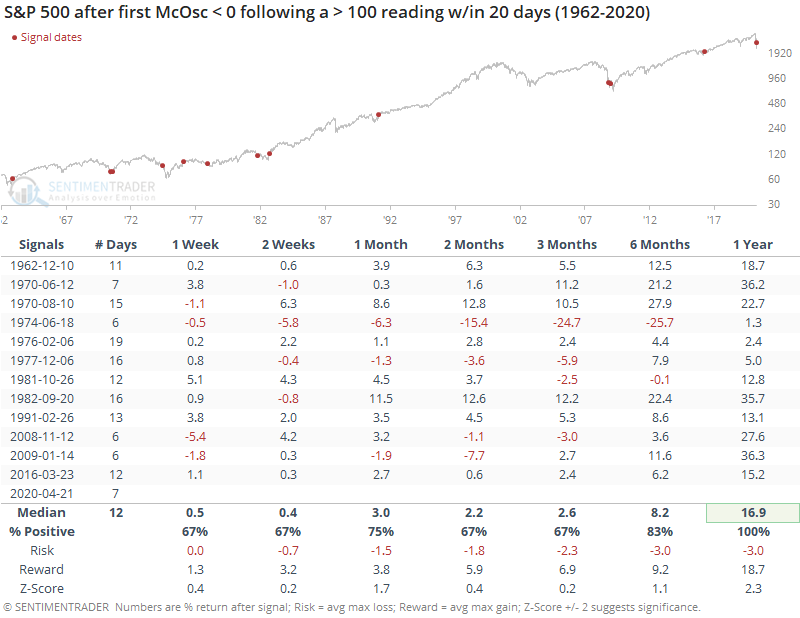
In a premium note, Troy showed that the Oscillator for the entire NYSE has dropped into negative territory, too. Similar to what Troy did, if look for the first sub-zero reading in the Oscillator following a surge above +100, then we get the following. The "# Days" column shows how long it took to cycle from above 100 to below zero.
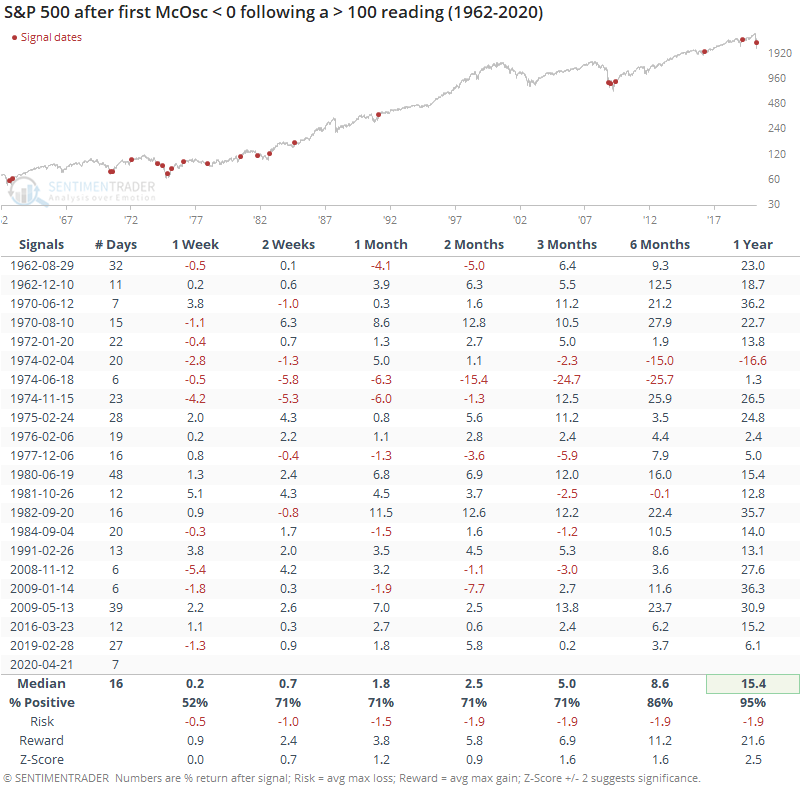
Returns were mostly good, especially longer-term. What sticks out in the table is that this has been one of the fastest cycles from very positive to negative momentum, taking only 7 sessions.
So, let's filter the table to include only those instances when the cycle took less than a month.
Here, there was a perfect record a year later. We should always be suspect of "perfect" results, especially with relatively small sample sizes, but it confirms what we often see - bouts of extremely positive momentum that turn negative might lead to choppy shorter-term returns, but almost always lead to significantly positive longer-term ones.
There are some reasons to be wary of the recent rally, including the idea that the "right" sectors haven't been leading, but ebbing momentum is not one of those reasons. When we see a positive thrust as we did, the first bout of negative readings usually doesn't imply a longer-term rollover.