
TradingEdge for Jul 23 - Risk Off Then Reversal, No Recession, Surging Coffee


The goal of the Weekly Wrap is to summarize our recent research. Some of it includes premium content (underlined links), but we're highlighting the key focus of the research for all. Sometimes there is a lot to digest, with this summary meant to highlight the highest conviction ideas we discussed. Tags will show any symbols and time frames related to the research.
| STOCKS | ||
|  | |
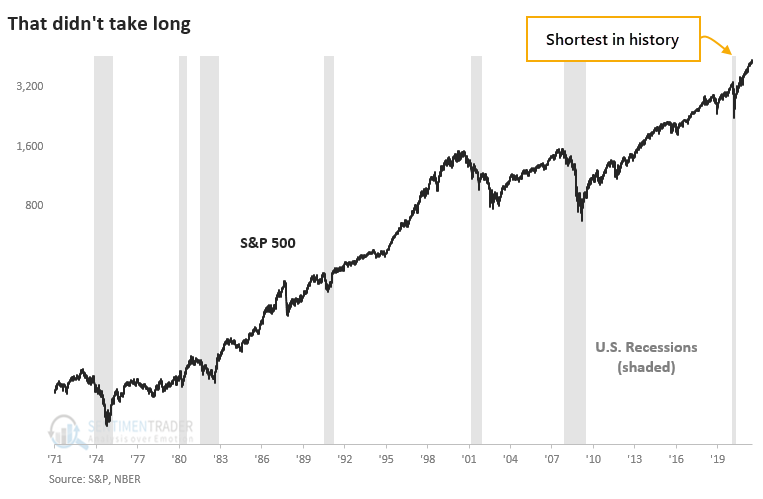
The recession is over, and we can all breathe easier now.
According to the National Bureau of Economic Research (NBER), the "official" arbiter of U.S. business cycles, the economy pulled out of recession last April, ending the shortest recession on record.
To see if there is any potential use in becoming more optimistic once a recession is officially declared to be over, the table below shows how the S&P 500 performed following a publicly declared end to a recession by the NBER.
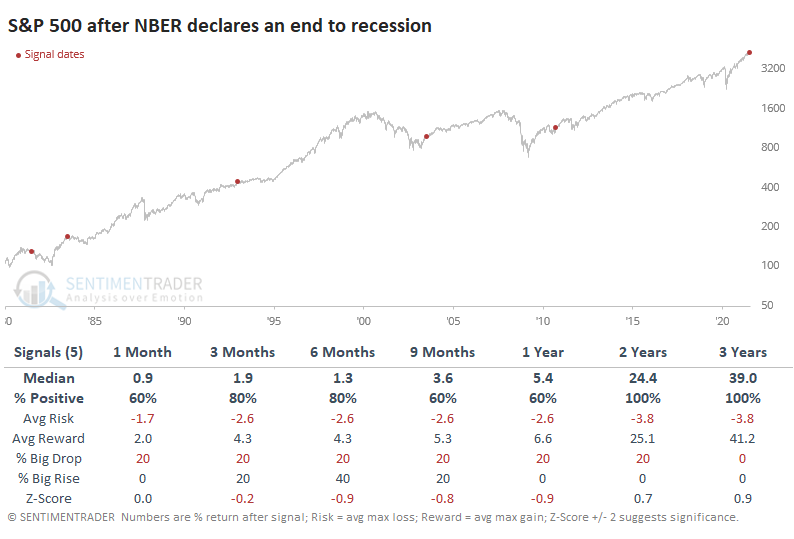
Short- to medium-term returns were decent but actually below a random return. Over the next 2-3 years, however, returns were good and carried an excellent risk to reward ratio.
The U.S. dollar showed mixed returns. Gold was basically the inverse, with declines in the 1980s as the dollar rallied and gains after the last two as the dollar fell. Returns in sectors and factors showed that Energy and Value stocks showed some of the best returns. The average return on Growth stocks was atrocious.
SOME RISK-OFF WARNINGS
Dean noted that the percentage of S&P 500 members outperforming the index on a rolling 21-day basis registered a risk-off warning alert at the close of trading on 7/16/21.
While the indicators had reached the model threshold levels for a signal weeks ago, the price momentum component had failed to turn down. On Friday, the S&P 500 index closed below the 87th percentile of its 2-month range, and the alert triggered as all conditions turned true.
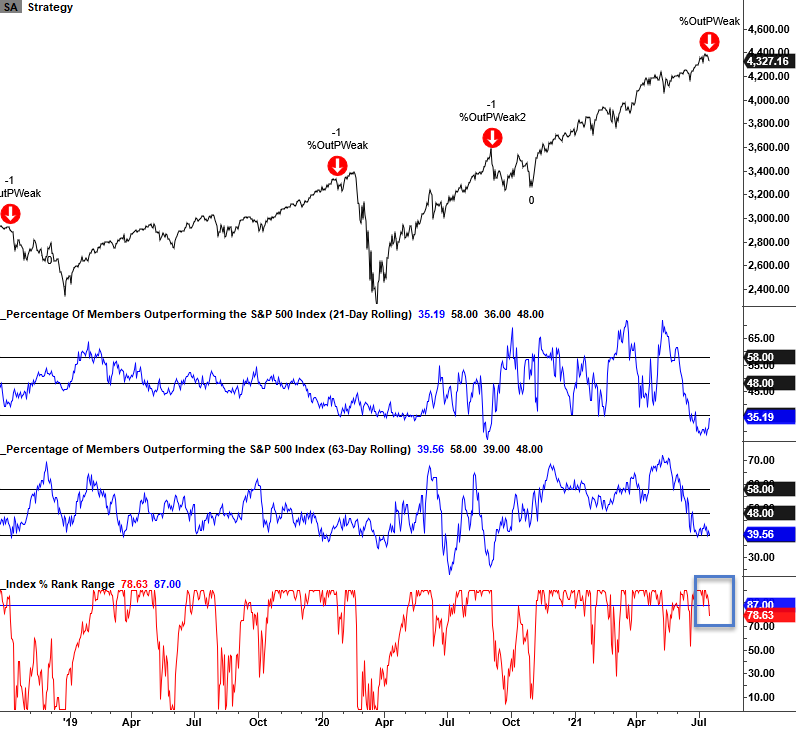
After other signals, results were weak across almost all timeframes with a very unfavorable risk/reward profile in the 2-4 week window. Over the next month, only 14 out of 39 signals showed a positive return in the S&P 500.
FALTERING MEMBER TRENDS
Dean also showed that the percentage of S&P 500 members trading above their respective 50-day average registered a risk-off warning alert at the close of trading on 7/19/21.
The percentage of members above the 50-day average had been deteriorating for months. However, when the indicator fell below the threshold level for a risk-off signal, price momentum for the S&P 500 was strong, and the model avoided an alert. With the sell-off in the market over the last few days, the momentum condition kicked in, and a signal triggered at the close of trading on Monday.
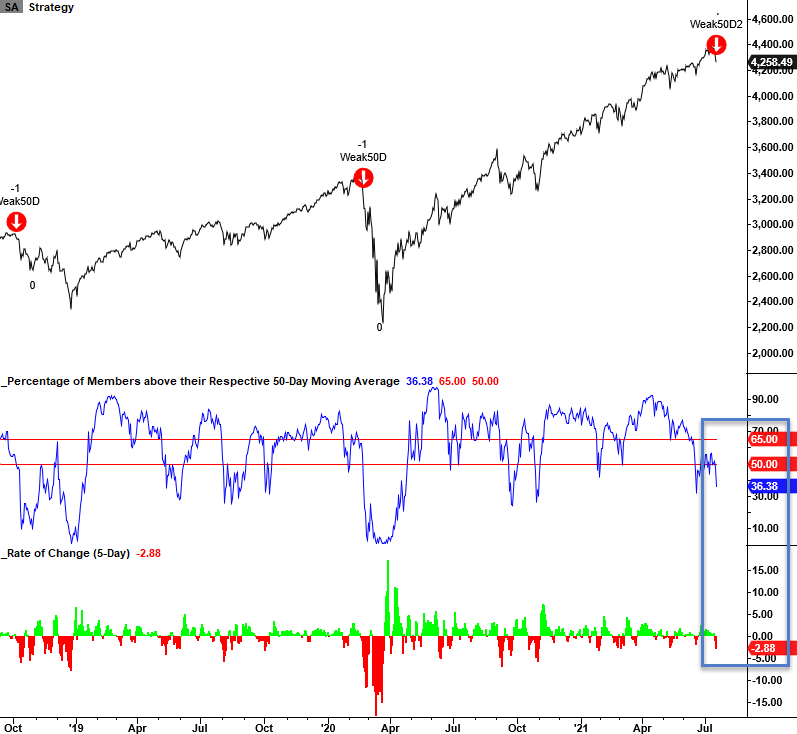
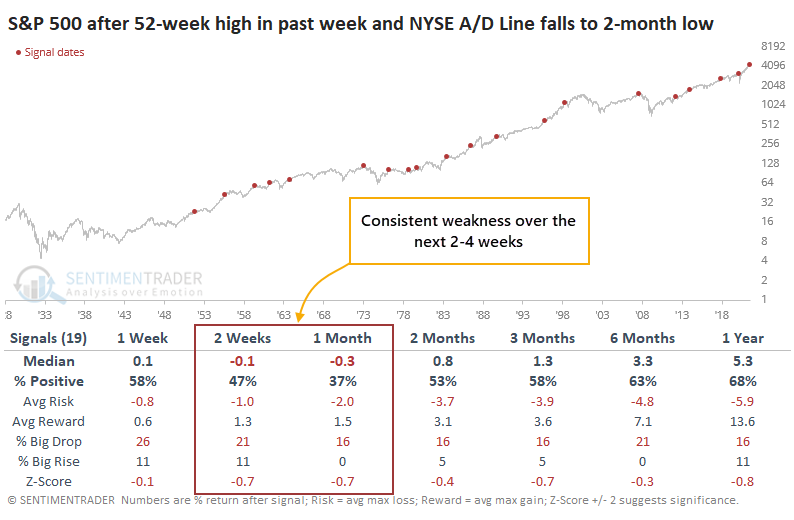
After the 43 signals since 1928, results are weak across all timeframes and the risk/reward profile looks unfavorable in the 1-2 week window.
DIVERGENCES IN BROADER MARKET BREADTH
All of this internal weakness has bled into broader measures. The Cumulative Advance/Decline Line for the NYSE has now sunk to a multi-month low.
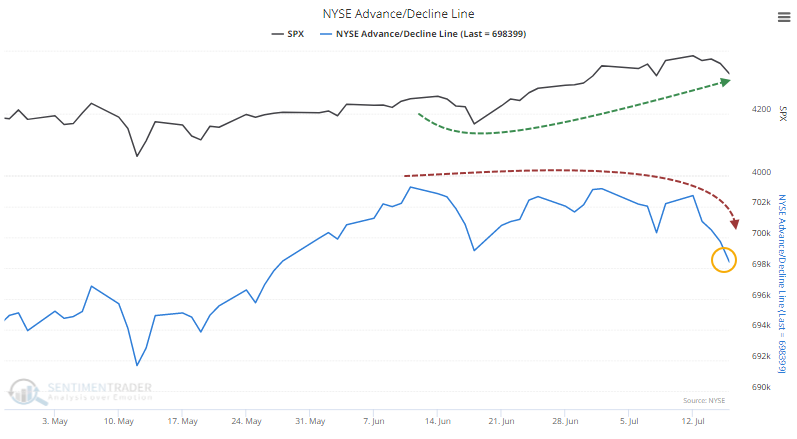
Since the A/D Line peaked on June 11, the S&P 500 has gone on to add more than 100 points and was perched at an all-time high within the past week. The A/D Line, in contrast, has sunk enough to be at its lowest point in two months.
This same phenomenon is playing out on the Nasdaq. Over the past 40 years, there have only been three other times when this triggered on both the NYSE and Nasdaq within days of each other.
These three preceded the 1990 recession, the 2018 letdown from a speculative peak, and the global pandemic.
INVESTORS ARE ALREADY FEARFUL?
Investors are already fearful, and that has to be a good sign for stocks.
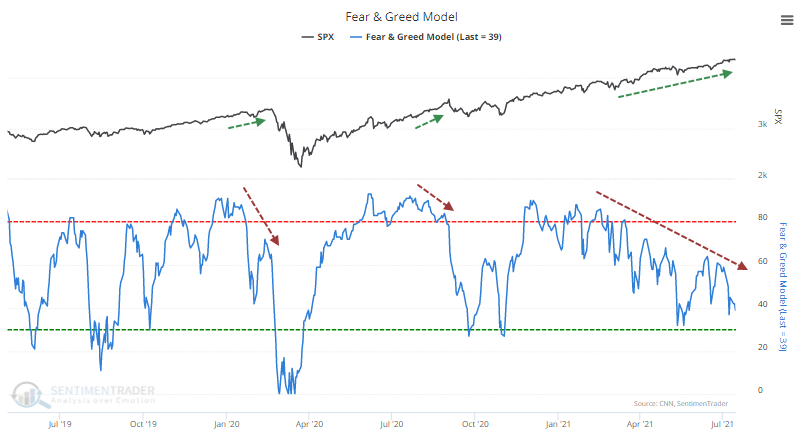
That's the theory being bandied about regarding the CNN Fear & Greed model. The news organization's sentiment measure has been sliding lower for weeks and is nearing a level considered to show fear.
We used their publicly revealed inputs to recreate the model, though to generate more history and hopefully more accuracy, we use different inputs for high-yield bonds and put/call ratios. There is about a 95% correlation between the two versions.
Unlike at market bottoms, sentiment often peaks well ahead of prices. Investors become euphoric, push prices higher, then gradually lose interest. Bull markets need steadily rising optimism to continue rising, so this is an issue.
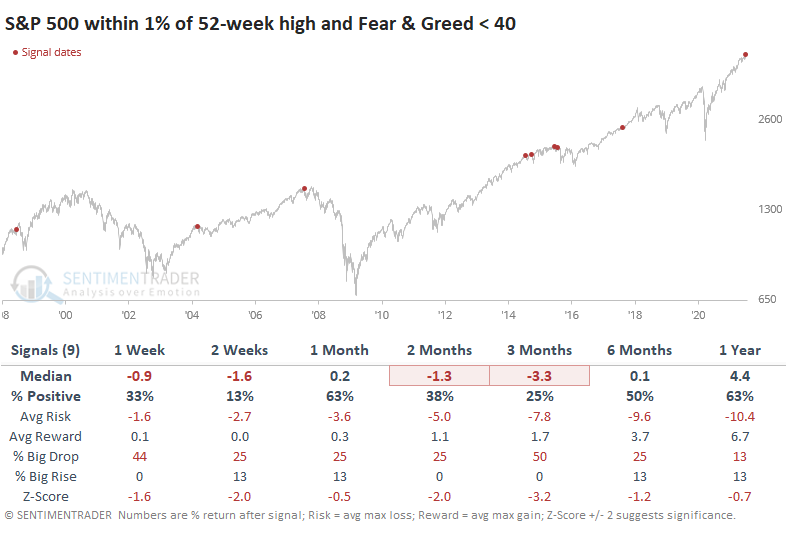
When the model fell below 40 but the S&P was still within 1% of its high at the time, future returns were not good. Over the next 3 months, the S&P rallied after 2 out of 9 prior signals.
GAMMA EXPOSURE IS AN ISSUE
The Gamma Exposure / Market Cap Ratio indicator has a history of signaling potential short-term weakness in the stock market according to Jay.
Gamma exposure refers to the sensitivity of existing options contracts to changes in the underlying price of the S&P 500. This indicator assesses the level of Gamma Exposure relative to the market capitalization of U.S. stocks. The higher the level, the more potential selling pressure.
The 50-day moving average of the Gamma Exposure / Market Cap Ratio is now above 0.15, a historically high level.
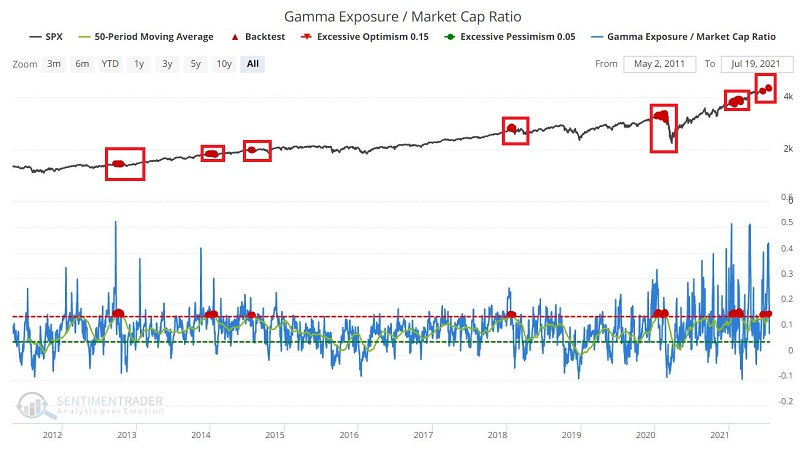
The table below displays the summary of previous signals according to our Backtest Engine.
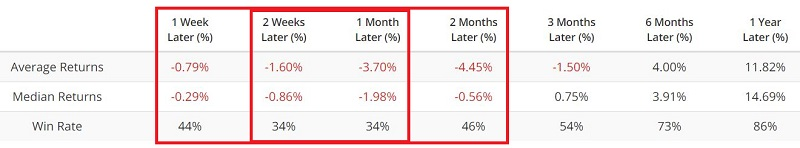
While anything can happen in the stock market, this indicator suggests that it may take the stock market at least a little while to fully bounce back from the recent spate of weakness. At the very least, this argues for patience and some tempered expectations for traders and investors in the near term.
THEY DON'T MAKE THINGS EASY
Some selling pressure to start the week made sense. There were ample and increasing signs of deterioration under the surface of the indexes, and it finally caught up to them.
In yet another concerted effort to buy every dip, though, that weakness lasted all of about one day. The buying stampede on Tuesday was remarkable, and it more than reversed the selling pressure from the day before.
The Up Volume Ratio cycled from below 15% to above 85% in back-to-back sessions on the NYSE.
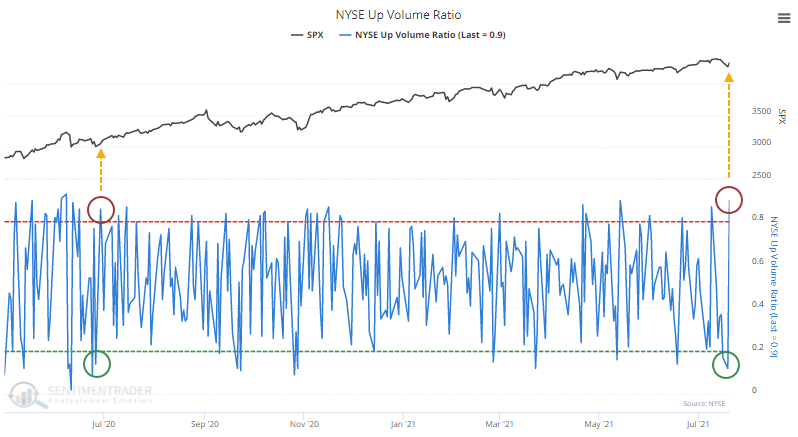
This triggered last June, and it marked the end of that little pullback, kicking off an impressive run over the next few months. That was much more the rule than the exception after a back-to-back reversal in Up Volume while the S&P 500 was within 10% of a 52-week high.
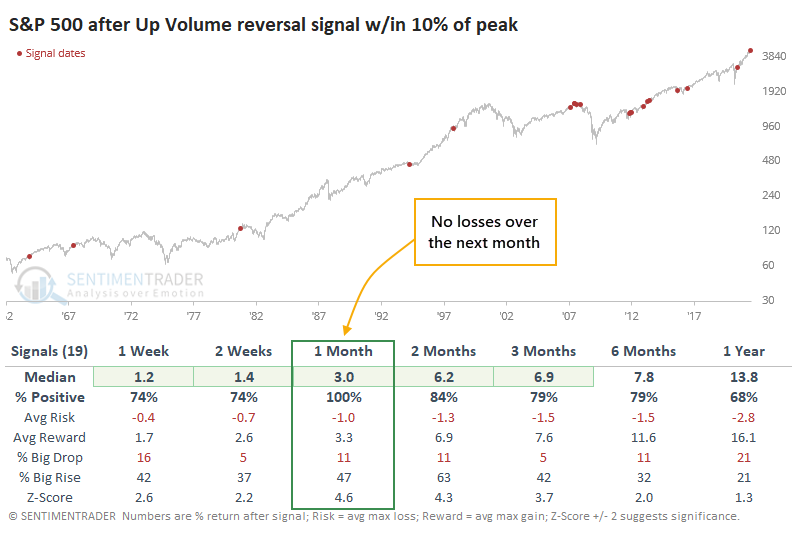
Since 1962, the S&P 500 never showed a loss in the month following similar signals.
The selling on Monday was "comfortable" in that it made sense given the pressures that had been building under the surface. It's iffy to put a ton of weight on a single session, and Tuesday didn't make up for all the worries that have been building. At the same time, it's tough to ignore the implications of similar back-to-back volume reversals. It seemed like things were finally starting to move in bears' favor, but after Tuesday, it's hard to have much faith in that, either.
STOCKS AND SECTORS - AIRLINES
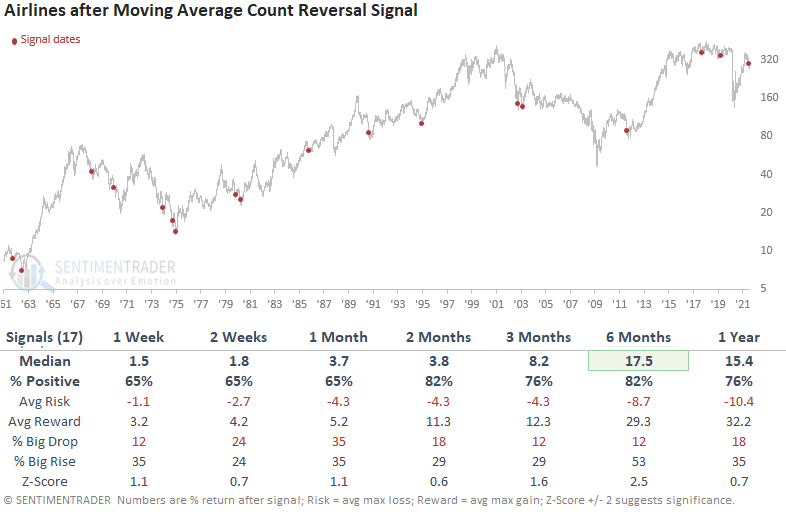
The Airline industry's consecutive days below the 10-day moving average came to an end on Wednesday, according to Dean.
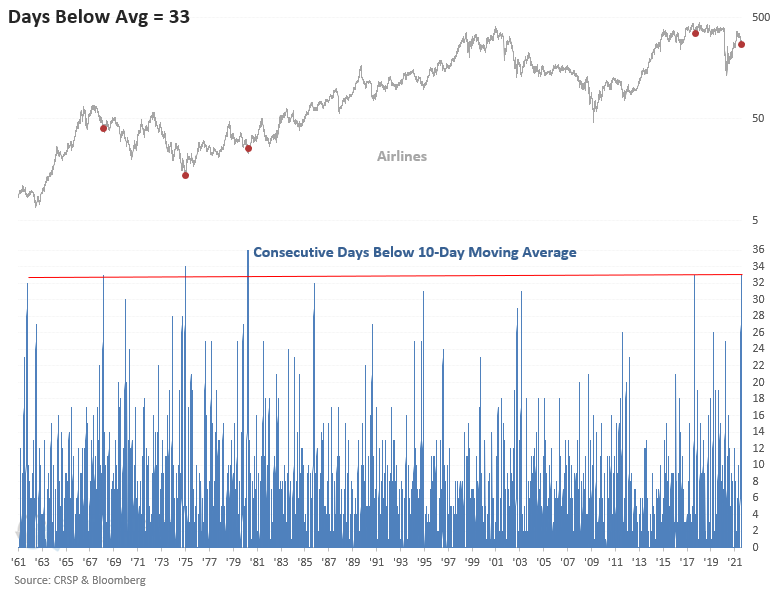
The moving average count reversal signal identifies when a stock, index, ETF, or commodity closes below its 10-day moving average for a number of days and then reverses higher, but also includes a momentum signal to make sure the underlying market is actually responding.
Aside from a few instances in the late '60s and the 1-year pandemic crash timeframe, the results look pretty good, especially the 6-month window.
STOCKS AND SECTORS - CONSUMER DISCRETIONARY
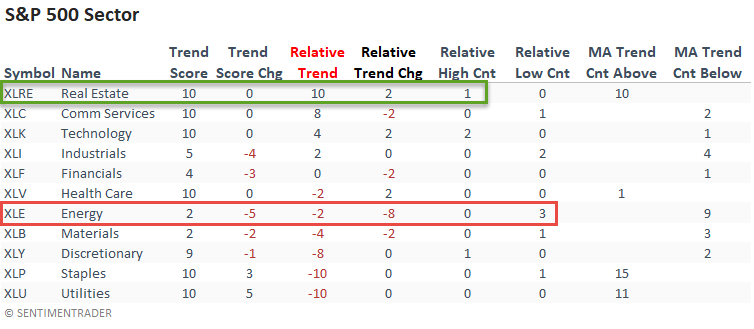
Dean updated his absolute and relative trend following indicators for domestic and international ETFs.
The relative trend score for the energy sector declined by eight points on a week-over-week basis, and the group registered a new relative low on 3 out of 5 days.
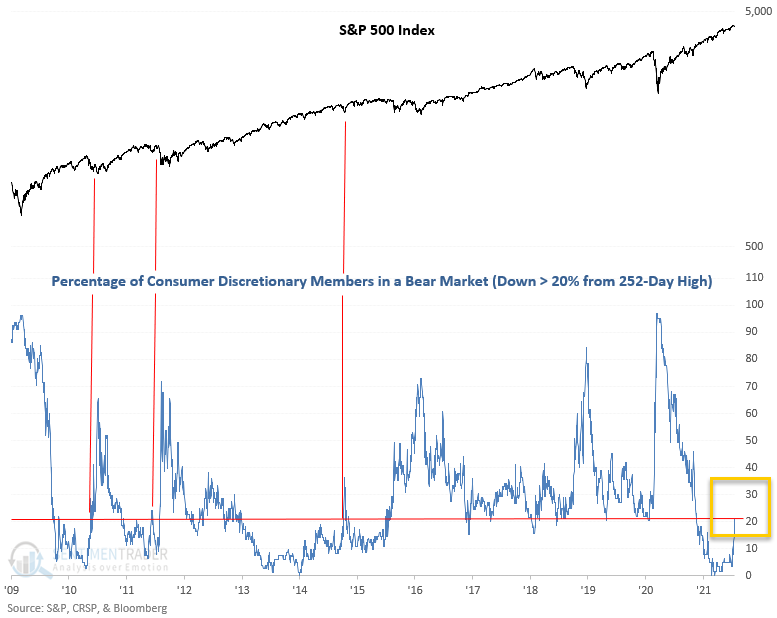
The percentage of S&P 500 consumer discretionary members trading down 20% or more from a rolling 252-day high crossed above 20% on 7/16/21. Starting in 2009, previous moves above 20% from a low starting point have all come within the context of a market correction. Given that the S&P 500 is only four days and less than 1.5% from its most recent high, this is very unusual.
In case you were wondering, the list contains several airlines, cruise lines, and hotels.
In addition to those sectors, the percentage of countries with a positive relative trend score versus the S&P 500 continues to worsen. It has now fallen to a level that suggests an even more negative forward return outlook for the MSCI ACWI World Index ex USA. The Asia/Pacific region fell to zero for the first time since June 2020.
STOCKS AND SECTORS - NASDAQ 100
Jay continued an impressive run of interesting options possibilities by highlighting a hypothetical trade using options on ticker QQQ, the Nasdaq 100 Trust.
First things first:
- As always, the example that follows is for educational purposes only and NOT a "recommendation."
- He is completely agnostic regarding the short-term direction for ticker QQQ (name)
- The example trade below would ONLY be entered by a trader who is highly confident in the belief that QQQ will NOT break out to new highs in the weeks ahead, AND;
- By a trader who is prepared to act to minimize risk if the need arises
The chart below displays the Annual Seasonal Trend for the Nasdaq 100 Index (the QQQ tracks index). There are never any guarantees with seasonal trends, but the fact that we are at a possible inflection point for NDX is fairly obvious.
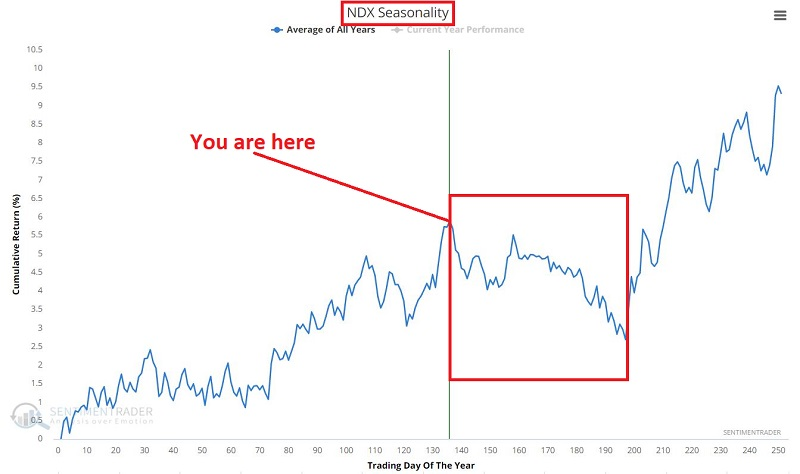
For technicians, it's notable that the MACD indicator has rolled over and crossed over to the downside.
For the sake of illustration, let's assume that our hypothetical trader looks at these and develops the opinion that QQQ is NOT going to rally strongly in the near term (repeating now, this is a hypothetical outlook for the sake of illustration).
In essence, our trader does not necessarily believe that QQQ is destined to break sharply lower from here. But they do believe that it will go basically nowhere for at least a little while, possibly trading in a range. A strategy that an options trader can employ in this situation is referred to as a "bear call credit spread."
This strategy is utilized by selling an out-of-the-money call option and simultaneously buying a further out-of-the-money call option.
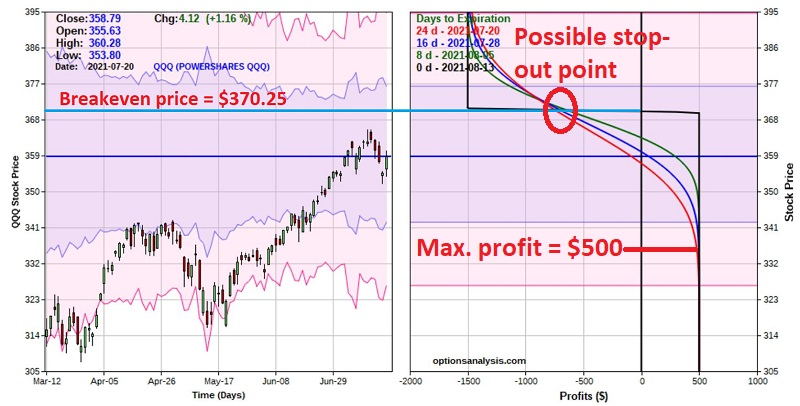
In a nutshell, this trade makes money if QQQ does anything EXCEPT rally 3.1% or more in the next 24 days. Clearly, the ONLY reason a trader would consider this position is if they are highly confident that the recent high will act as resistance and that any rally in QQQ will either halt there or not extend much above the recent high of $365.49.
Because this trade has three times as much downside risk as profit potential (sorry folks, that is just typically the nature of "selling premium" option strategy such as this one), it is critically important for our trader to plan out IN ADVANCE how they will react as this trade evolves.
| BONDS | ||
 | ||
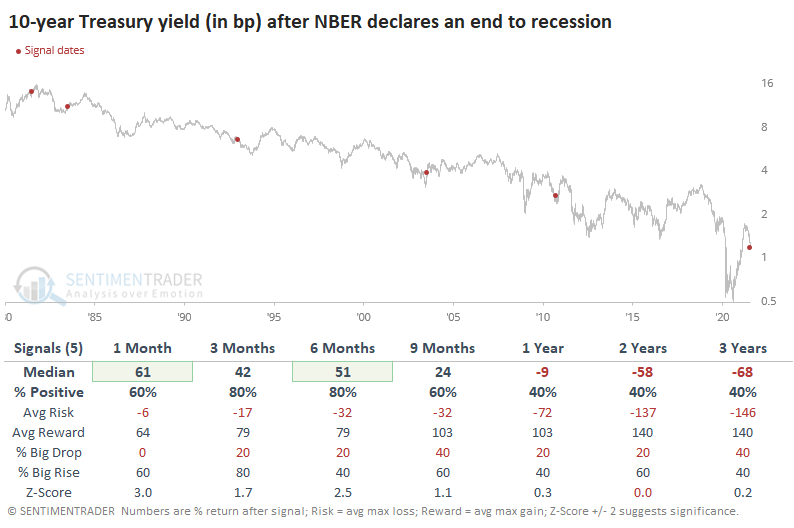
As noted above, the "official" arbiter of U.S. business cycles has declared that the economy pulled out of recession last April, ending the shortest recession on record.
The yield on 10-year Treasuries rose four out of five times during the 3-6 months following an announcement that a recession had ended but had trouble holding those gains as the long-term trend of lower rates asserted itself.
In late June, Jay wrote about a contrarian (at the time) bullish play using options on ticker TLT. This week, we discussed "adjusting" an open options position.
Once you buy a stock or ETF, you have three basic choices - hold it, sell some of it, or sell all of it. With options, there is any number of ways to modify, or adjust, an existing position.
When the original trade was entered, we traded a 2-lot - buying 2 of the Jan2022 150 calls and selling 2 of the Dec2021 160 calls. Now let's see what happens if we exit half of our position.
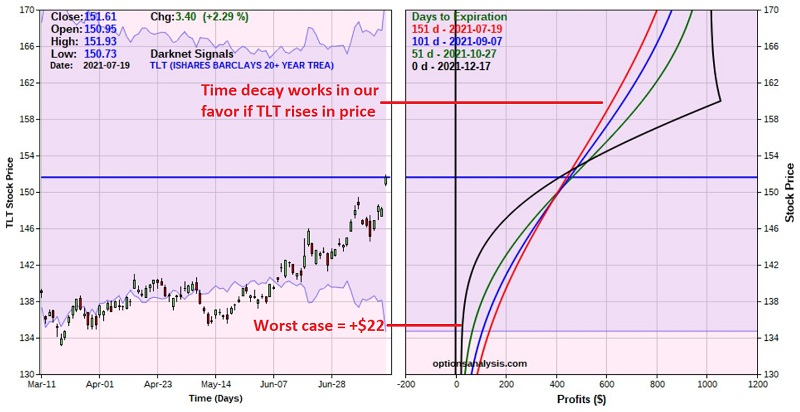
If TLT declines from here:
- This trade now has a locked-in profit (even if TLT falls apart, the worst-case now is a gain off +$22) regardless of how far TLT might fall
- On the downside, time decay won't materially affect the P/L until at least after the first week of September
If TLT rises from here:
- The trade still enjoys roughly another $600 in additional profit potential
- About the current price, time decay will work in our favor (note in the risk curve chart above how the blue, green, and black lines show successively higher profitability. This is because the December 160 call that we are short will lose its time premium much more quickly than the January 150 call that we are long)
- On the negative side, for eliminating the risk of loss, we also give up about $600 of profit potential versus the original position
IMPORTANT: Choosing when to prioritize risk reduction versus profit maximization is entirely up to the individual trader. This example adjustment is not telling you what you SHOULD do, only what you CAN do in this given instance IF you decide to take advantage of the pop-up in the price of TLT to reduce (or, in this case, eliminate the risk of loss).
| COMMODITIES | ||
 | ||
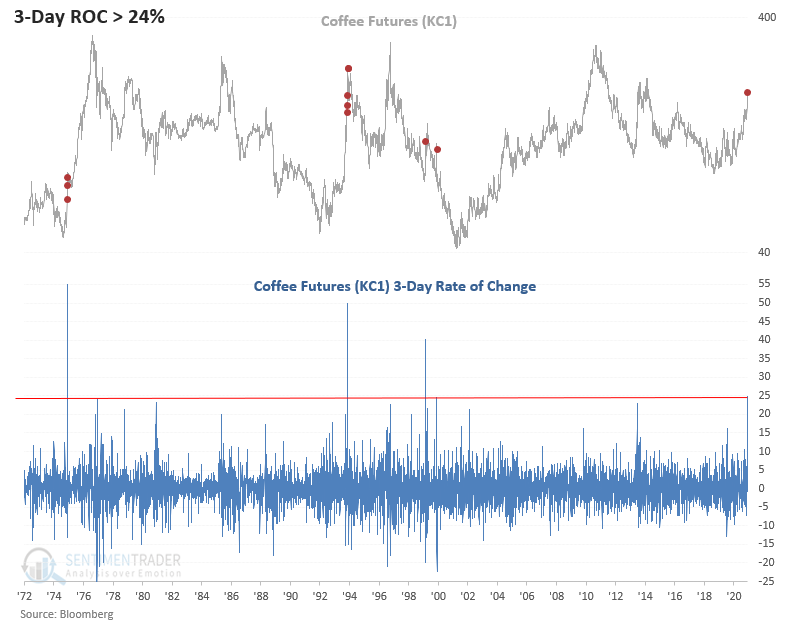
Dean noted that coffee is surging on weather-related news out of Brazil. On an intraday basis, the 3-day rate of change is greater than 24%. Typically, the big surges occur in structural bear markets for the commodity. The mid-1970s and 2002 are the only instances that kicked off a sustainable bull market.
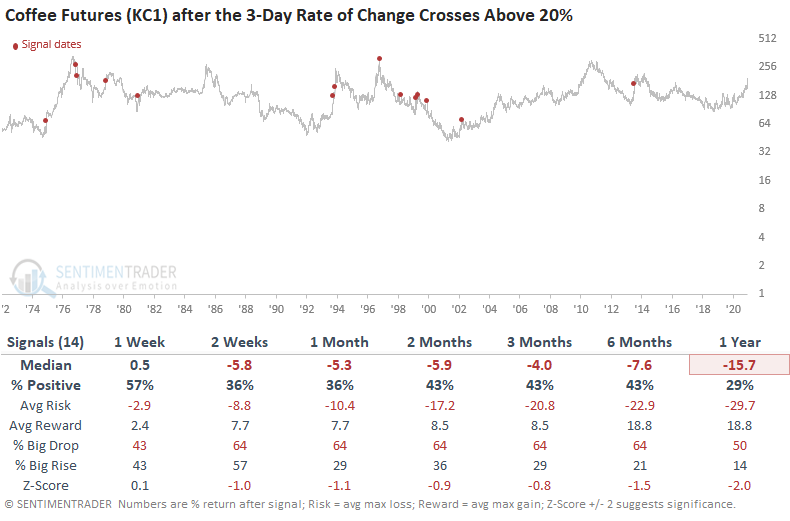
 Returns look weak across all timeframes, especially the 1-year. However, a bearish short position is not without risk, as some of the first signals out of a bear market continued to ramp higher.
 UPDATING USO
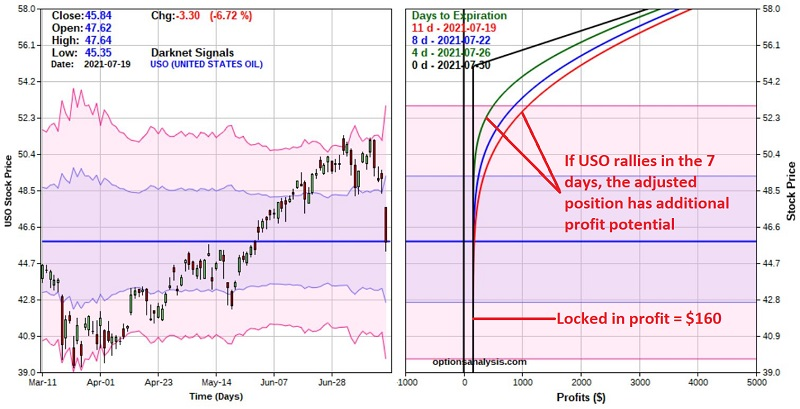
Jay updated an options trade example he detailed last week - which was based on Dean's system work - and highlighted a possible course of action regarding that trade.
The original USO example trade utilized a strategy referred to as a "Bear Call Credit Spread."
Since 7/15, USO declined from $49.04 a share to $45.84. At this point in our example trade, we have hypothetically captured 74% of our maximum profit potential in just 2 trading days. At this point, a trader holding this position has two obvious choices, either close the trade or hope it continues and captures 100% of the profit potential.
For the sake of argument, let's assume that a trader holding our example position now thinks that the selloff in crude oil was overdone in the short-term and that there is a strong possibility of a snap-back rally in the very short term. If a trader held this outlook, one alternative possibility would be to:
- Buy 10 July 30 52 calls
- BUT continue to hold the 10 July 30 55 calls
In this case, the trader is left with 10 long calls at a strike price of $55 a share for ticker USO. Is USO likely to rally all the way to $55 a share in the next 11 days? Not really. So why would a trader even consider this action?
First off, the chart below displays the risk curves for the new, adjusted trade, having taken a profit on 10 short calls and continuing to hold 10 long calls. Notice how the nature of the reward-to-reward profile changes dramatically.
The point here is NOT to argue whether or not crude oil will rally in the days ahead. The point here is that the position above affords a trader who believes there COULD be a rally in the next week:
- The opportunity to profit from that outlook
- Without having to enter an entirely new trade
- And without risking their current open profit
Options trading offers traders a great deal of flexibility. Whether they ultimately use that flexibility to their advantage or disadvantage is entirely up to each trader.
DECISION TIME FOR GRAINS
Jay noted that corn and soybeans have bounced from their recent lows and are no longer oversold on a short-term basis.
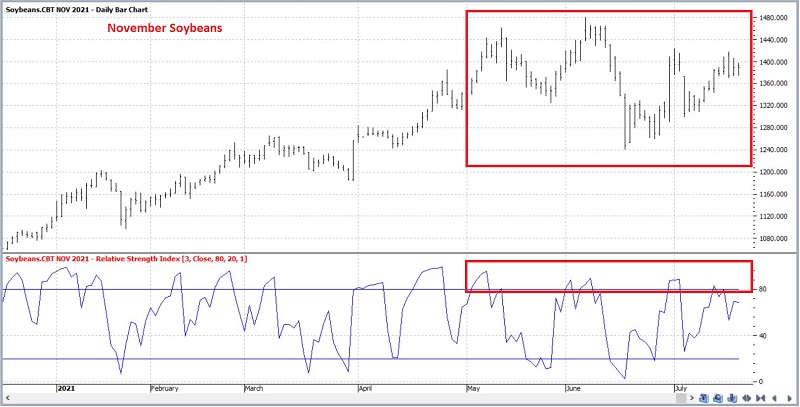
As a reminder, the annual seasonal trend for soybeans appears in the chart below.
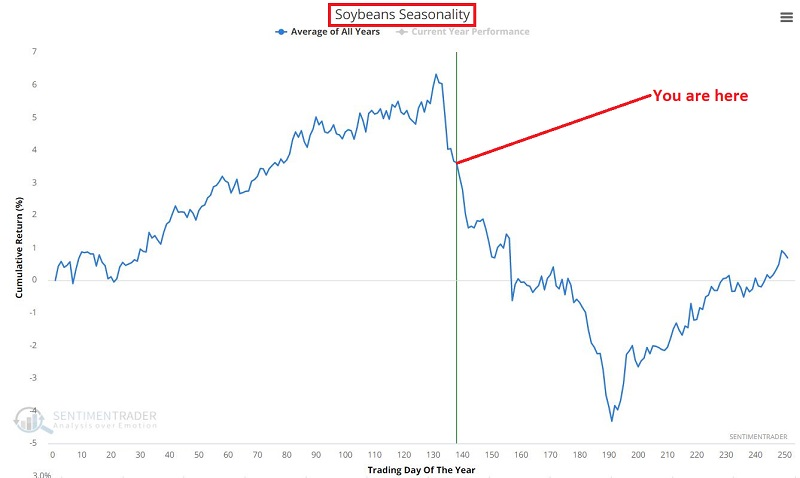
It is important to note that despite the scary nature of the seasonal charts above, in any given year, corn and/or soybeans can rally sharply when they are "not supposed to," typically due to extreme weather in the planting and/or growing seasons.
The reality is that it is impossible to predict whether the typical seasonally unfavorable bias will kick in or whether this will be "one of those years" for grains. But if it is going to happen this year, this seems like as good a time as any.