
TradingEdge for Aug 6 - Economic Misses, Macro and Breadth Deterioration

The goal of the Weekly Wrap is to summarize our recent research. Some of it includes premium content (underlined links), but we're highlighting the key focus of the research for all. Sometimes there is a lot to digest, with this summary meant to highlight the highest conviction ideas we discussed. Tags will show any symbols and time frames related to the research.
| STOCKS | ||
| ||
When economic releases beat economists' expectations, they raise their forecasts for the next releases. Like investors, economists suffer terribly (in aggregate) from recency bias.
And recently, that bias has been ugly. Hard economic releases covering topics like labor conditions, housing, and industrial performance, have missed expectations by an average of 22%. It's been more than a year since the gauges of the "real" economy have disappointed by so much.
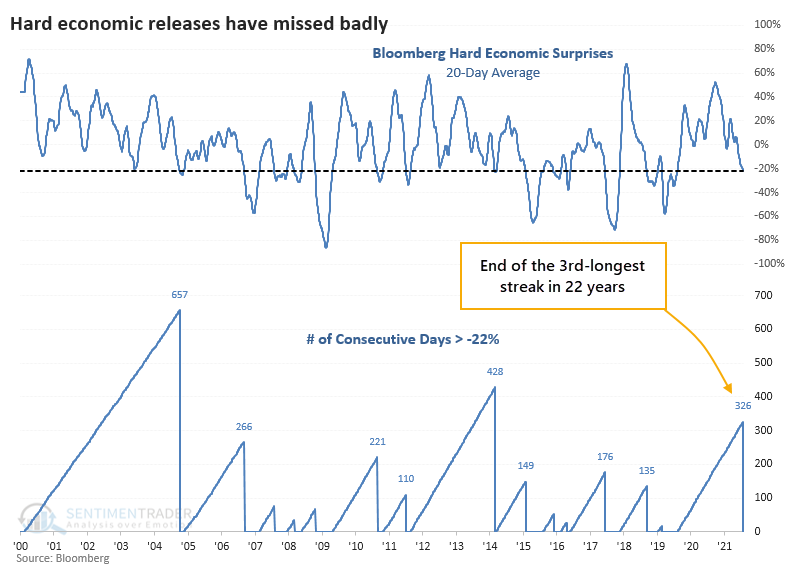
The 20-day average of Bloomberg's real economic surprises has eclipsed -22% for the first time in well over a year. This ends the 3rd-longest streak of "not really bad" surprises in over 20 years.
For equity investors, this was not necessarily a good reason to sell.
Despite a string of disappointing economic news, the S&P 500 tended to hold together. There were a couple of larger interim losses in the fall of 2011 and winter of 2018, but otherwise, stocks gained by at least a modest amount in the months ahead. Over the past decade, the S&P's returns were only modest at best during the next couple of months, though.
These signals preceded relatively weak returns for Energy stocks, while Technology did well. That doesn't fit very well with some other studies that have triggered lately.
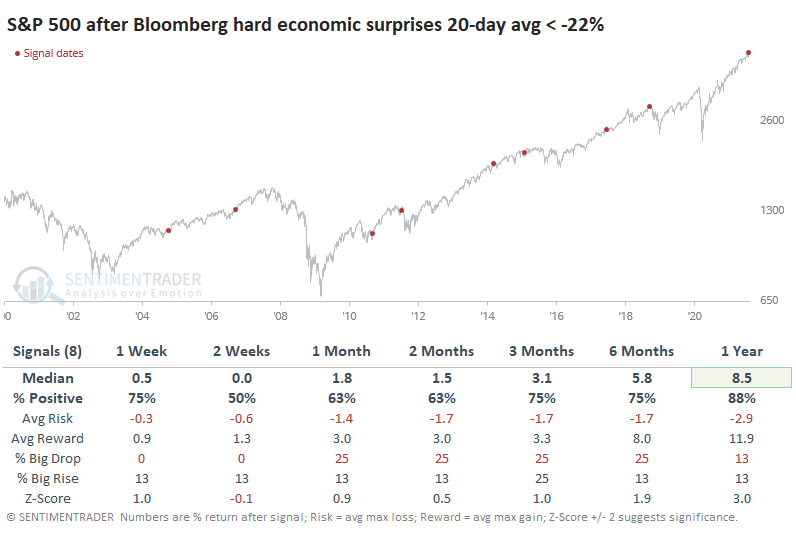
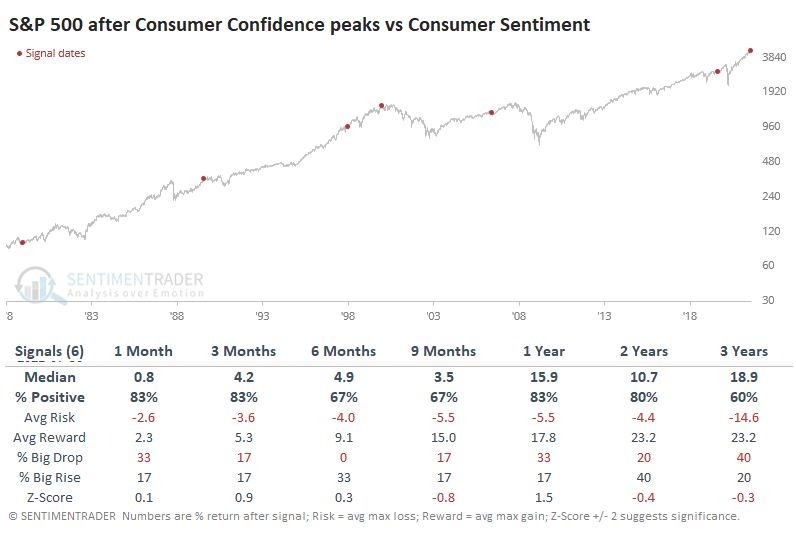
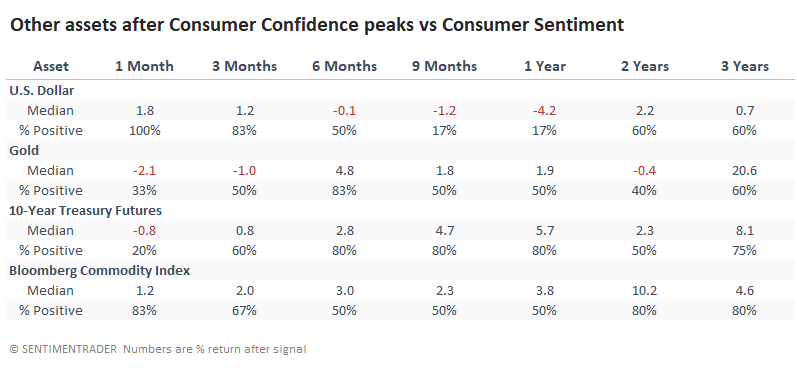
CONSUMERS ARE CONFIDENT BUT NOT OPTIMISTIC
Consumers are a lot more confident than they are optimistic.
Those seem like they should be the same thing but aren't necessarily so. As measured by the Conference Board, consumer confidence was at extremely high levels as of the end of July, while Consumer Sentiment, as measured by the University of Michigan, was in the middle of its long-term range.
It makes sense that consumers would feel good about employment prospects and pay (Consumer Confidence) while also worried about a jump in prices for everyday necessities (Consumer Sentiment). Whatever the reasons, we can see below that the spread between Confidence and Sentiment is now the widest in history.
Assuming that July's reading will mark the peak spread between the two surveys, the table below shows returns in the S&P 500 following all other notable peaks in the past 40+ years.
For the most part, stocks held up well...for a while. The biggest issue is that stocks fell into a bear market following these divergences at some point - and it was an inconsistent "at some point." They preceded trouble in 1990, 2000, 2008, and 2020. The first two triggered within months; the latter two took a long time to play out. It's hard to rely on something with such inconsistent timing.
Among sectors and factors, some of the best returns were in Energy, Health Care, and Defensive stocks in general.
A wide disparity in how consumers feel about the economy, depending on which part of the economy they're focused on, can be a cause for concern. The best returns tend to occur when broad swaths of them feel poorly and become optimistic. Now, we see high confidence in some parts and pessimism in others. Divergences, in general, tend to harm forward returns. With this particular set of data, the timing has been too inconsistent to be an imminent worry for investors. It might be more of a concern for longer-term bulls on the dollar.
SOME MACRO DETERIORATION
At the end of July, our Macro Index Model dropped from above 0.70 to below 0.70. Generally speaking, a reading of 0.70 or above is considered "favorable" for the stock market. While a drop below 0.70 does necessarily constitute a "sell everything and head for the hills" type of signal, it nevertheless is an unfavorable development, as it knocks another pillar out from under the market.
Jay highlighted a simple method incorporating the Macro Index Model with price action in this piece. For the record, this method is presented solely for educational purposes and should not be considered as investment advice or as a trading recommendation.
We will essentially create a model with two inputs:
- If the Macro Index Model is >= 0.70 then Model Input1 = 1 else Model Input1 = 0
- If the S&P 500 Index is above its 10-month average then Model Input2 = 1 else Model Input2 = 0
The chart below displays the history and current status of our Macro Index Model. You can see the latest drop below 0.70 highlighted in the red box on the far right-hand side of the chart. So, Model Input1 = 0.
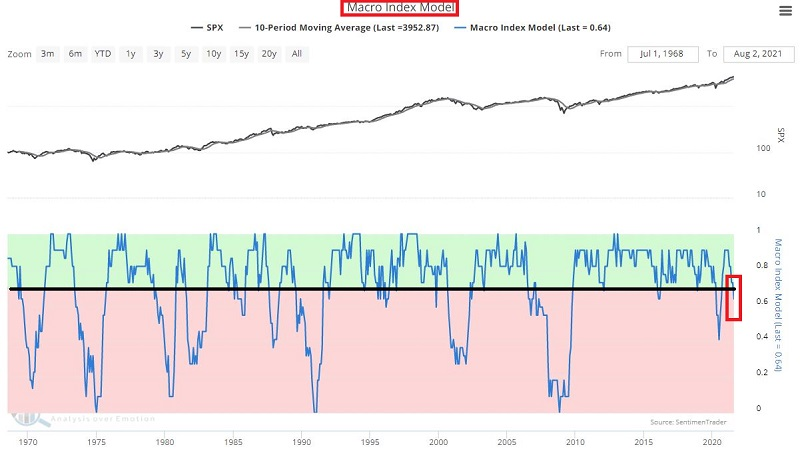
When combining these two simple monthly indicators, our model can read 0, +1, or +2. At the end of July, the current reading fell from +2 to +1. What does this imply for the market and investors? Let's take a closer look at the possibilities.
The chart below displays the cumulative % return for the S&P 500 Index if held long ONLY during those months when the previous month ended with:
- EITHER the Macro Index Model >= 0.70 OR the S&P 500 Index > its 10-month moving average, i.e., a model reading of +1, but NOT both.
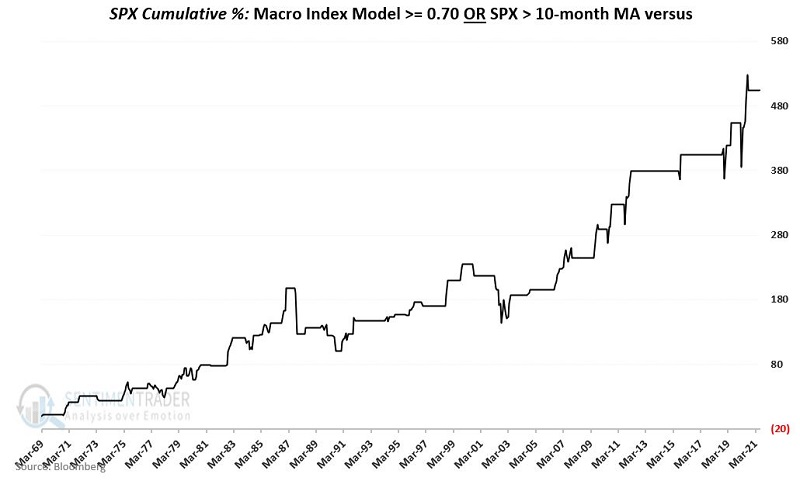
The overall trend was good, but there were some significant price shocks along the way (including 1987, 1990, 2002, 2018, and 2020). The maximum drawdown (using monthly data) was -32.4% (versus -52.6% for buying and holding the S&P 500 Index).
With the S&P 500 Index still well above its 10-month moving average, this simple model now holds a reading of +1. Based on the results above, an investor might:
- Continue to give the stock market the benefit of the doubt
- But at the same time, be prepared for a potentially significant price shock
Generally speaking:
- If BOTH price AND fundamentals are favorable, the probabilities favor a bullish stock market
- If EITHER price OR fundamentals are favorable, there is a good chance that the stock market can perform well
- IF NEITHER price NOR fundamentals are favorable, there is no guarantee that the stock market will decline. However, that is when most major bear market activity in the past 50+ years has occurred.
BREADTH DETERIORATION, TOO
The S&P 500 Index closed at a new all-time high on 8/3/21. Whenever an Index registers a new high, Dean assesses the market's internal condition to see if the troops are participating using 6 internal breadth metrics to develop a composite score.
Composite values can turn negative during corrections and bear markets as new lows overwhelm new highs in the spread calculation.
Dean identified every all-time closing high in the S&P 500 Index since 1928, of which there were 1,317 instances. He then ranked each breadth composite value on the day of the all-time closing high. Rankings range from 100 (strongest) to 0 (weakest).
After a string of less than desirable rankings in June, market breadth for the S&P 500 improved. However, it's not as strong as the data between March and May. Unfortunately, the same cannot be said for the S&P 1500 rankings, as participation remains weak.
While short-duration components in the S&P 1500 composite have been soft for some time, we are now seeing some long-duration indicators retreat off the best levels. The percentage of members above the 200-day moving average is one example.
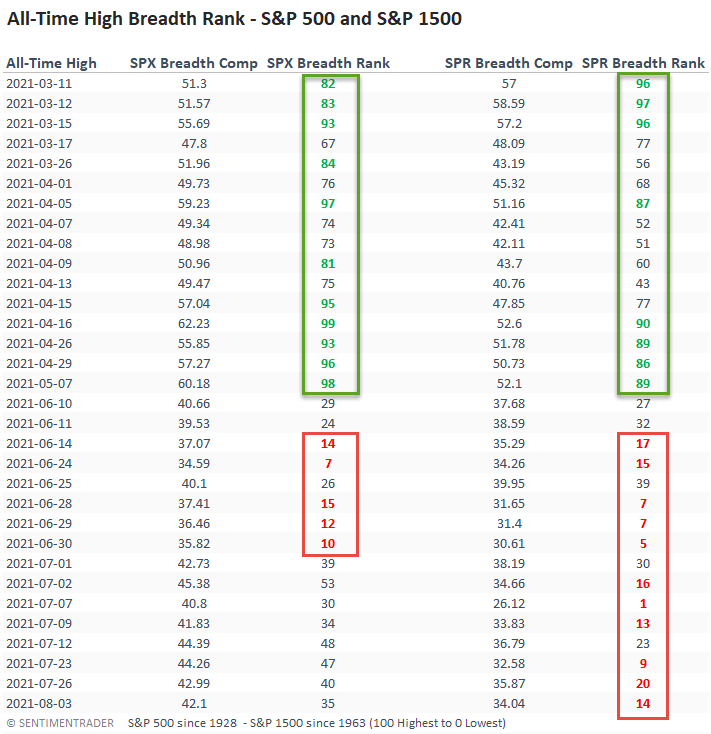
Long-term measures of market breadth continue to remain healthy. Therefore, we must respect the trend and stand firm with a constructive outlook on the market but keep a close eye on these deteriorating figures.
WATCH VALUATION AND VOLATILITY
Jay took a look at the current extreme in the PE/VIX Spread.
"This indicator shows the spread between the forward price/earnings multiple on the S&P 500 and the VIX volatility gauge. The higher it is, the more investors are willing to value stocks while not suffering the consequences of high volatility, leading to poor future returns. A very negative spread shows that investors may be pricing in too great of a swing in prices relative to the earnings that stocks will likely be generating."
In a nutshell, this indicator is where valuation and sentiment meet. The reason I bring it to your attention now is that it may soon be on the cusp of a potentially important signal.
This test looks for a day when the 50-day average of the PE/VIX Spread drops below 5. It doesn't often happen, so a small sample size is a concern. Still, the intermediate-term results seem worth noting.
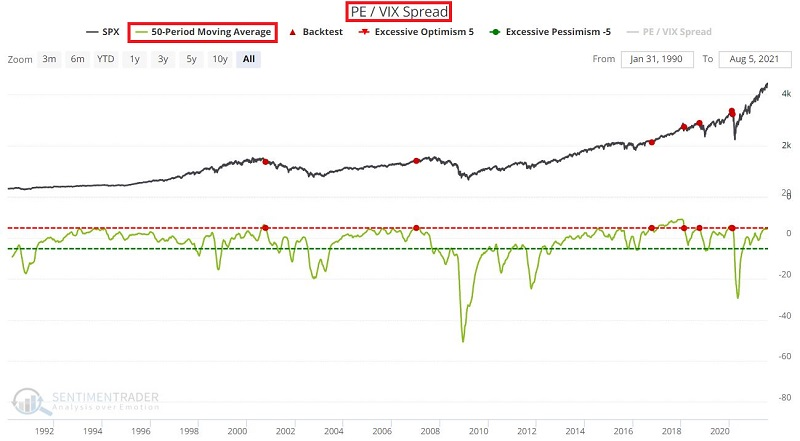
The table below displays the results of previous signals. The key thing to note is the deeply unfavorable results registered 2 months and 3 months after previous signals (although after that, results were much better, so we are talking about an intermediate-term indicator).
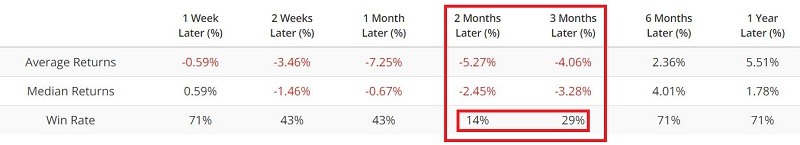
The PE/VIX Spread 50-day average is presently above 5.00. There is no way to know how long it might be before this measure drops back below 5.00. However, it might make sense for investors to play some defense over the subsequent few months once it does.
STOCKS AND SECTORS - OVERSEAS STOCKS
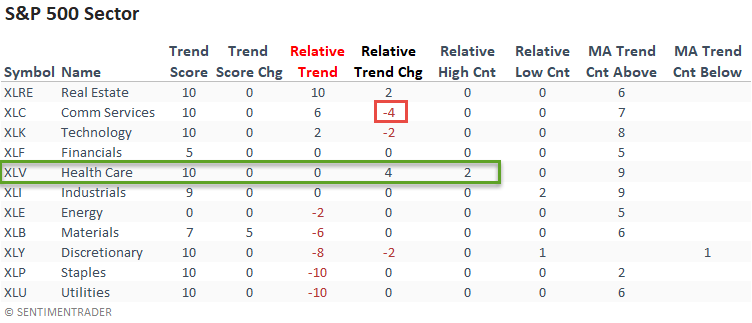
Dean shared his absolute and relative trend following indicators for domestic and international ETFs.
The relative trend score for the traditionally defensive health care sector had a solid w/w change, and it was the only group to register a relative high. The communications sector lost its perfect trend status as it lost ground on a relative basis.
Real Estate continues to look good.
The percentage of countries with a positive relative trend score versus the S&P 500 showed a slight uptick on a w/w basis. However, the current level suggests an unfavorable environment for the MSCI ACWI World Index ex USA.
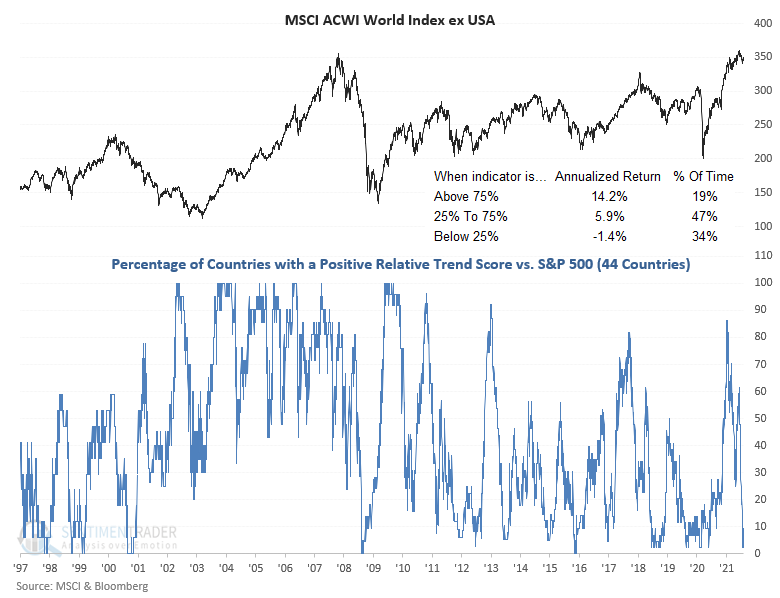
The percentage of countries with a relative trend score of -10 versus the S&P 500 remains at a level that suggests negative returns for the MSCI ACWI World Index ex USA.
Dean also shared a concept that we can use to identify a hypothetical buy signal for each time series when the relative performance trend reverses direction from an extreme level.
The percentage of countries with a positive relative trend score buy signal identifies when this figure is oversold then starts to change, as long as the underlying index shows some positive momentum.
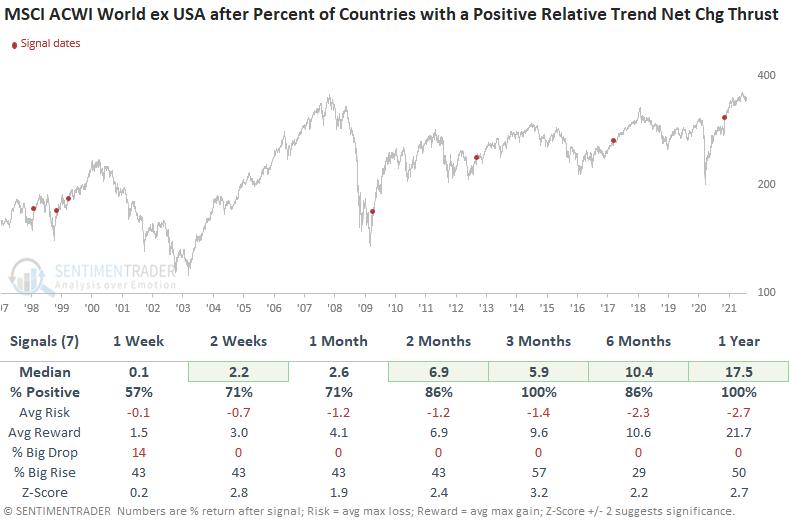
The first condition for the percentage of countries with a positive relative trend score is now confirmed, and we need to wait for the other conditions to trigger.
STOCKS AND SECTORS - ENERGY
Energy stocks enjoyed a historic thrust off their low, following a complete give-up among investors.
For the past few weeks, they've been stuck in neutral. While many are still holding above their long-term trends, none of them have managed to close above their medium-term 50-day moving averages for three straight weeks.
This is the longest stretch since the end of 2018. Over 70 years, this is now tied for the 4th-longest streak without a single stock in a medium-term uptrend.
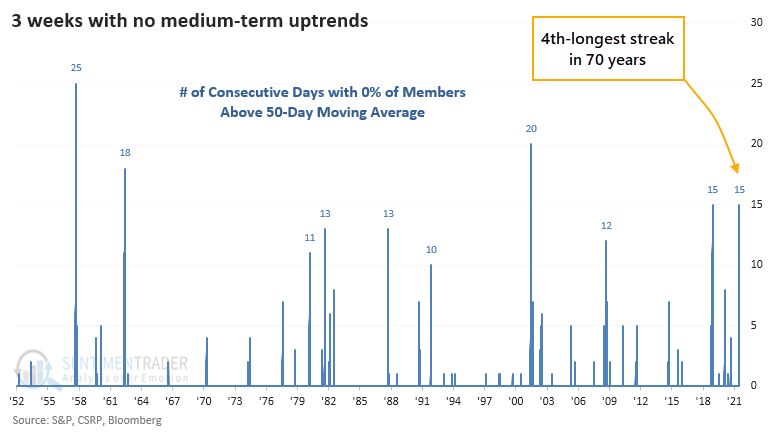
Energy stocks suffered a similar bout of medium-term failure at the end of 2018, but before that, there were only three other comparable stretches since 1952.
The other four saw the sector rally over the next couple of weeks, but then it faltered a couple of times. The 2001 occurrence was the only one that ended up leading to a protracted downtrend, though the 2019 signal did eventually lead to the pandemic crash.
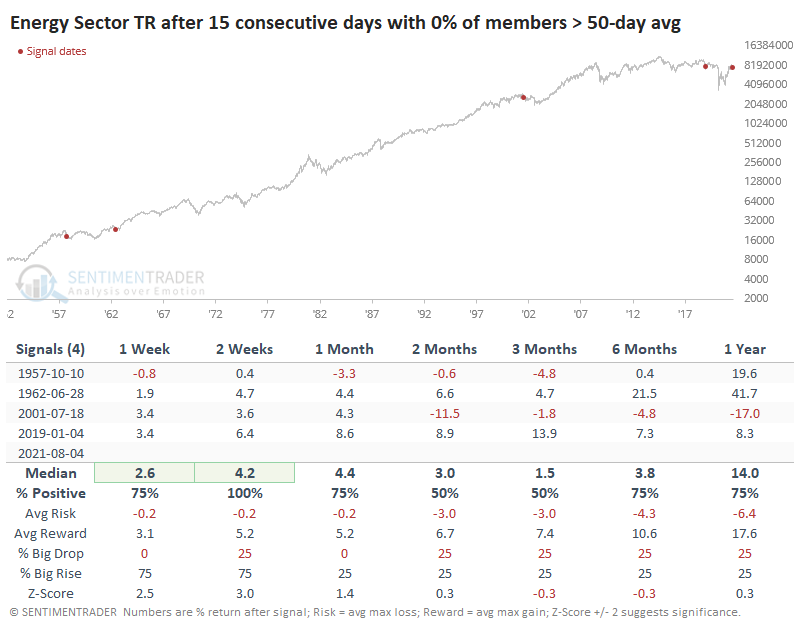
If we relax the parameters to look for streaks of 10 consecutive days with no energy stocks trading above their 50-day averages, we continue to see mostly positive returns in the week and months ahead. Since 1960, none of them led to a loss of more than -3.5% over the next three months.
STOCKS AND SECTORS - FORD MOTOR
Jay wanted to make an important point right at the outset of a recent piece of research about seasonality in Ford. It wasn't an article about market timing or when to buy and sell the stock of Ford Motor Company. In reality, it was actually an article about the importance of how you allocate capital.
The table below displays the cumulative % return for Ford stock (ticker F) each month between 7/31/1972 and 7/31/2021, i.e., 49 years.
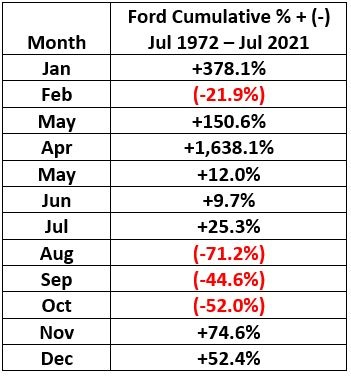
August, September, and October have all shown devastatingly negative results over the past 5 decades. A long position held in Ford stock ONLY during August, September, and October since 1972 has lost -92.3% of its value.
To put it another way, if you started in 1972 with $1,000 and pursued the strategy above, today, you would have roughly $77 left. And no, none of the above is a misprint.
The chart below displays the cumulative hypothetical return of Ford stock ONLY during August, September, and October since 1972. The squeamish may wish to avert their eyes.
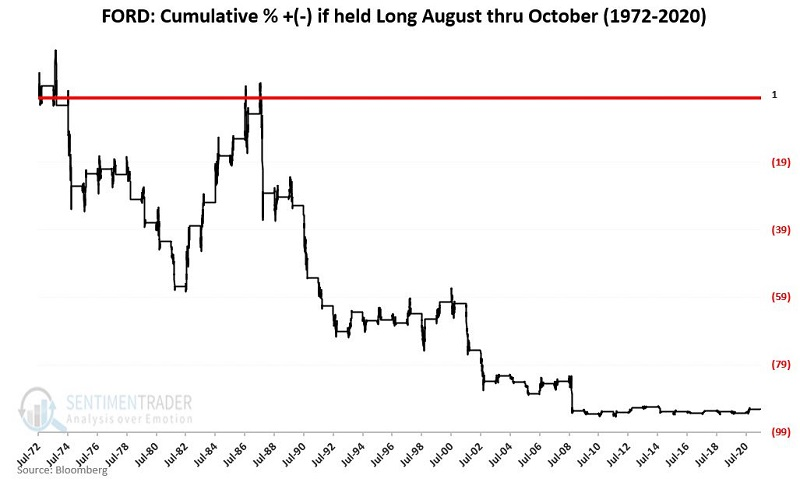
Can Ford advance in price between now and October 31st? Absolutely. But does investing right this moment in Ford seem like one with a high probability of success? That is an entirely different question.
And it is a question that each investor/trader must answer for themselves.
| BONDS | ||
 | ||
As noted above, hard economic surprises have been greatly disappointing economists.
We might expect such soft performance in economic indicators to lead to a bump in bond prices (lower yields), but we would be wrong. The opposite was more the rule than the exception.
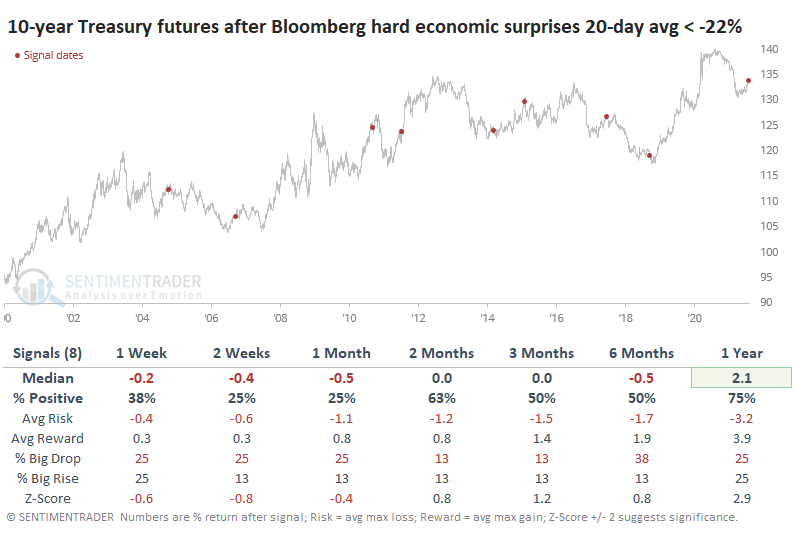
Prices on 10-year Treasury futures showed a loss every time, sometime between 2-4 weeks later.
| COMMODITIES | ||
 | ||
Above, we looked at the difference between Consumer Confidence and Consumer Sentiment.
The dollar rallied in the few months following these signals for other assets, then declined 5 out of 6 times over the next 9-12 months. Treasury note futures prices dropped shorter-term, then rallied 6-12 months later. Gold and commodities were mixed.
MORE ABOUT GOLD (MINERS)
Gold miners have been struggling to hold up with a multitude of cross-currents. They've gone almost nowhere for a month and a half, though they finally started to show some life in recent sessions.
Thanks to their tepid early summer, over the past 20 days, an average of fewer than 12% of gold miners were trading above their 50-day moving average. That is now starting to curl higher.
The Backtest Engine shows that miners often fell back in the very short term before recovering over the next couple of months (click the Backtest Engine link to load this test). These are times when the 20-day average of medium-term breadth was below 12% then crossed above.
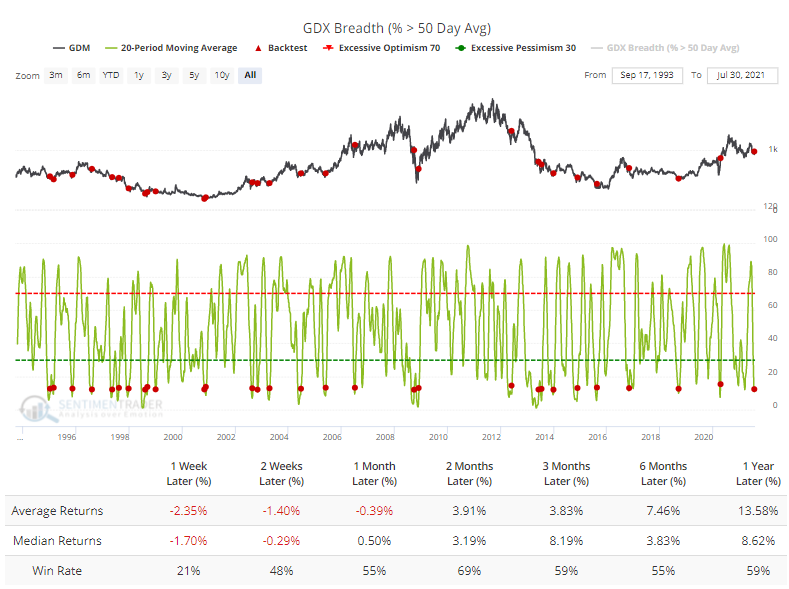
Long-term, there are worries. The percentage of miners in a bear market, more than 20% off their 52-week highs, is rolling over from a very high level. The Backtest Engine shows weak short-term returns again, and these had more of a tendency to persist.
Fewer than 15% of gold miners had a rising 200-day moving average, which is starting to curl higher. The Backtest Engine shows us that once again, short-term returns were weak.
There was a recent spike in 52-week lows, with 22% of gold miners hitting that extreme recently. The Backtest Engine shows decent returns following an ebb in a rise in new lows.
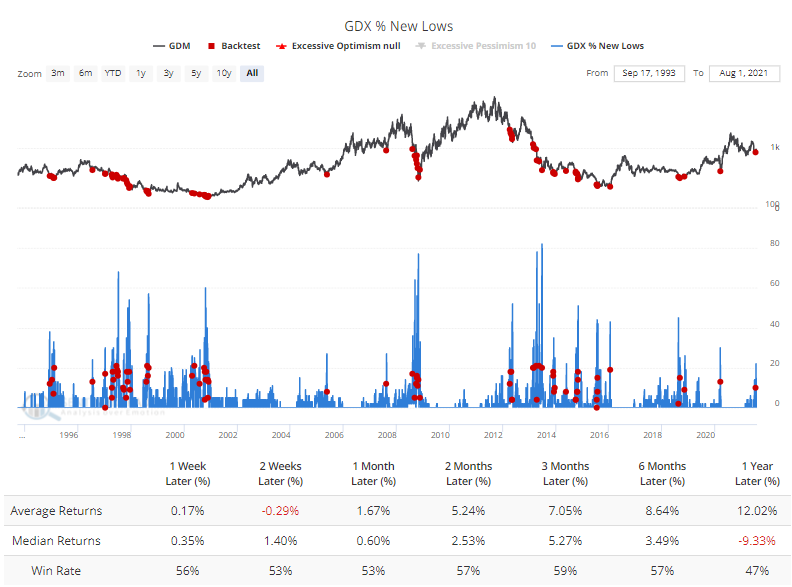
None of these are especially encouraging for gold investors and those who prefer to focus on real companies in the sector instead of a commodity. Breadth among miners has been poor on all time frames, but not so poor that it suggests a high probability of a long-term washout among sellers. The momentum thrust in 2020 has some impressive precedents for long-term gains, but bulls will want to see buyers willing to step in soon.
AN EYE ON SUGAR
Jay showed that, like many commodities, sugar futures have enjoyed a terrific run, having doubled in price since the April 2020 low. However, in recent months the pace of the advance has slowed, and sugar has repeatedly "bumped its head" against overhead resistance.
The most bullish thing sugar can do is power up through the 19.00 level and run to new highs. Will this happen? It certainly could. However, at the moment, there are a couple of warning signs to consider.
The chart below displays the Annual Seasonal Trend for sugar futures.
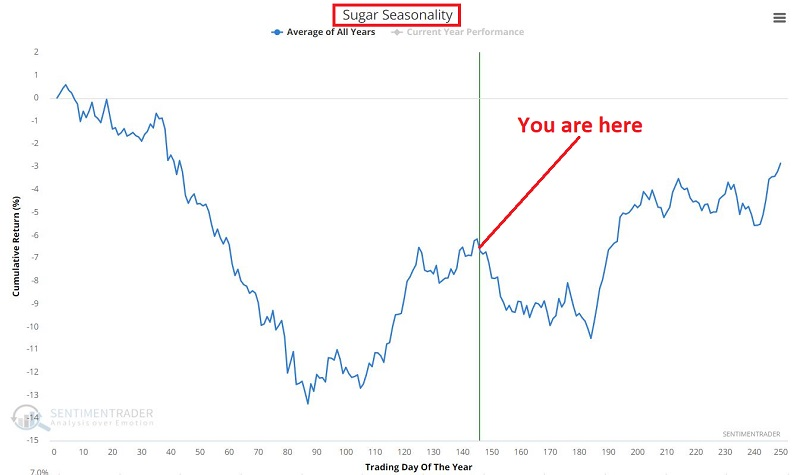
Since 1975, the sugar market has had a seasonally unfavorable period from Trading Day of the Year (TDY) #145 through Trading Day of the Year #170. It is essential to point out that seasonal trend charts look backward at what has happened in the past and not forward.
Based on sentiment, the near-term outlook for sugar is decidedly mixed. In this Backtest Engen Scan, we look for days when the price of sugar is above its 20-day moving average, and then the 20-day Optix for sugar is above 70.
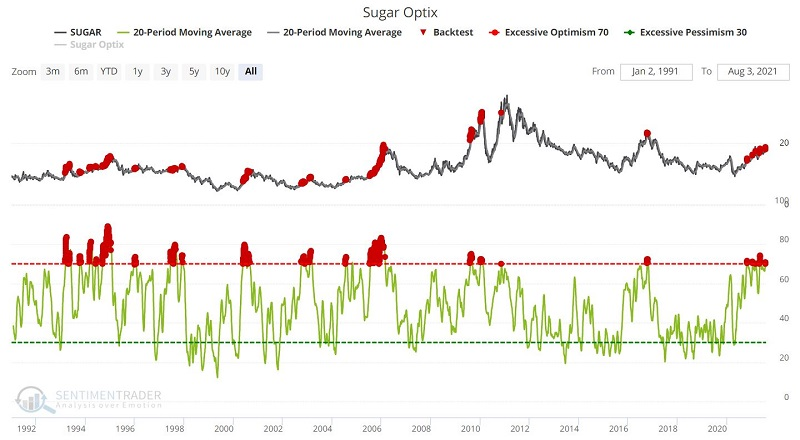
The first month after signals, the results are basically a coin-flip, but 1-year returns have been decidedly unfavorable, with a median return of -13.4% and a win rate of only 30%.