
TradingEdge for Jun 25 - Some Internal Divergences, A Dollar Pain Trade

The goal of the Weekly Wrap is to summarize our recent research. Some of it includes premium content (underlined links), but we're highlighting the key focus of the research for all. Sometimes there is a lot to digest, with this summary meant to highlight the highest conviction ideas we discussed. Tags will show any symbols and time frames related to the research.
| STOCKS | ||
 | ||
For the first time in over a year, one of the oldest forms of technical analysis has triggered a sell signal. According to Dow Theory, both the Dow Jones Industrial and Transportation averages should:
- Set a new high
- Pull back in a reaction against those new highs
- Rebound by 3% or more but without setting a higher high
- Decline below the pullback low
That pretty much sums up the past two months in the averages.
Since the year 1900, there have been 47 prior sell signals. Not surprisingly, the Dow Industrials have not responded well.
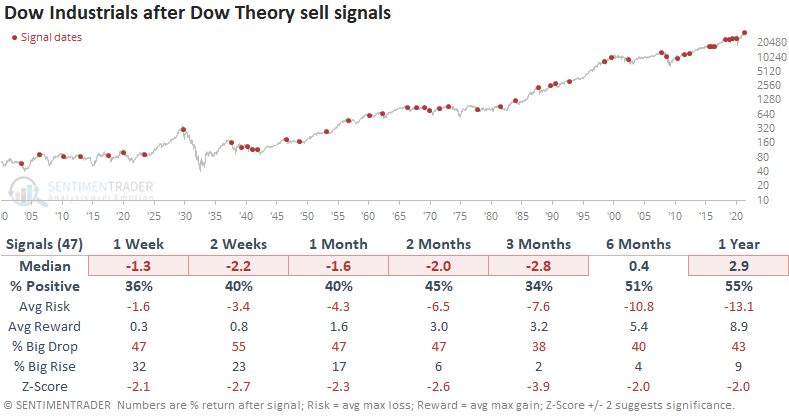
Over the next three months, the Dow managed to rally only 34% of the time. Across all time frames, the risk/reward was skewed toward "risk" and the Dow's median return was at least 2 standard deviations below random.
If there's any solace here for investors, it's that sell signals since the end of the financial crisis have mostly been terrible. They would have prevented some uncomfortable losses in 2011, 2018, and 2020, and a few other modest ones. But all were brief and ended up leading to gains during the next 3-6 months.
We tend to place more weight on recent occurrences, so this is a caveat against becoming too pessimistic based on this one theory.
A DROP IN UPTRENDS
Traders get excited when there is a lopsided day in the markets. On Monday, it was all-aboard to the upside, with few stocks failing to rise.
Before Monday's surge, for only the third time since the pandemic low, fewer than 35% of S&P 500 stocks were holding above their 50-day moving averages.
This ended a streak of more than seven months, the longest streak in over three years and ranking as one of the longest since 1927.
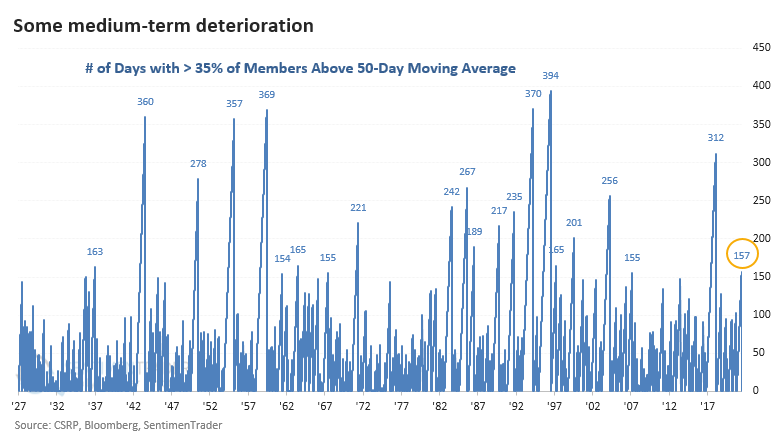
Despite the drop in stocks holding above their 50-day averages, nearly 90% of them were still above their 200-day averages. That's the most stocks we've ever seen above their long-term averages when there was a big drop in medium-term uptrends.
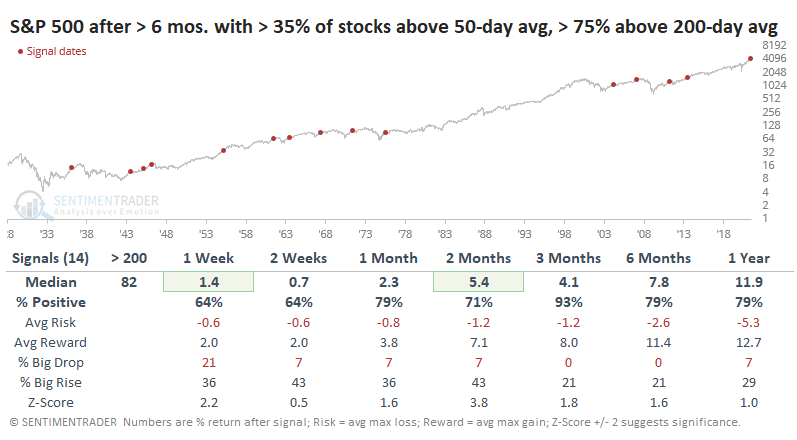
Other times that stocks carved out similar patterns, the S&P rallied in the months ahead. Over the next three months, 13 out of 14 signals showed a positive return, and the sole loss was smaller than -1%.
There are some concerns, though. Even though the S&P rallied to a new record high on Thursday, less than half of its stocks were even trading above their 50-day moving averages. The last time the index hit a record with such low participation was in 1999, and even going back to 1928, there were only 15 total days. All of them preceded trouble.
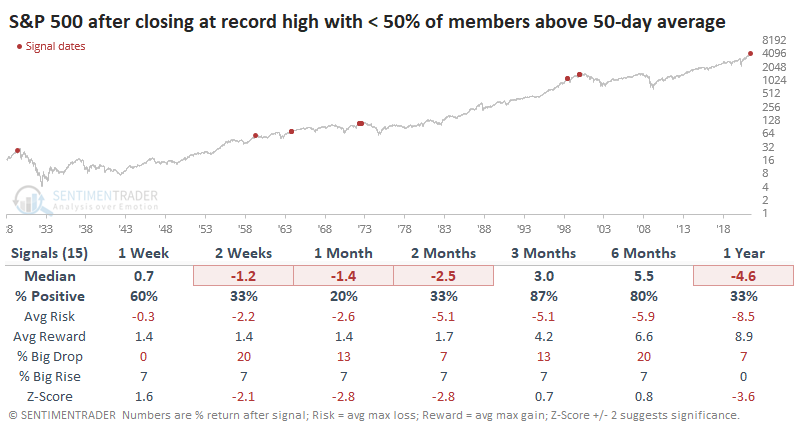
If we continue to see weak short- to medium-term internal readings like this, it will eventually bleed over to the longer-term ones and the positive momentum study noted above will start to lose its effectiveness.
GLUT OF OFFERINGS FROM MONEY-LOSERS
The rising tide of money has lifted the fortunes of many companies that otherwise would have sunk long ago. As the Wall Street Journal notes:
"The frenzied stock-buying activity that may have saved AMC Entertainment Holdings Inc. from bankruptcy is opening up a potential escape hatch for other troubled borrowers as well.
More companies with steep financial challenges are seeking a lifeline from equity markets, eager to capitalize on the surge of interest in stock buying from nonprofessional investors.
But equity markets now are more open to supporting troubled issuers, in large part because of risk-hungry individual investors eager to speculate, according to bankers and investors following the trend."
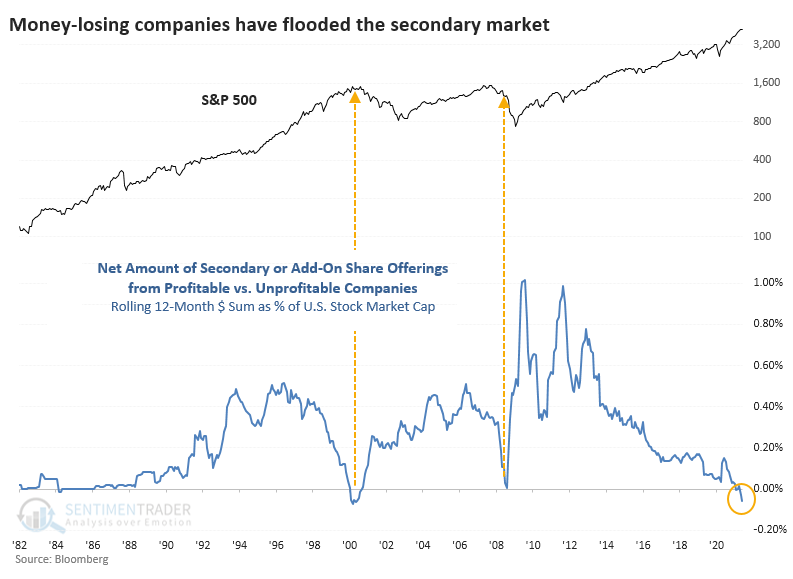
We can see this explicitly in the amount of money raised from secondary and add-on share issuance between money-making and money-losing corporations in the U.S.
According to Bloomberg data, there have been 254 profitable companies issuing secondary or add-on shares over the past 12 months. But there have been 748 unprofitable companies doing the same, for a net differential of more than 500 companies.
All of this issuance amounted to more than $27 billion worth of offerings that have been priced. As a percentage of the U.S. equity market, this is about 0.1%, which is nothing more than a blip. That's not really the point. It's not about the amount of issuance; it's about a market environment that allows this to happen.
We've been in the Enthusiasm phase of a Typical Sentiment Cycle for more than six months now. The phase usually exhibits all of these factors.
- High optimism
- Easy credit (too easy, with loose terms)
- A rush of initial and secondary offerings
- Risky stocks outperforming
- Stretched valuations
Optimism has ebbed from its peak in February, and some risky stocks have been clobbered. However, the other factors are still in play. We need to be on the lookout for internal divergences and warnings among technical indicators during and after these phases. So far, those have been spotty. We'll have to watch if conditions like we saw earlier this week continue.
SEASONAL SWOON SOON
Seasonality tells you what you should generally expect. It does NOT tell you what IS going to happen. That said, it can be instrumental in helping to set one's expectations.
Jay notes that historically the stock market has performed much better during November through April than during May through October. On a year-by-year basis, this can vary a great deal, and in the past decade the May-Oct period has seen a gain about 80% of the time.
All that said, please take note of the S&P 500 Index Seasonality chart below.
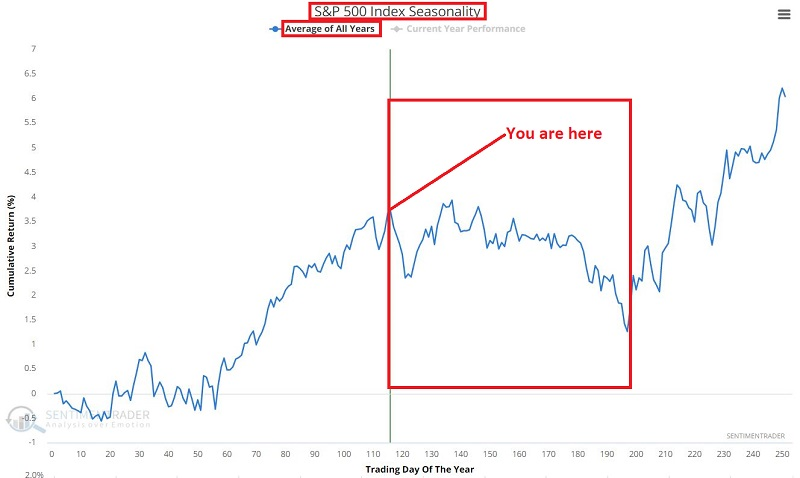
The implications are that we may see a downdraft of some significance in the near-term with not a lot of new upside in the months ahead, and a potentially bigger decline as we head into mid to late October.
Within that window, there are a couple of particularly unfavorable periods, the next one being from the 10th trading day in July through the end of August.
The chart below displays the cumulative % price change for the S&P 500 Index during this period since 1941.
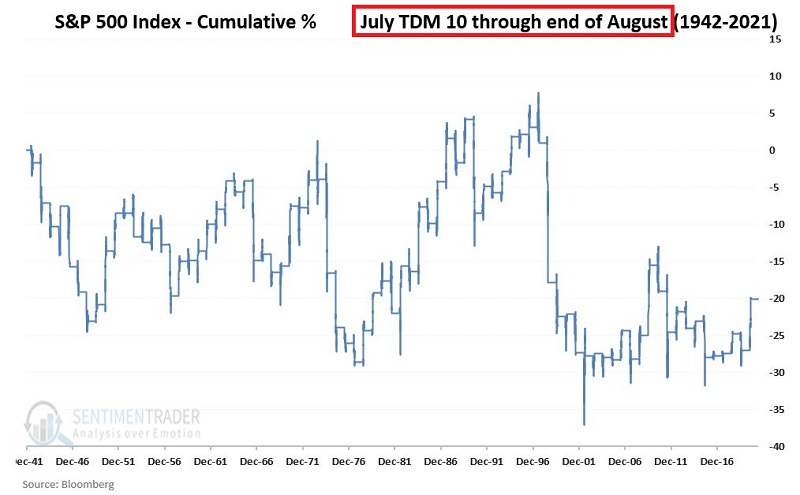
The cumulative price decline was -20%.
STOCKS AND SECTORS - GOLD MINERS
Dean presented an update to his absolute and relative trend following indicators for domestic and international ETFs.
The Dollar Index (DXY) surge and a flattening of the yield curve played a significant role in the week-to-week change in the relative trend scores for several sectors. Interestingly, the energy group did not see a downshift in its relative trend score as it remained firm. Technology once again showed some improvement.
Due in part to those factors, growth-based industries gained at the expense of value and commodity-based groups, including gold mining stocks.
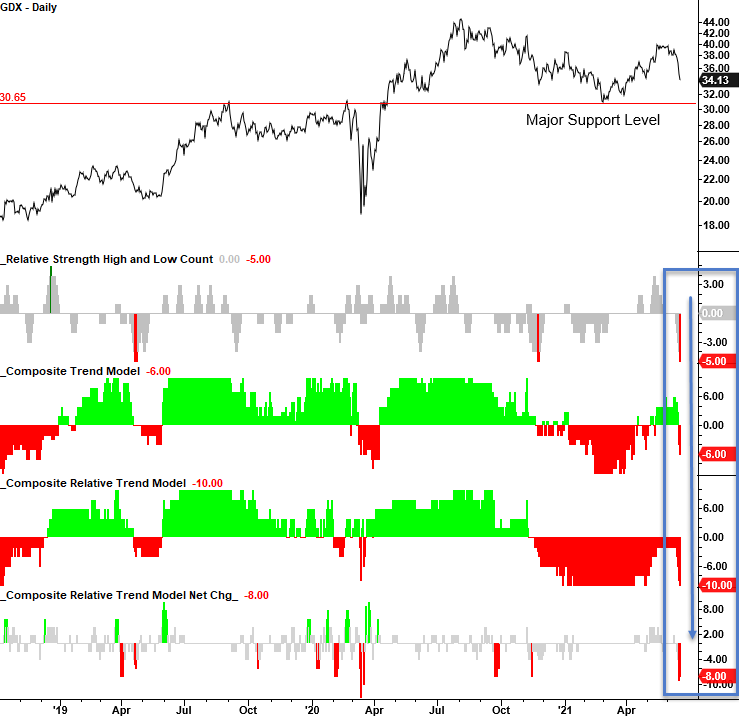
Let's conduct a study to assess forward returns when the Gold Miners composite relative trend model 5-day net change crosses below -8, and the index is above a 3-month low. i.e., the current setup.
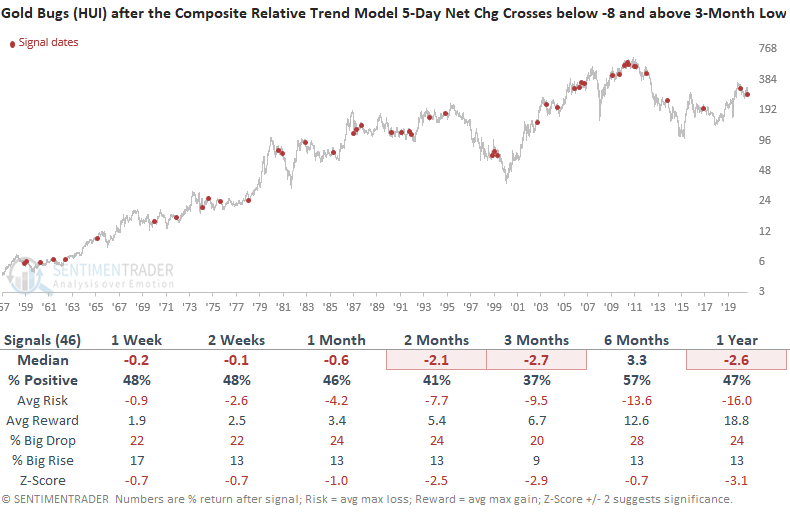
This tended to be quite a negative setup for miners. As a group, when their trend relative to the broader market slips, there has tended to be more weakness on the horizon.
The outlook for gold stocks remains somewhat murky, with at least two significant headwinds to overcome according to Jay.
The chart below displays the Annual Seasonal trend for ticker GDX (VanEck Vectors Gold Miners ETF) since 2006.
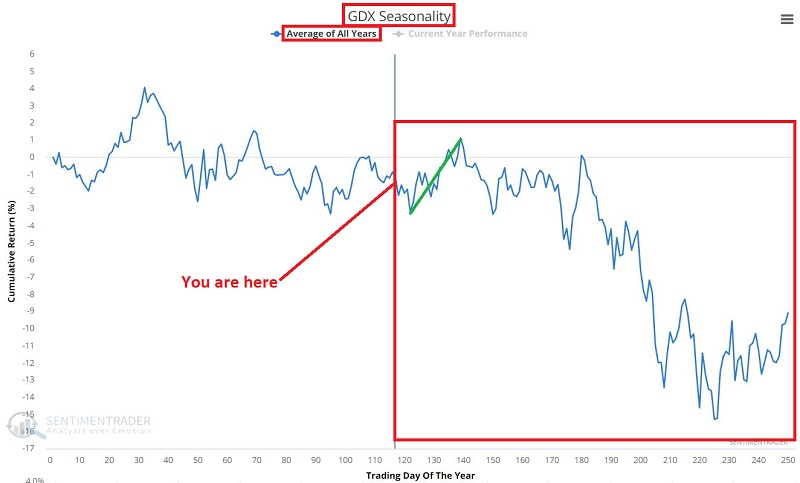
It does not inspire a great deal of bullish confidence for the months ahead.
There is also some trouble with sentiment. A 50-day moving average of our Optimism Index for GDX has rolled over from a high level.
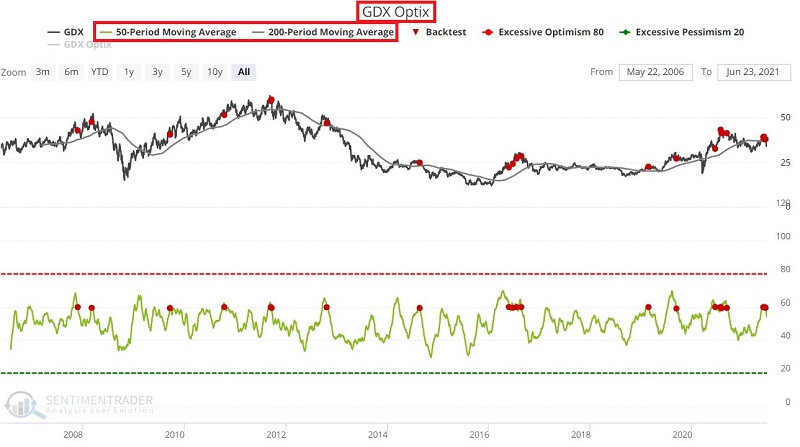
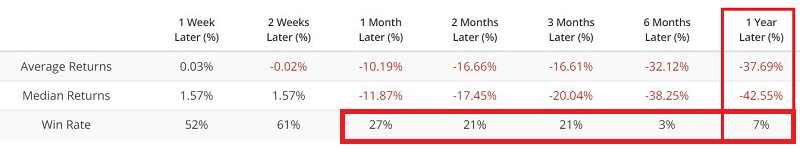
The table below displays the summary of GDX performance when it was above its 200-day moving average and a 50-day moving average of its Optimism Index crossed below 60.
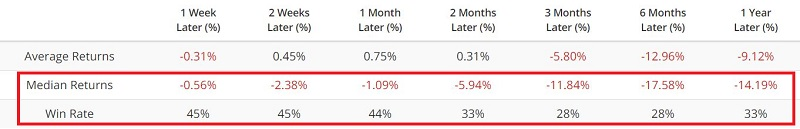
A decline in GDX following this signal is by no means a "sure thing." But the important thing to recognize is that it does tend to act as a strong headwind.
STOCKS AND SECTORS - ENERGY
Since achieving the status of "one of the most hated sectors of all-time," the energy sector has enjoyed an 80+% advance in just over 8 months. If history is a guide, energy may well outperform the broader market over the next several years.
That's the good news. The bad news is that the energy sector is entering a time of year that has seen it struggle mightily over the last 4 decades.
The chart below displays the annual seasonal trend for ticker XLE (Energy Select Sector SPDR Fund).
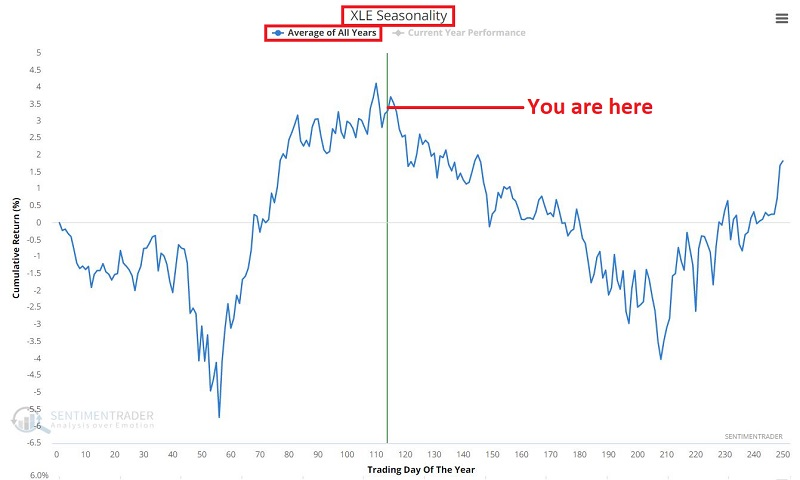
The message from this chart is NOT that energy stocks cannot continue to rally or that they are doomed to fall in the months ahead. The message is that they will have to overcome some serious seasonal headwinds for them to continue trending higher.
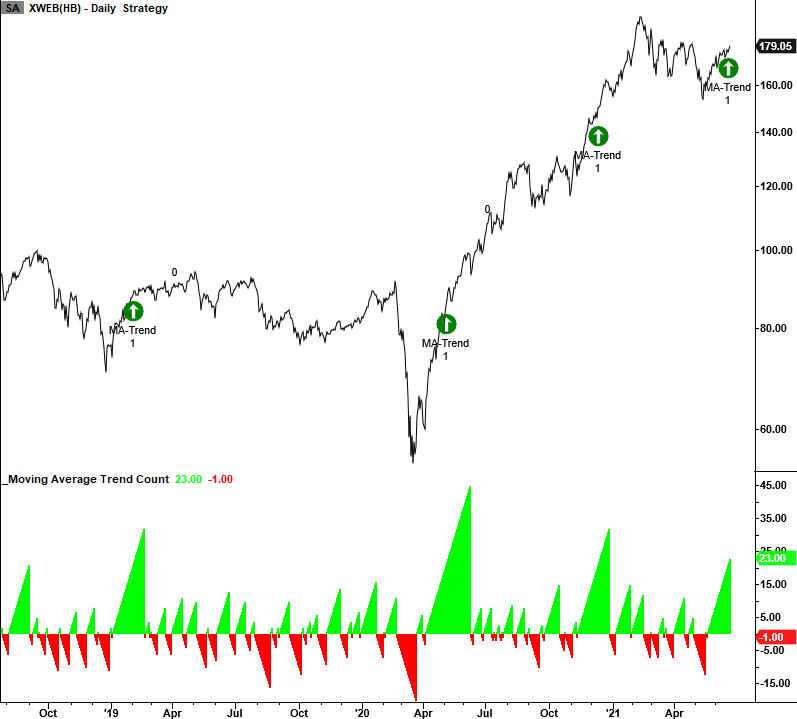
STOCKS AND SECTORS - INTERNET
Dean's a big fan of streaks above/below moving averages, and created a signal based on the concept.
Many successive days below a moving average that is subsequently followed by many days above the average has coincided around many turning points. In simple terms, you have an oversold condition followed by a market thrust whereby the security remains above the moving average for an extended period. A simple 10-day moving average worked best during testing.
The concept can be applied to any security. The following growth-oriented ETF fired a signal late last week.
| COMMODITIES | ||
 |  | |
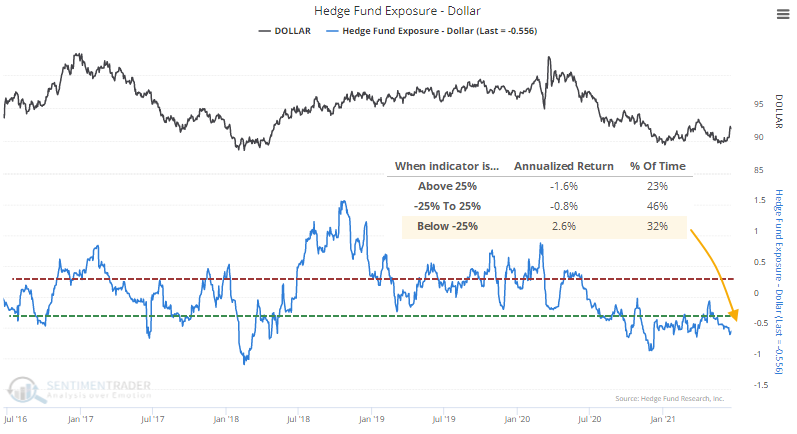
Following the Federal Open Market Committee's explanation of their thinking on the economy and interest rates, the U.S. dollar exploded to the upside.
Speculators have been short the dollar, suggesting that the pain trade is to the upside. A "pain trade" is a move that will seemingly hurt the most participants, usually when they've positioned too far in one direction or the other. This doesn't always work very well in the dollar or other trending currencies, but it seemed to have an impact over the past week.
Estimated Hedge Fund Exposure to the dollar is extremely negative. When it has been below 25%, the dollar's annualized return was +2.6%, which is where the pain trade concept comes in.
Let's assume that this pain trade is going to result in a similar result as others over the past 15 years.
On average, the dollar rallied for 154 trading days, with a median gain of just over 10%. The table below shows how other assets and indexes performed during those stretches.
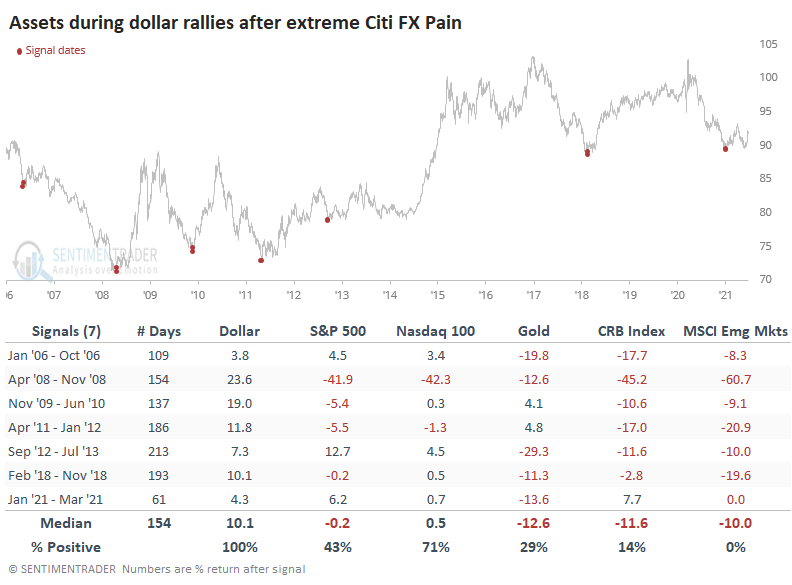
It was a mixed bag for stocks, with the big exception being the depths of the financial crisis. Big tech stocks in the Nasdaq 100 fared better overall. Not surprisingly, the assets with the most consistent negative correlation to the dollar did terribly. Gold, commodities, and especially emerging markets all suffered losses. If the dollar reacts as it has during the past 15 years, then it will be a major headwind to those three markets.
CRUDE MOMENTUM
The price trend backdrop for Crude Oil looks excellent. Dean's composite trend model is currently maintaining a perfect score and hasn't been below a level of five since November 2020.
Crude Oil has now traded above its 10-day moving average for 21 consecutive days. Let's conduct a study to assess the forward return outlook for the commodity when this pattern has occurred in the past.
The trend persistency count has now reached a level of 21 for the third time since April 2020. The 2003-08 crude oil bull market is the only other time we've seen this type of consistency.
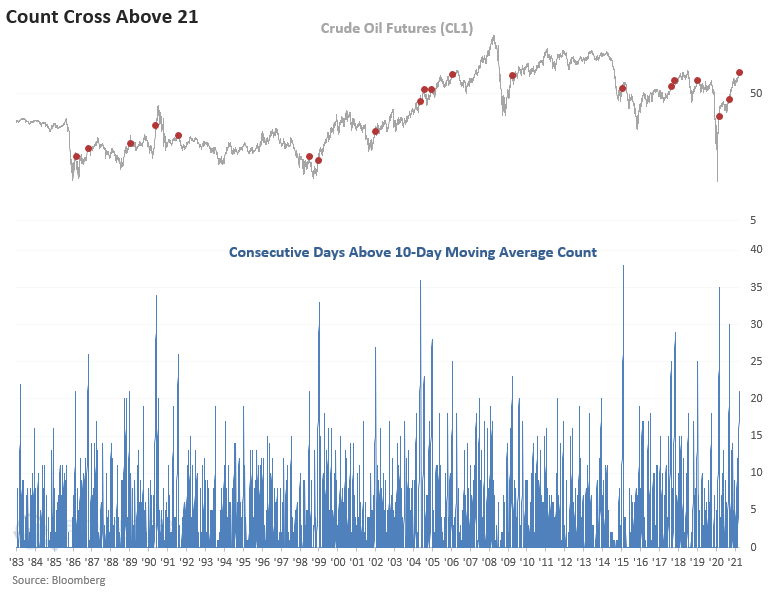
While the last two signals exhibited strong returns, history would suggest that crude oil could take a break in the short to intermediate-term.
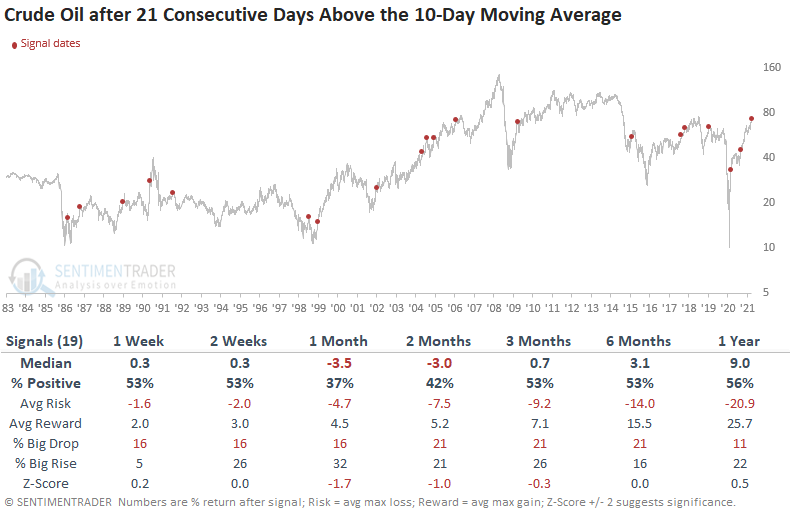
Over the next 2-3 months, crude had a consistent tendency to fall back, with poor average returns and more risk than reward. Nothing goes straight up forever.
GUT CHECK TIME FOR NATURAL GAS
The good news is that natural gas has been in a strong uptrend in the last 2 months. It's an obvious statement, but the most bullish thing it can do is to keep rallying. If price can break out decisively to the upside, traders can certainly give NG the bullish case the benefit of the doubt. Unfortunately, Jay notes that there are other reasons to be concerned.
The chart below displays the hypothetical $ gain/loss achieved by holding a long position in natural gas futures only during a seasonally unfavorable period since 1990. The message is not that natural gas cannot rally during this period. The message is that it rarely does and that a bullish position in natural gas during this period clearly has to "swim upstream."
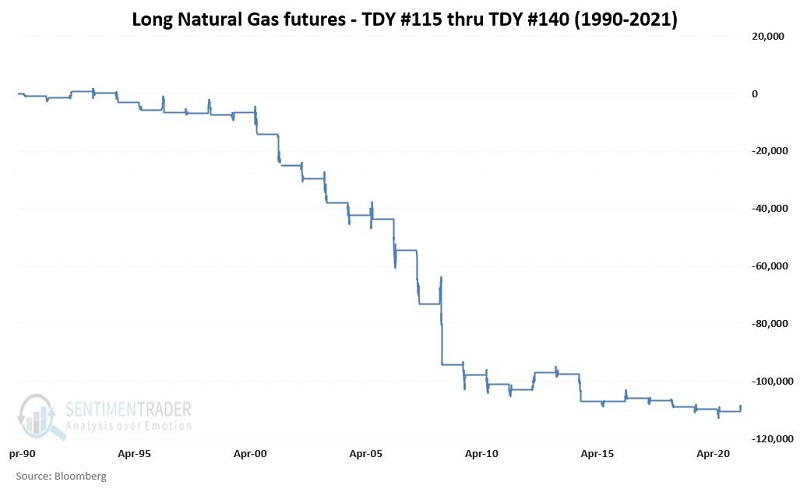
Since 1990 this period has shown a decline 84% of the time, suggesting a seasonal headwind for the next month.
Another issue is that the market is still working off extreme optimism. The chart below displays the instances when our natural gas Optimism Index exceeded 70% in the last 20 years.
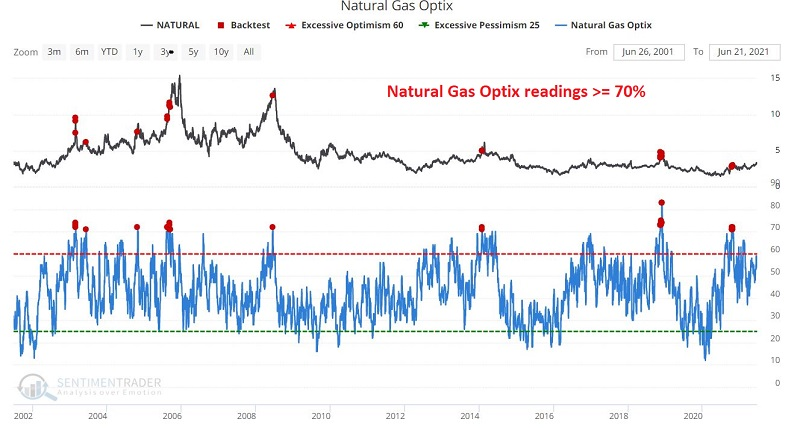
The last signal occurred 8 months ago, but when looking at returns following other signals, weakness in natural gas was evident even up to a year later.
Is natural gas doomed to fall in the months ahead? Not at all. As stated at the outset, if price can breakout above recent resistance, there is no reason that 2021 cannot be an "atypical" year for natural gas. Trading is a game of odds; therefore, one of the keys to long-term success is to put the odds as far in your favor as possible on a trade-by-trade basis.