Headlines
|
|
Most financials lose their medium-term uptrends:
For the first time since May, fewer than 15% of financials managed to hold above their 50-day moving averages. This comes during a poor market environment for the sector, with fewer than 50% of them above their 200-day averages. This has led to much worse returns than when more than 50% were above their long-term trends.
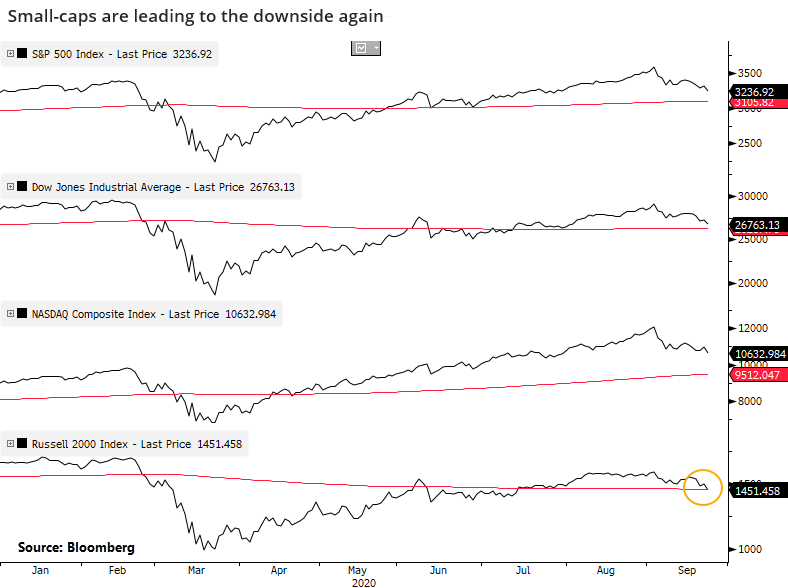
Russell 2000 is the first to lose its long-term trend:
The Russell 2000 became the first of the 'big four' indexes to close below its 200-day average after all 4 had been rallying. It also ended a medium-term rally within a much larger downtrend for the index. Similar behavior in the past led to short-term declines, but not much beyond that.
More outflows: According to Lipper, investors pulled nearly $15 billion from equity funds over the past week, the most since mid-June. According to the Backtest Engine, there have been 28 weeks with an outflow greater than $14.5 billion. Three months after those signals, the S&P 500 was higher 22 times, averaging 5.3%. The biggest failure was earlier this year, when a big outflow in February wasn't enough to prevent a further meltdown into March.
Bottom Line:
|
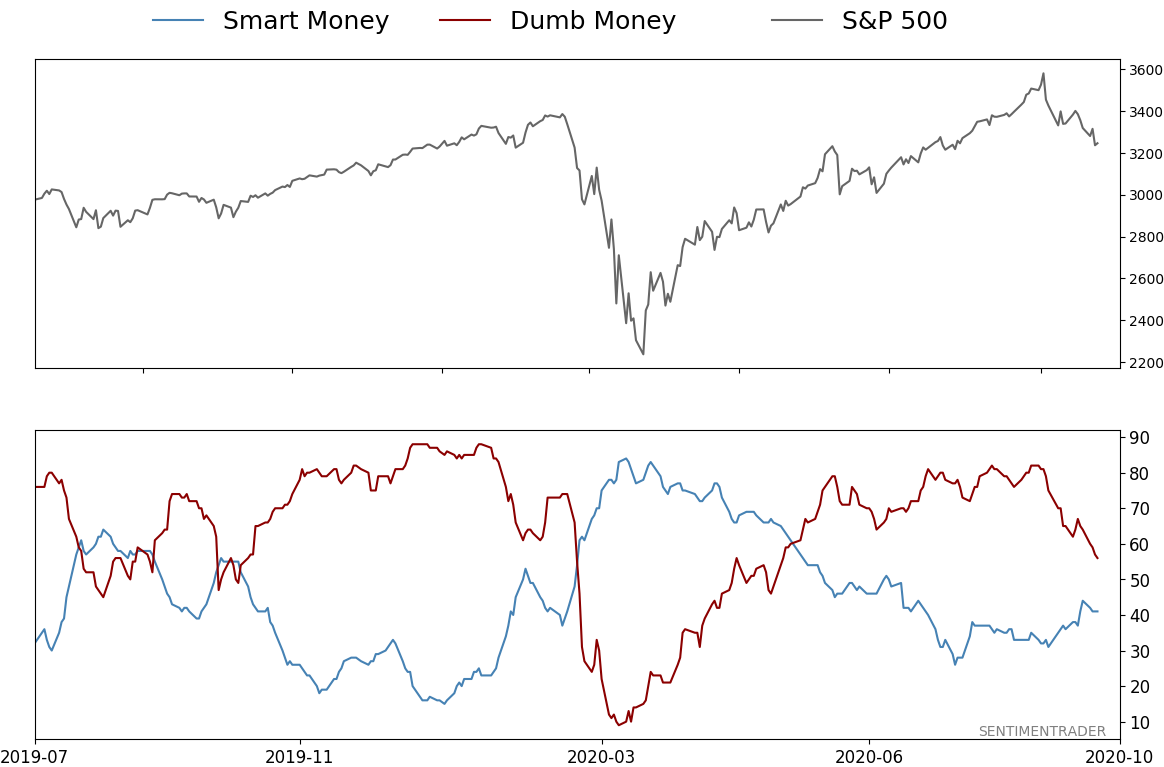
Smart / Dumb Money Confidence
|
Smart Money Confidence: 41%
Dumb Money Confidence: 56%
|
|
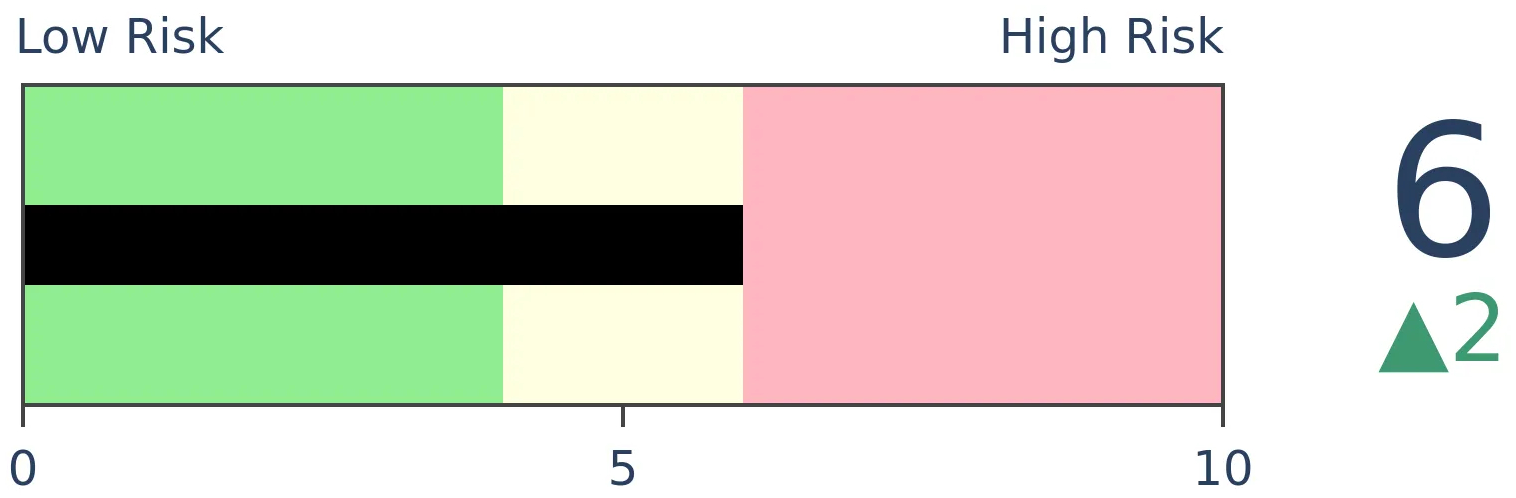
Risk Levels
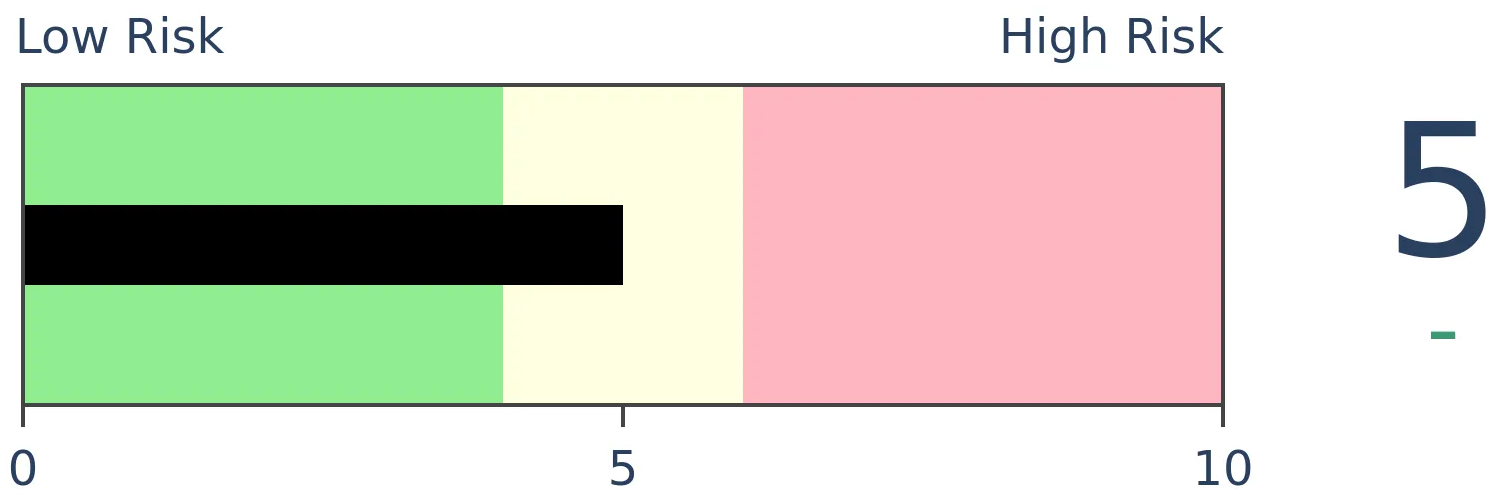
Stocks Short-Term
|
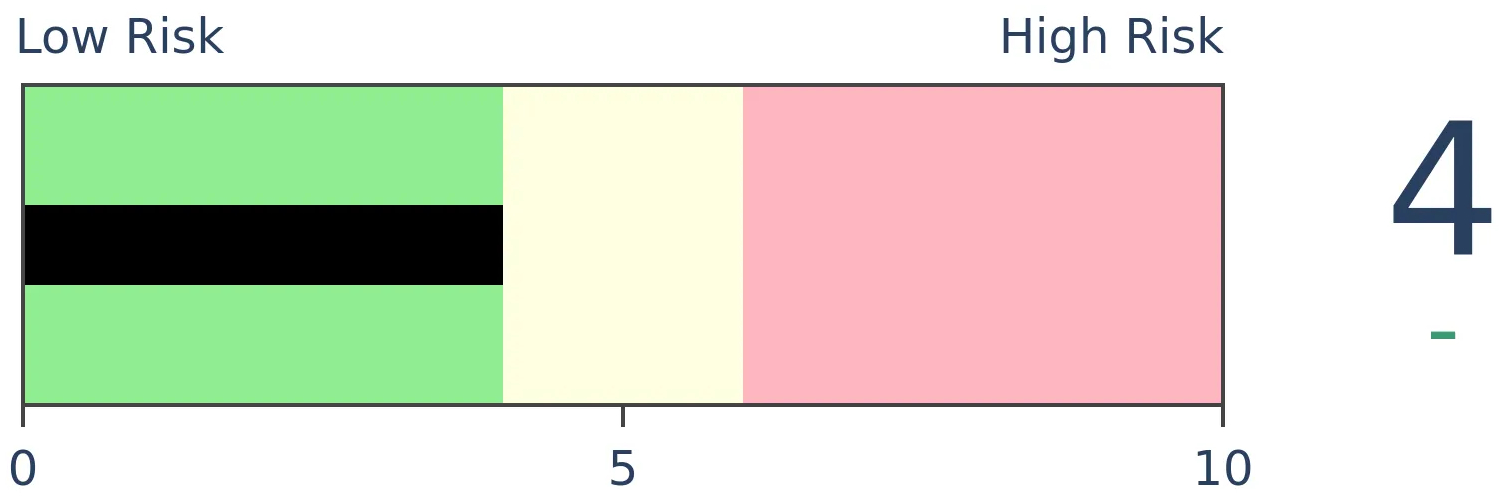
Stocks Medium-Term
|
|
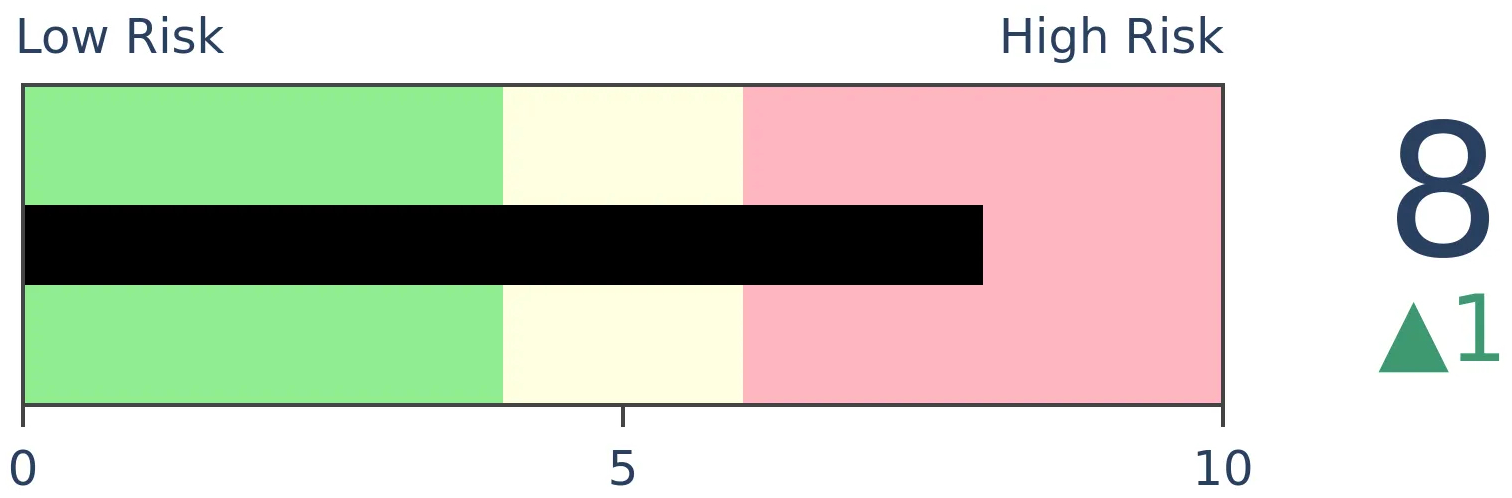
Bonds
|
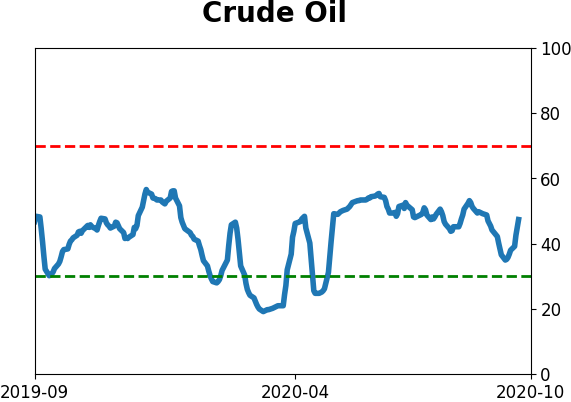
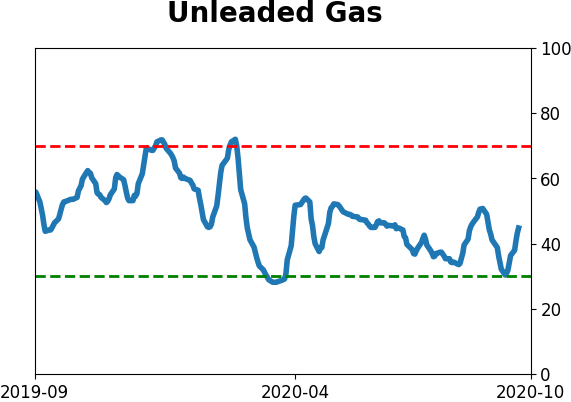
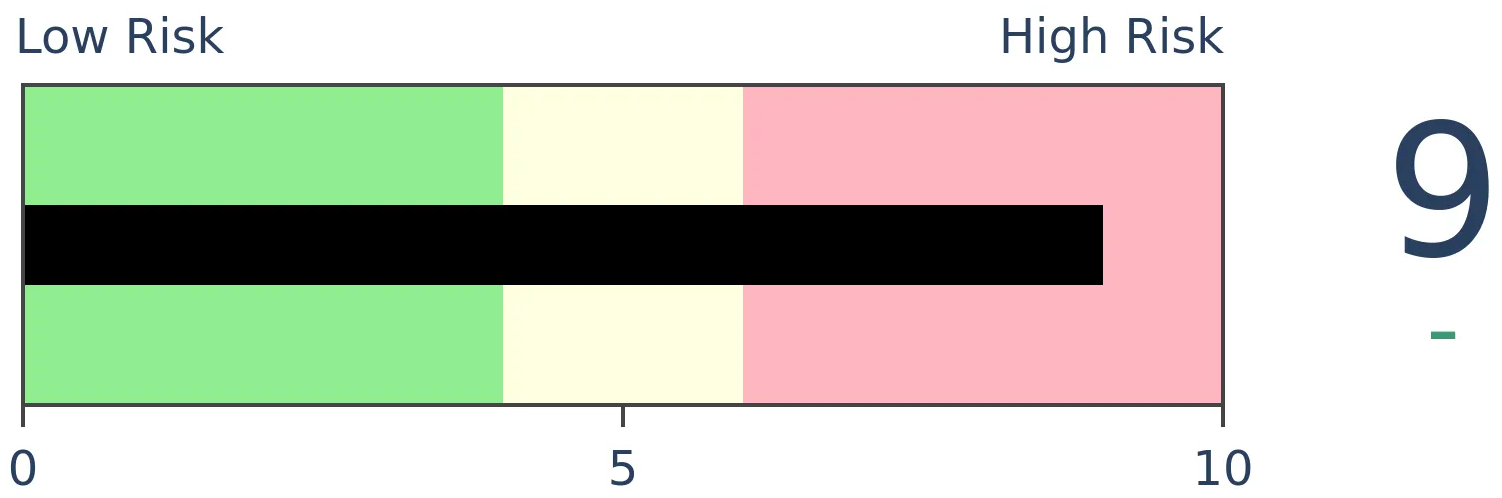
Crude Oil
|
|
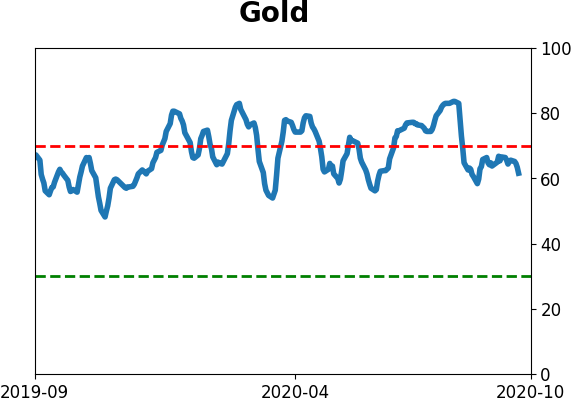
Gold

|
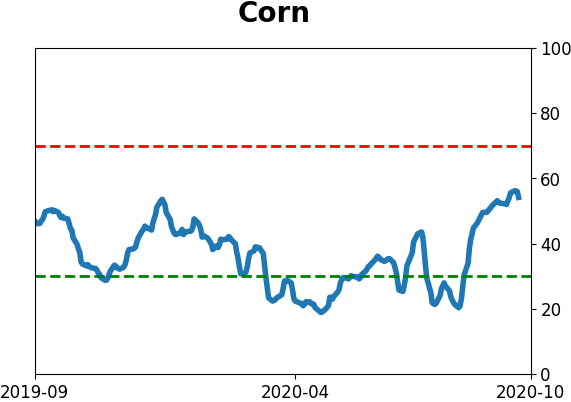
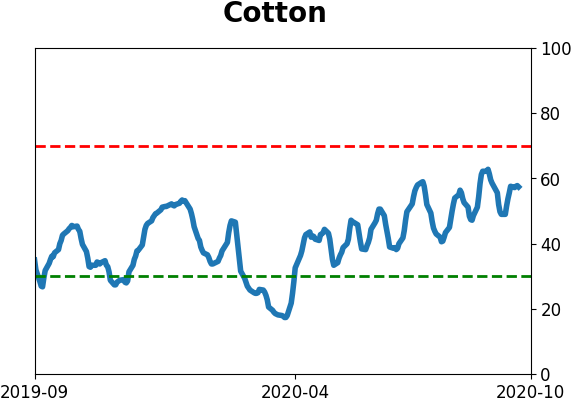
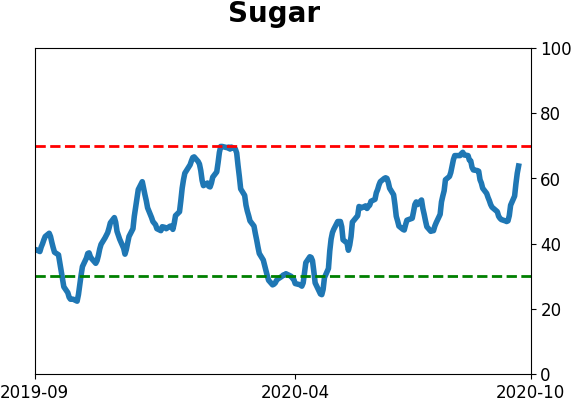
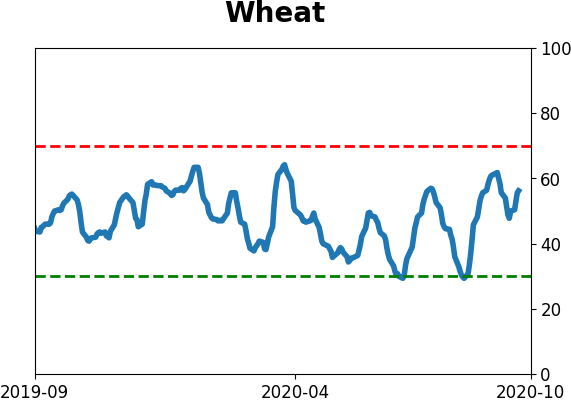
Agriculture
|
|
Research
BOTTOM LINE
For the first time since May, fewer than 15% of financials managed to hold above their 50-day moving averages. This comes during a poor market environment for the sector, with fewer than 50% of them above their 200-day averages. This has led to much worse returns than when more than 50% were above their long-term trends.
FORECAST / TIMEFRAME
None
|
Financial stocks have been among the laggards and still haven't been able to get out of their own way.
When they fell on Tuesday, they really fell, and it dragged most of them below their medium-term averages. For the first time since May, fewer than 15% of financials were able to hold above their 50-day averages. That comes during an environment where fewer than 40% of them even made it above their 200-day averages.
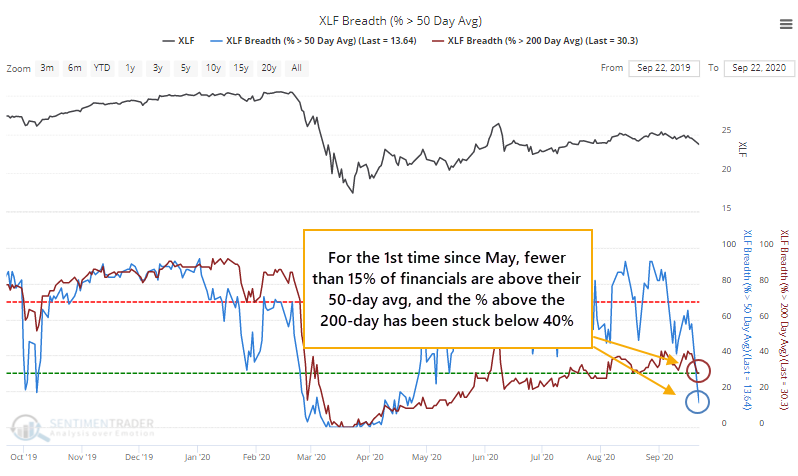
This ended a streak of more than 100 days with more than 15% of financials above their 50-day averages. In the broader market, when a long streak of positive momentum (or at least "not negative" momentum) ends, it often precedes positive returns, as those who missed the rally see their first real opportunity to get in.
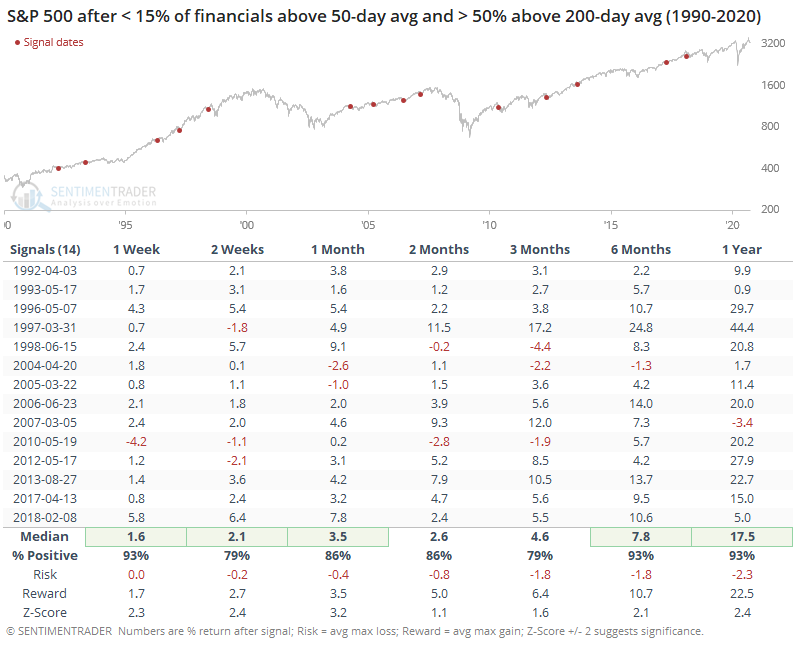
With financials, these opportunities seemed heavily dependent on the larger market environment. Below, we can see future returns in the S&P 500 Financial sector when fewer than 15% of stocks held above their 50-day averages for the first time in at least 100 days, while fewer than 50% of them were also above their 200-day averages.
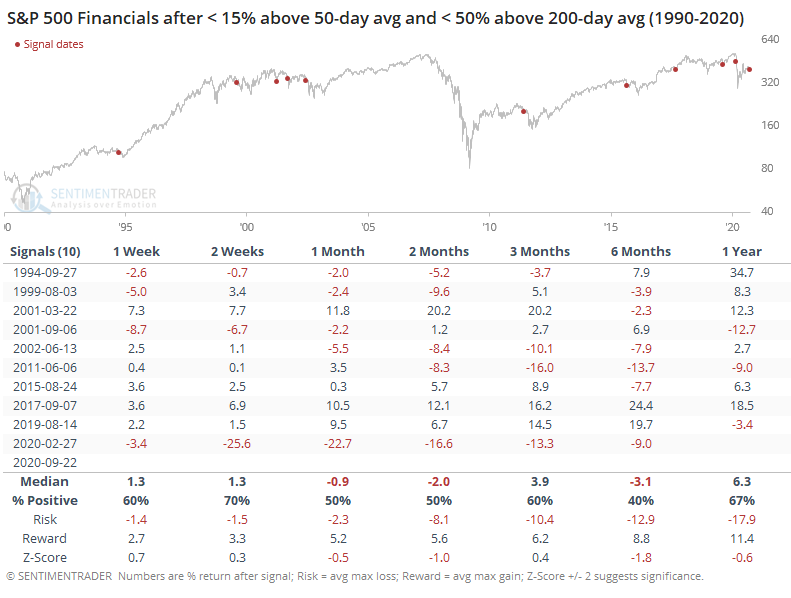
Forward returns weren't great, especially over the medium-term of 1-6 months. Average returns were poor, and the risk/reward was horrid. There were a few temporary successes in there - financials quickly turned and soared for a while in 2017 and 2019 - but most fizzled out.
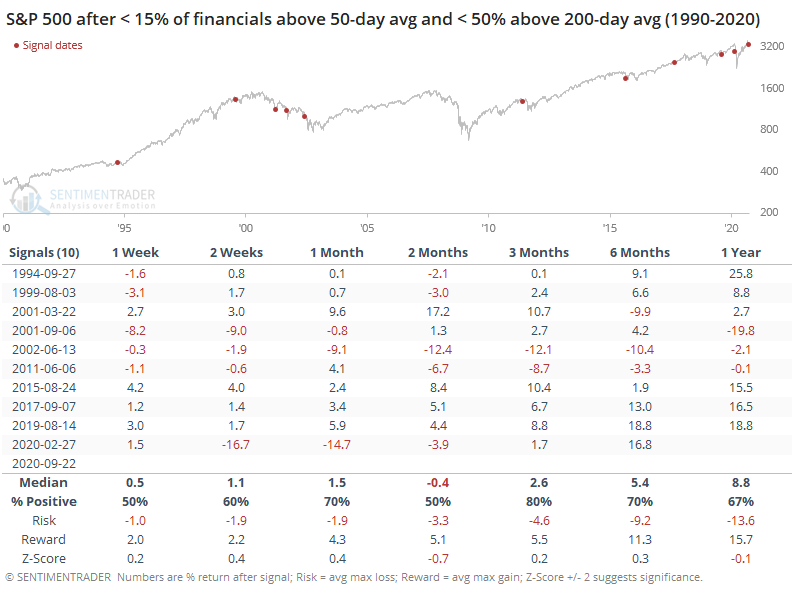
While not as bad, returns for the broader S&P 500 index were also tepid over the next 2 months, though already by 3 months later, there were only 2 (large) losses.
Contrast that to times when these streaks ended, but more than 50% of financials were above their 200-day averages.
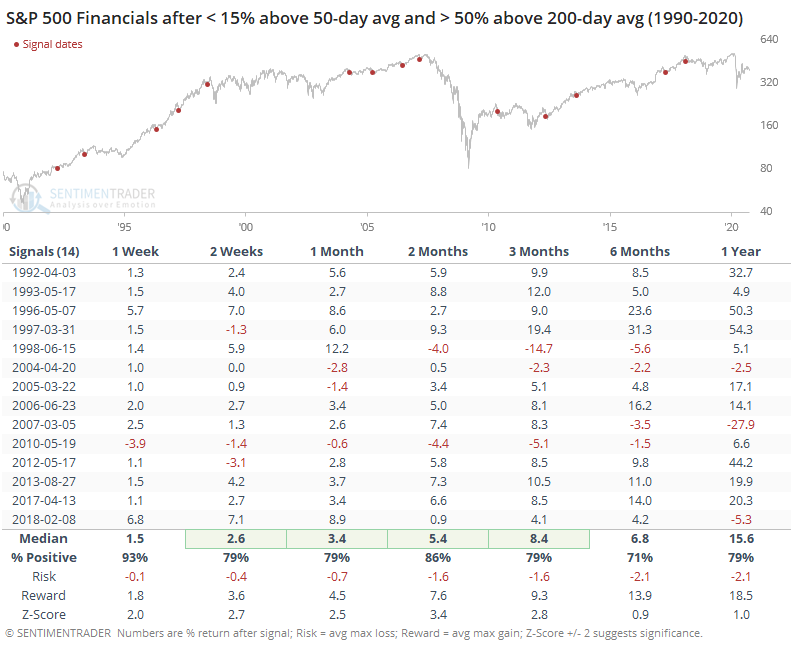
This was quite a change. These tended to be excellent buying opportunities, with only a few failures over the medium- to long-term.
For the broader S&P, these were excellent signals, with only one small loss over the next 6 months.
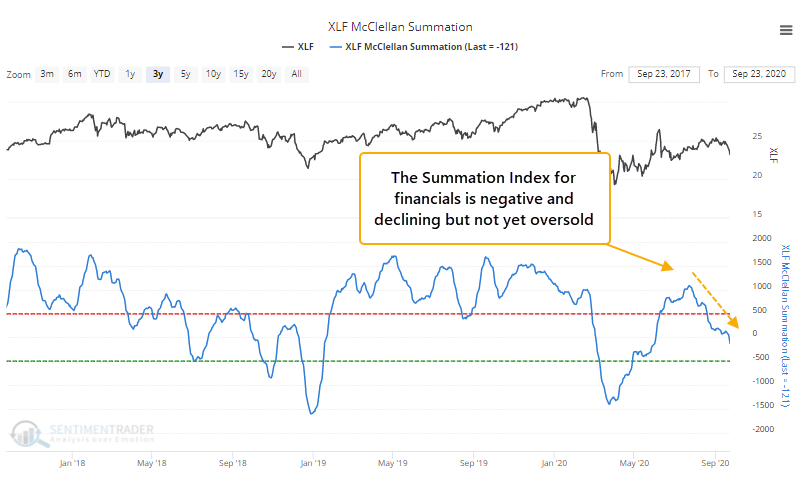
We can also monitor the longer-term environment for financials by watching the McClellan Summation Index for the sector. Currently, that's showing the worst possible combination - below zero, declining, and not yet oversold.
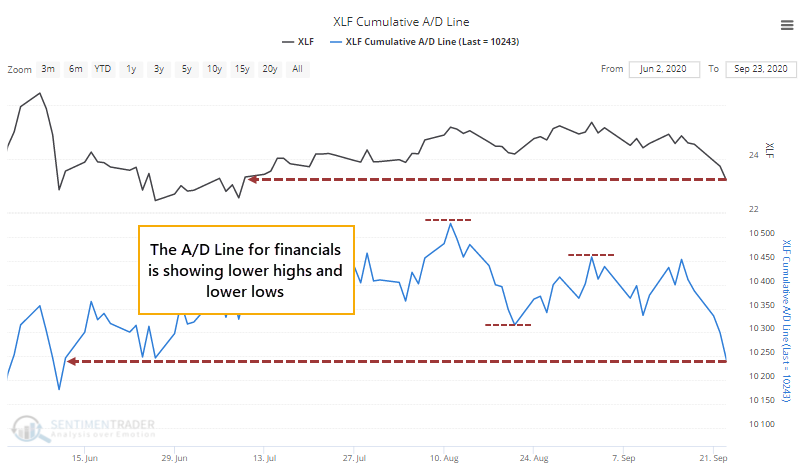
While a more minor consideration, the Cumulative Advance/Decline Line for financials is leading the index itself lower and showing a clear pattern of lower highs and lower lows.
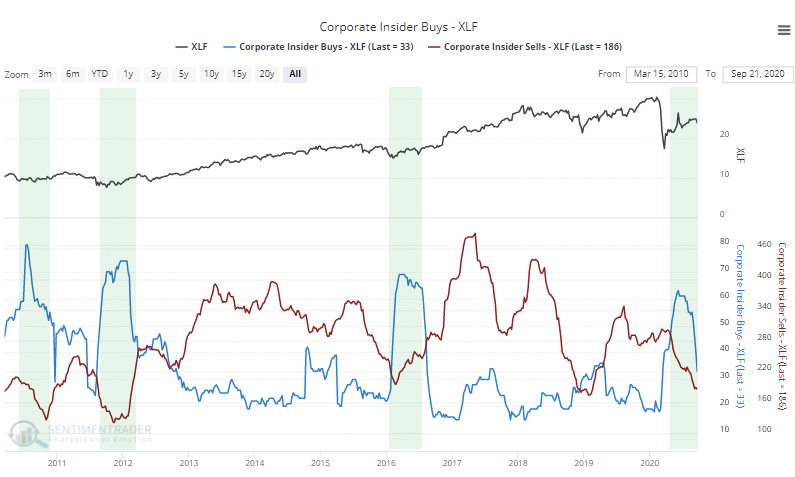
The biggest positive for the group is the spike in buying among corporate insiders during much of the spring. That has tapered off, but so has selling. This tends to be longer-term, and the poor market environment is a more immediate concern.
Market environment matters when judging overbought/oversold and optimism/pessimism, and right now that environment is very poor in financials. When there is a poor market environment, the concept of "oversold" takes on a new meaning, and it requires truly extreme bouts of heavy selling and pessimism to create low risk / high reward setups for buyers. We don't have that yet in this sector, at least based on historical reactions to similar behavior.
BOTTOM LINE
The Russell 2000 became the first of the 'big four' indexes to close below its 200-day average after all 4 had been rallying. It also ended a medium-term rally within a much larger downtrend for the index. Similar behavior in the past led to short-term declines, but not much beyond that.
FORECAST / TIMEFRAME
None
|
When markets started to crack in February, it was smaller-cap stocks leading to the downside.
That has to bring up some bad memories because it's happening again. The Russell 2000 is the first of the "big four" indexes to fall below its 200-day moving average.
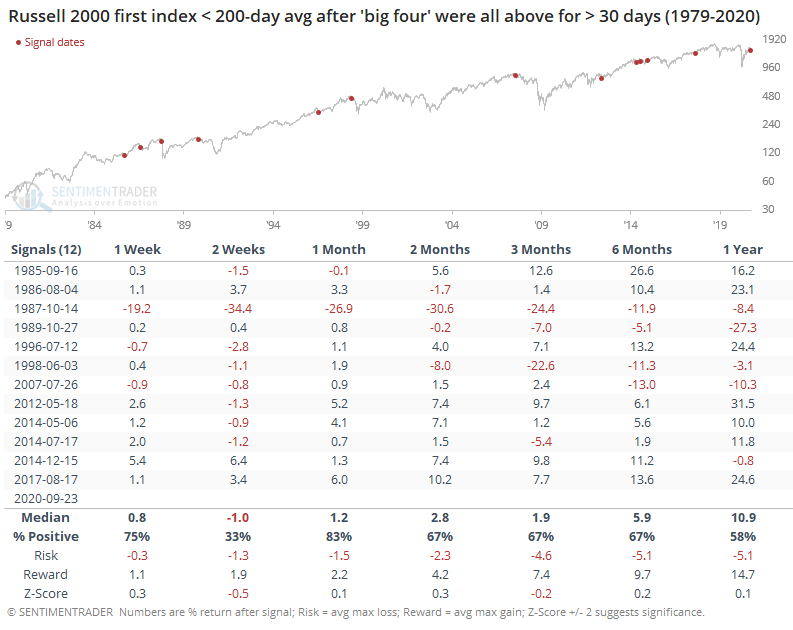
When it led to the downside, its shorter-term returns were poor. The table below shows the Russell 2000's returns when all four indexes had been above their respective 200-day moving averages for at least 30 days, and then the Russell was the first index to fall below.
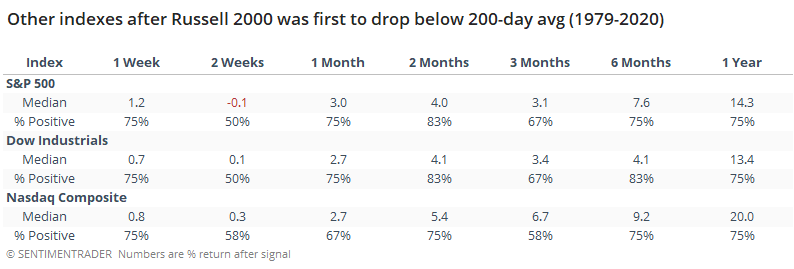
The other indexes held up better.
Focusing on the Russell alone, it's been more than 500 days since that index peaked in 2018. So the July-September period when it was hovering above its 200-day average was counter to the long-term trend it's been in.
Below, we can see the index's returns when it had been at least 200 days since a multi-year peak, and then it fell below its 200-day average after having been above it for between 10 - 100 days. In other words, the end to a short- to medium-term rally within a longer-term downtrend.
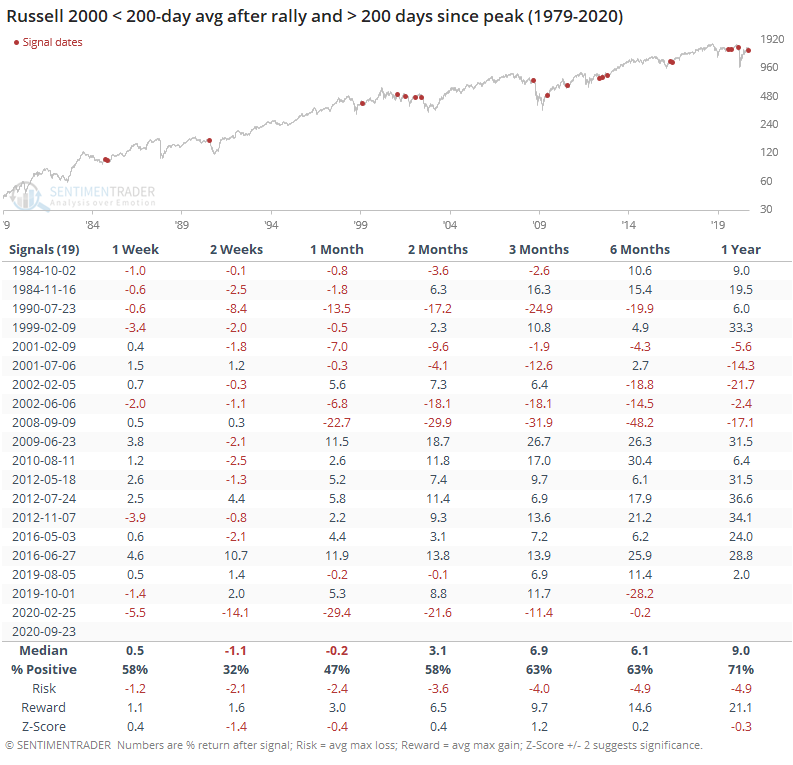
Again, fairly weak for the Russell in the shorter-term. Much of the risk over the next few months was focused on the first few weeks. Based on these two looks at troubles among smaller company shares, it's a concern in the shorter-term, but not much beyond that.
Active Studies
| Time Frame | Bullish | Bearish | | Short-Term | 0 | 1 | | Medium-Term | 1 | 12 | | Long-Term | 47 | 2 |
|
Indicators at Extremes
Portfolio
| Position | Description | Weight % | Added / Reduced | Date | | Stocks | RSP | 15.2 | Reduced 4.2% | 2020-09-03 | | Bonds | 10% TLT, 10% BND, 10% SCHP | 30.0 | Added 30% | 2020-09-09 | | Commodities | GCC | 2.4 | Reduced 2.1%
| 2020-09-04 | | Precious Metals | GDX | 5.0 | Added 5% | 2020-09-09 | | Special Situations | XLE | 4.9 | Added 5.1% | 2020-09-03 | | Cash | | 42.5 | | |
|
Updates (Changes made today are underlined)
After stocks bottomed on March 23rd, they enjoyed a historic buying thrust and retraced a larger amount of the decline than "just a bear market rally" tends to. Through June, there were signs of breadth thrusts, recoveries, and trend changes that have an almost unblemished record at preceding higher prices over a 6-12 month time frame. On a shorter-term basis, our indicators have been showing high optimism, with Dumb Money Confidence recently above 80%, along with signs of reckless speculation during what appears to be an unhealthy market environment, historically a bad combination. While there are certainly some outlier indicators that are showing apathy or even outright pessimism, a weight-of-the-evidence approach suggests high risk over a multi-week to multi-month time frame. That has been the case since July, even arguably June and yet the major indexes hit continual new highs through late August. With the indicators and studies failing to precede any weakness, I've been hesitant to lower my already-low exposure. I am getting increasingly anxious about the oddities we're seeing, though, and lowered it again. This account is mostly about comfort with risk for me, and right now I'm not at all comfortable with any of it. In more than 25 years of experience, this is the oddest market I've ever seen. I lowered exposure again - likely the lowest I'm willing to go at this point given longer-term positives - and decided to switch to an equal-weight version of the S&P 500 index. I've become intensely uncomfortable with the concentration in the cap-weighted index. Our studies have been mixed with regard to the potential for the equal-weight version to outperform the cap version going forward, so historical support isn't overwhelming. I'm also increasingly interested again in energy stocks, starting with a small allocation. I got burned in March with the unprecedented geopolitical spat that hammered those stocks then but the longer-term setup is decent. In this account, I’ve roughly followed what has become known as the All Weather portfolio popularized by Ray Dalio. It allocates across four broad assets, designed to hold up no matter the market environment. The goal is modest positive returns while limiting large, sustained losses. I typically use popular ETFs, with low costs. At times, I will swap out for a fund I believe has better prospects, or simply lower fees if not. At other times, I will diverge quite a bit from baseline allocations, largely depending on the indicators and studies we discuss on the site. I've gotten away from this in the past, using "cash" as a substitute for "bonds" and with rates stuck at 0%, that has become less appetizing. I'm trying to get back more toward the baselines with less dramatic swings in either direction. The base allocation I use is the following: Stocks: 35%
Bonds: 45%
Precious Metals: 7.5%
Commodities: 7.5%
Cash / Special Opportunities: 5%
RETURN YTD: -2.1% 2019: 12.6%, 2018: 0.6%, 2017: 3.8%, 2016: 17.1%, 2015: 9.2%, 2014: 14.5%, 2013: 2.2%, 2012: 10.8%, 2011: 16.5%, 2010: 15.3%, 2009: 23.9%, 2008: 16.2%, 2007: 7.8%
|
|
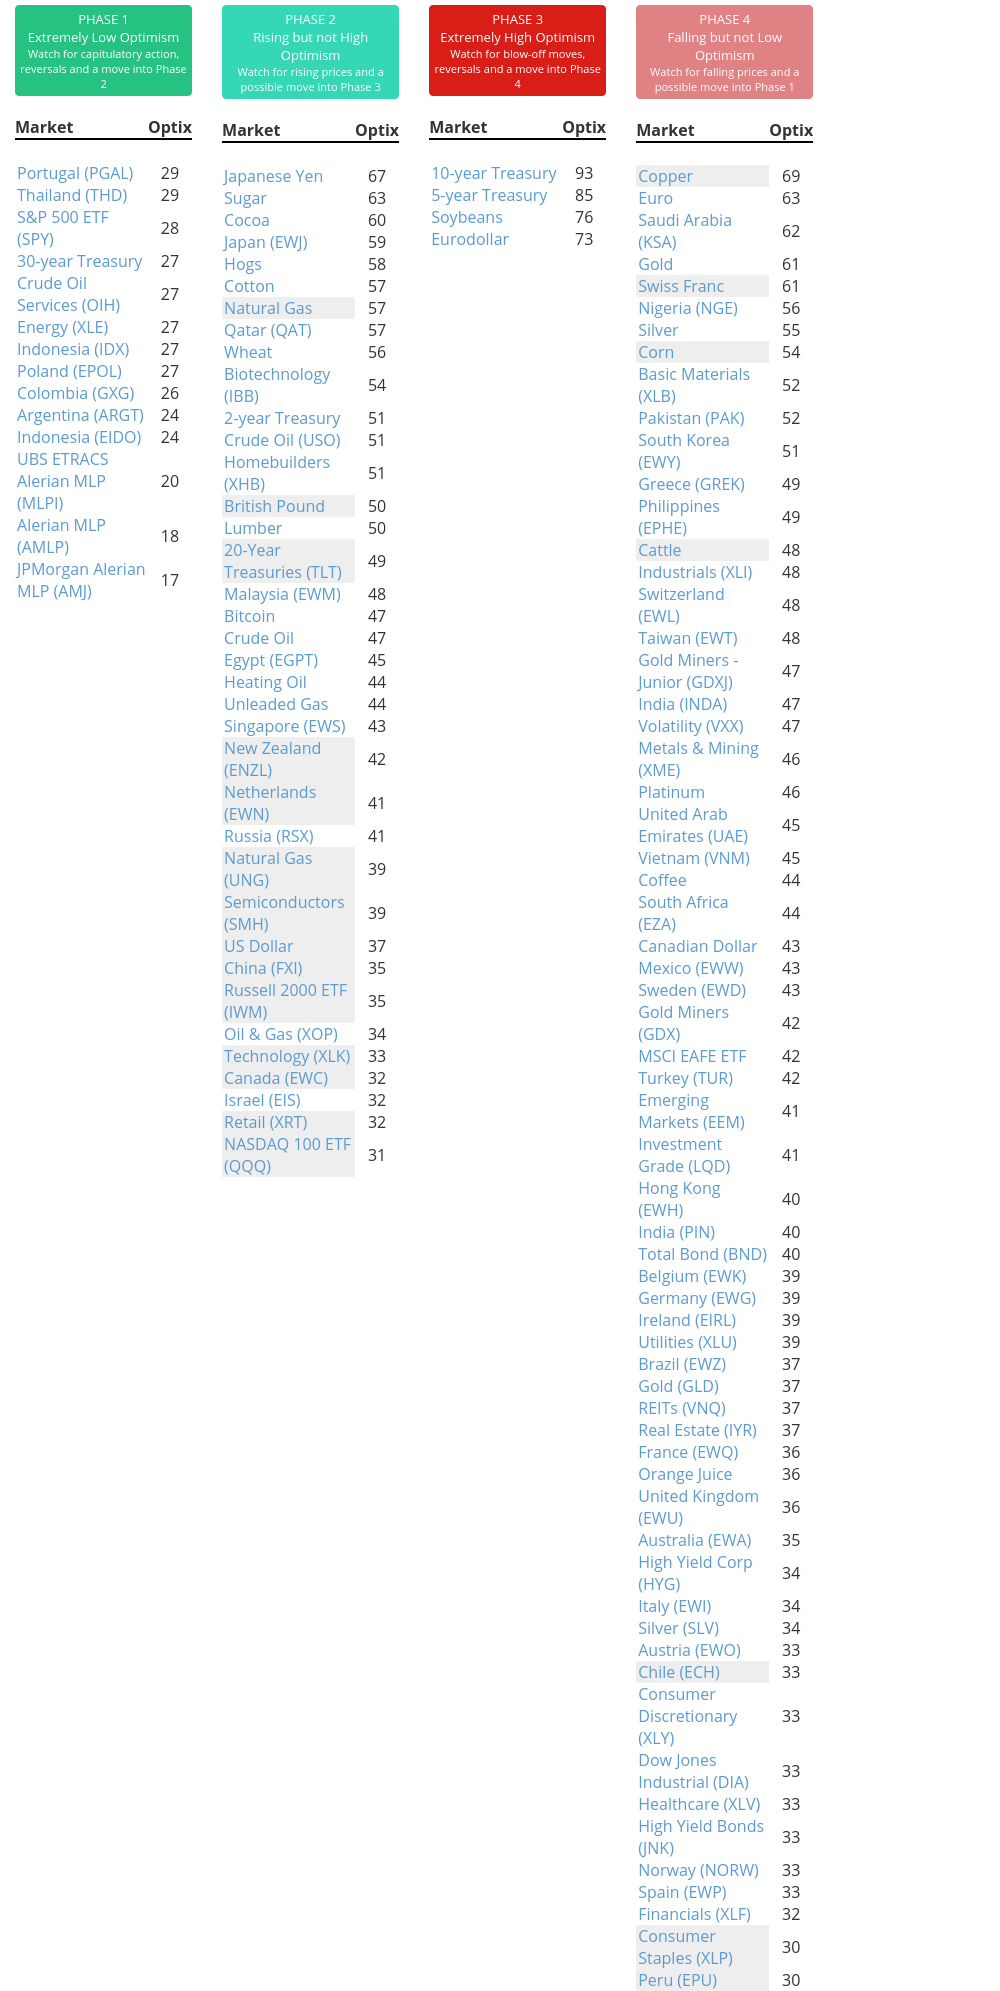
Phase Table
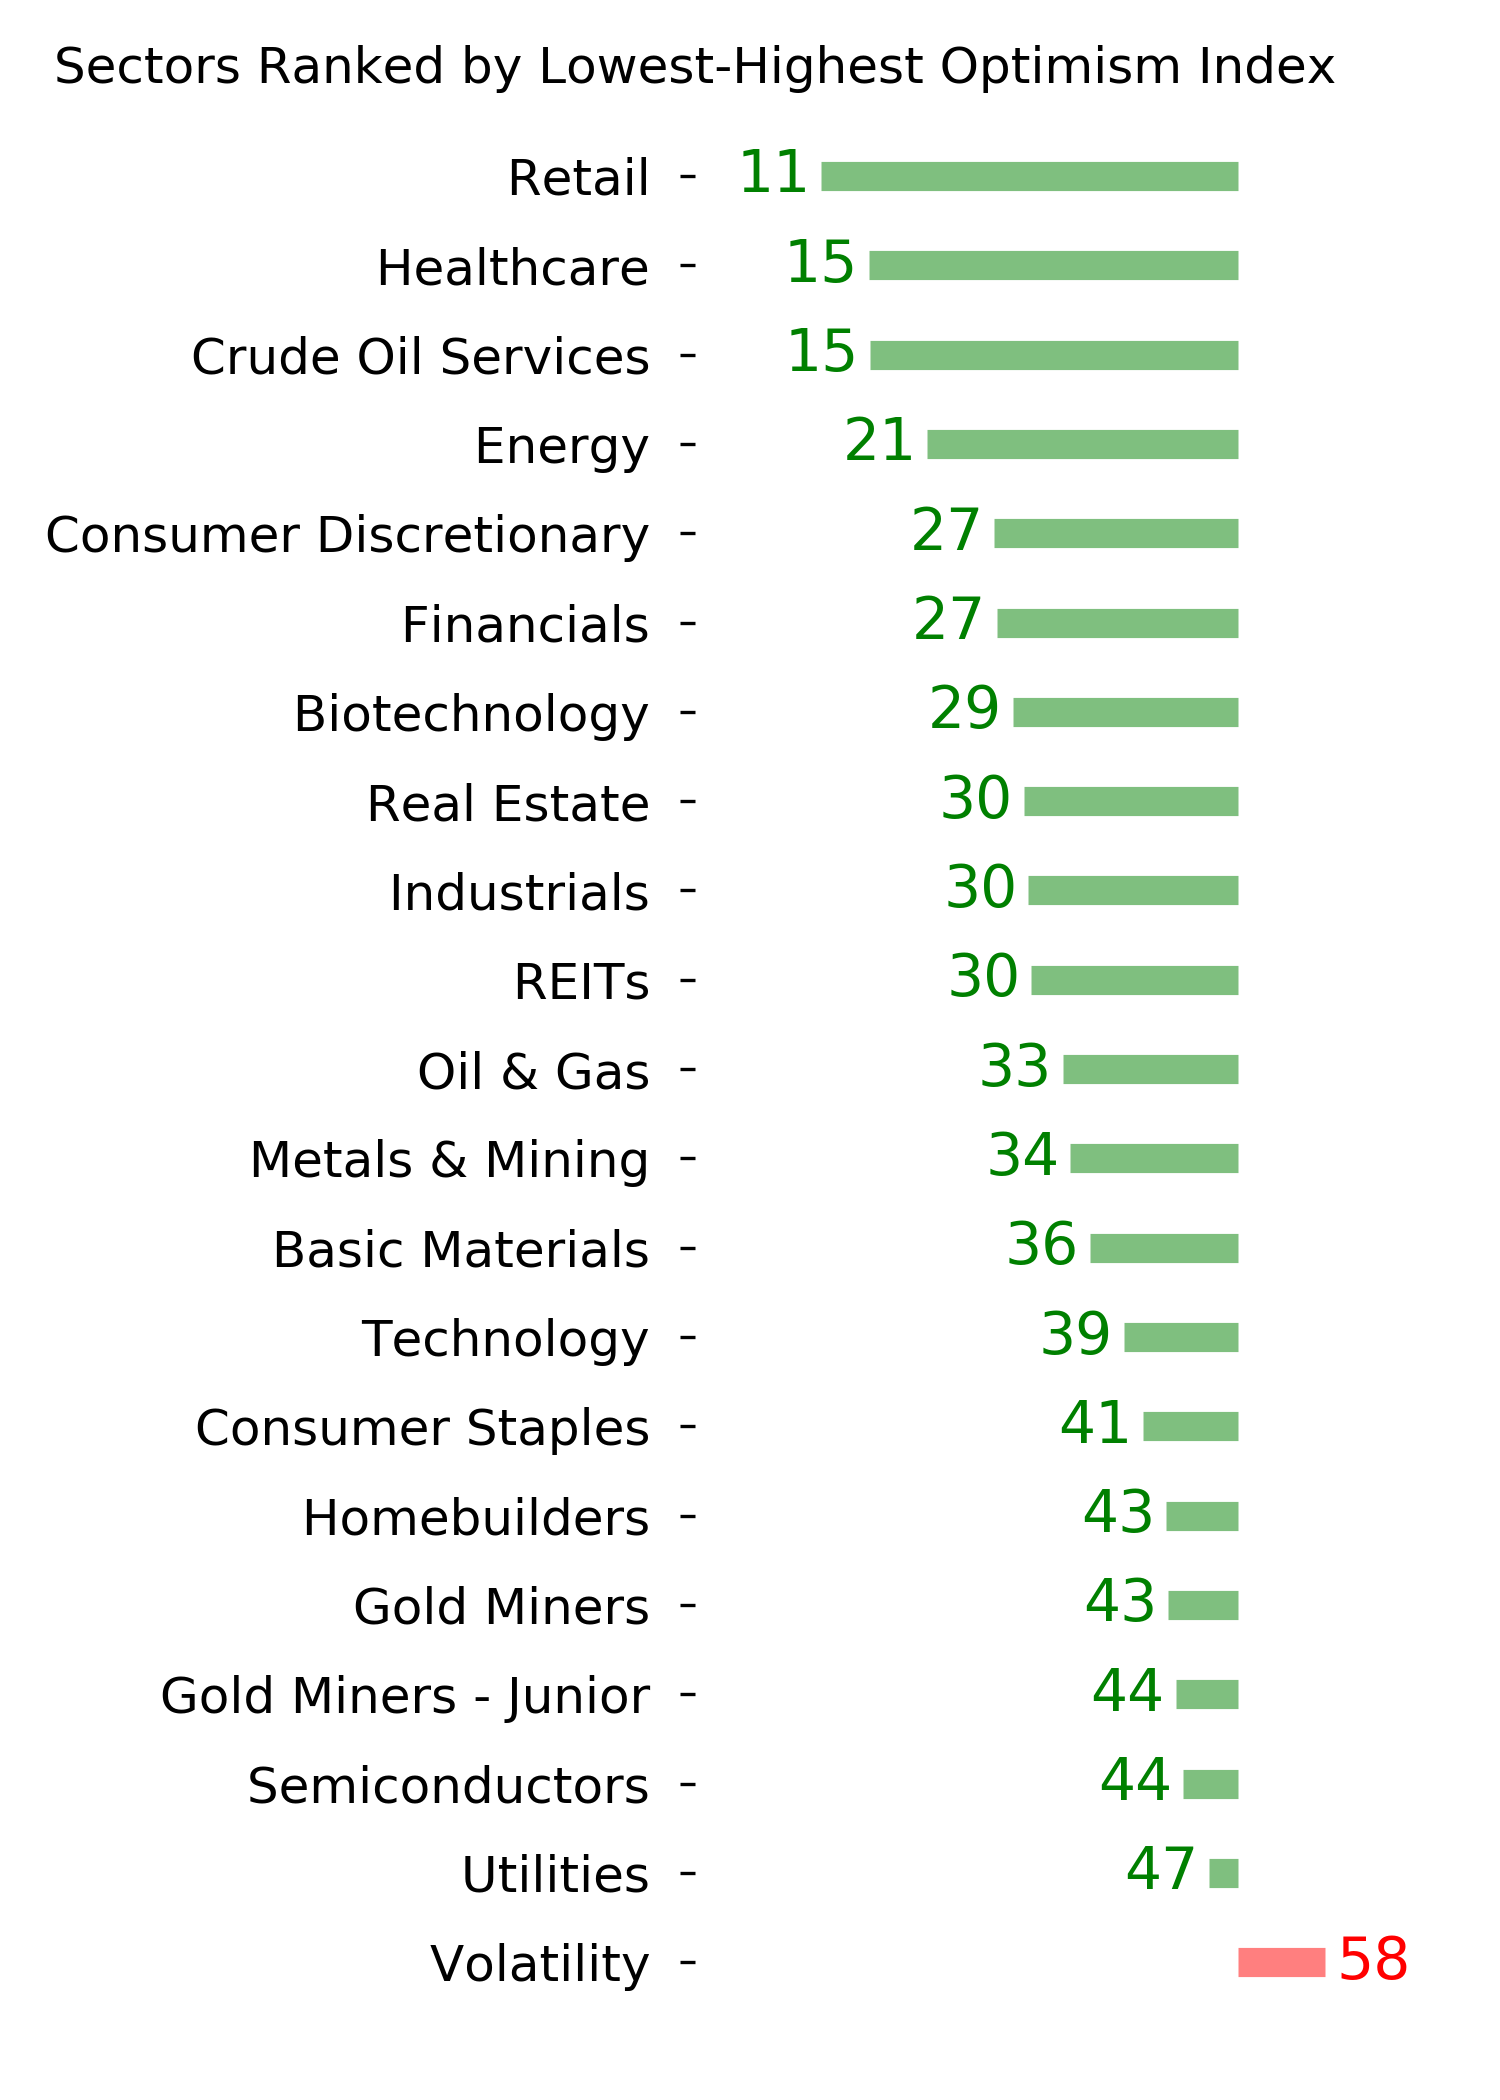
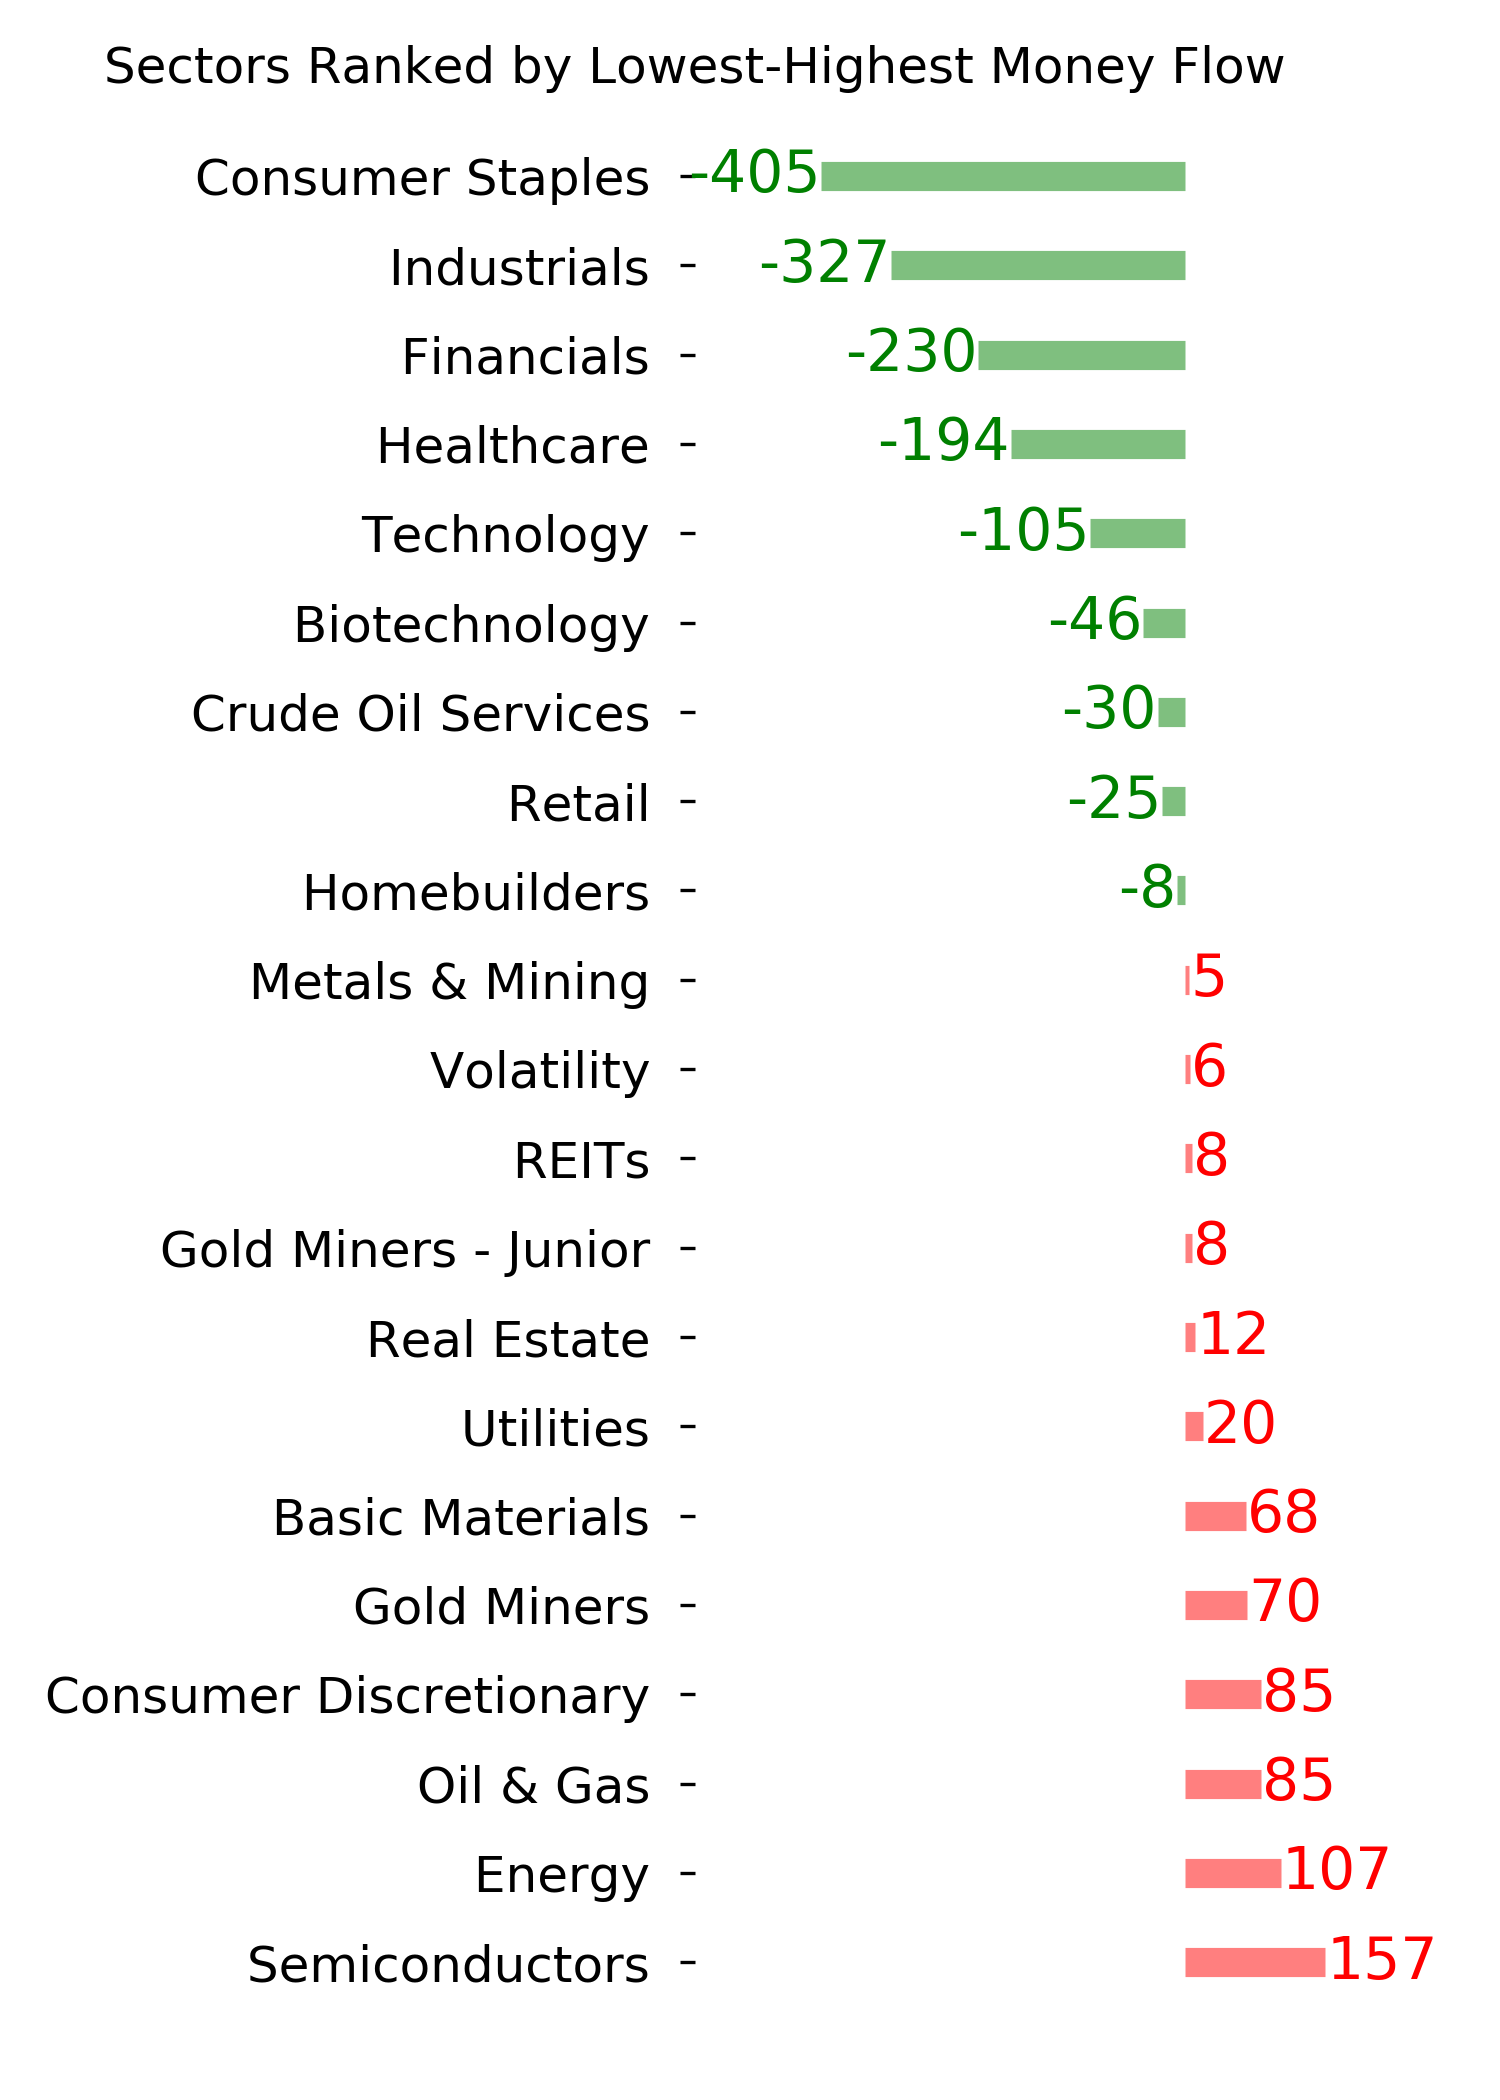
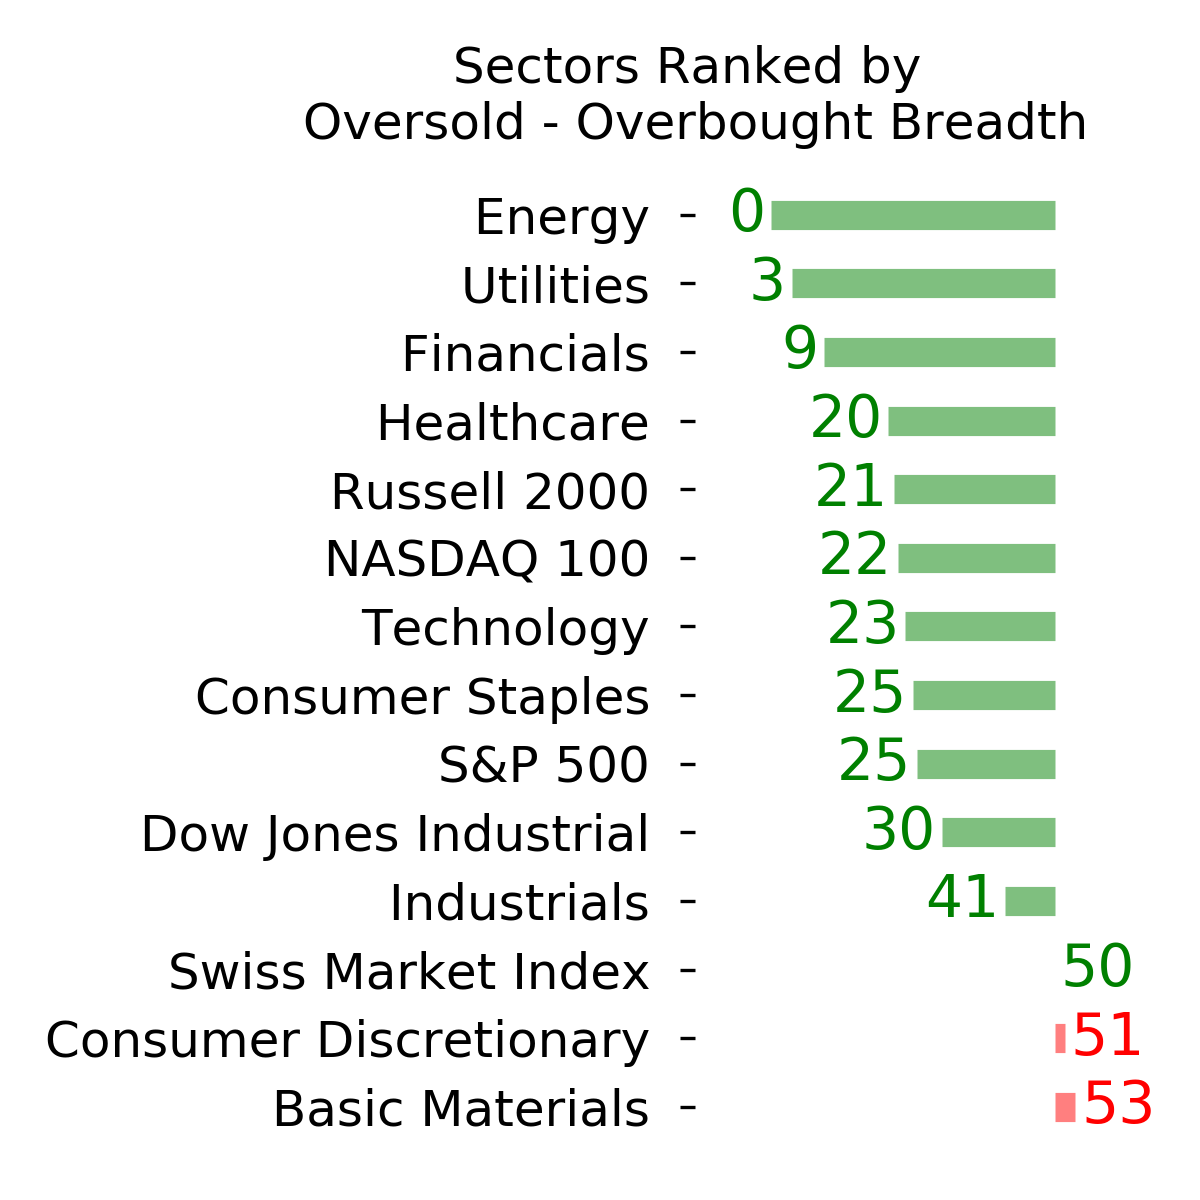
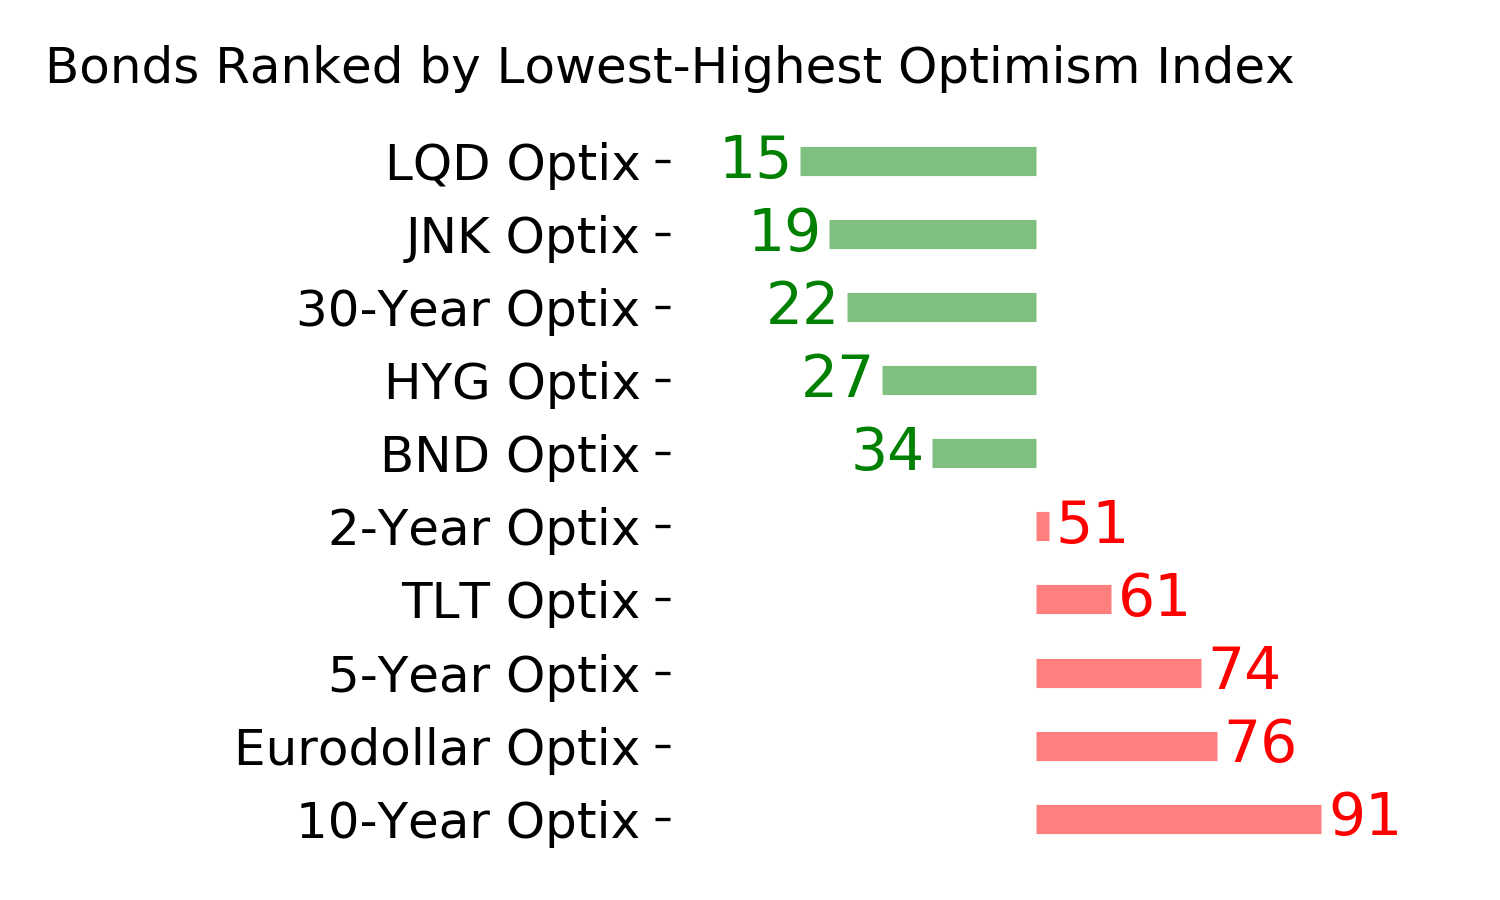
Ranks
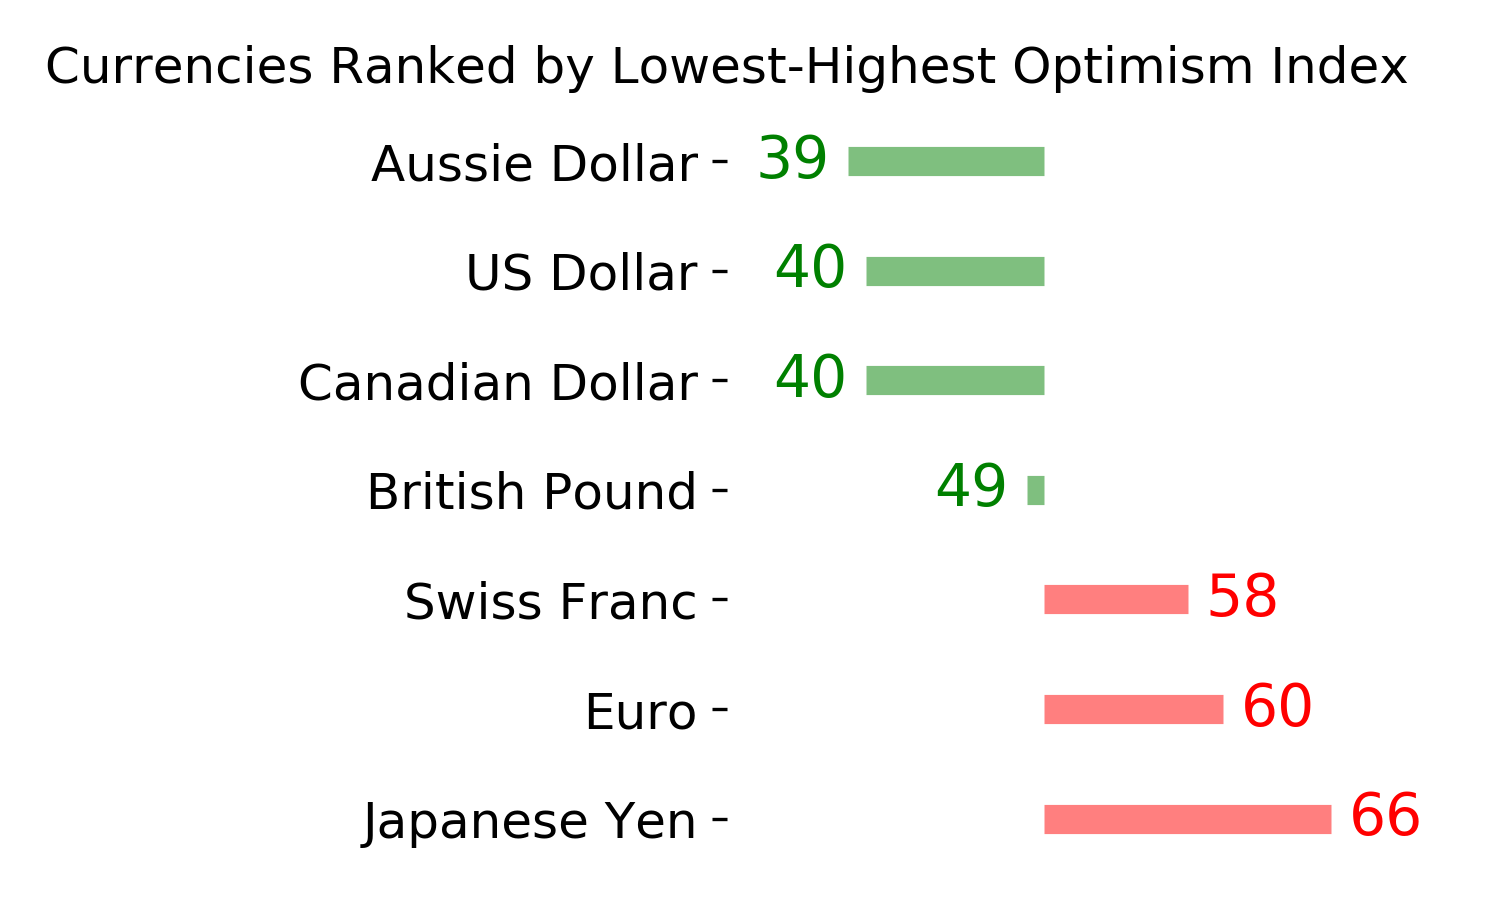
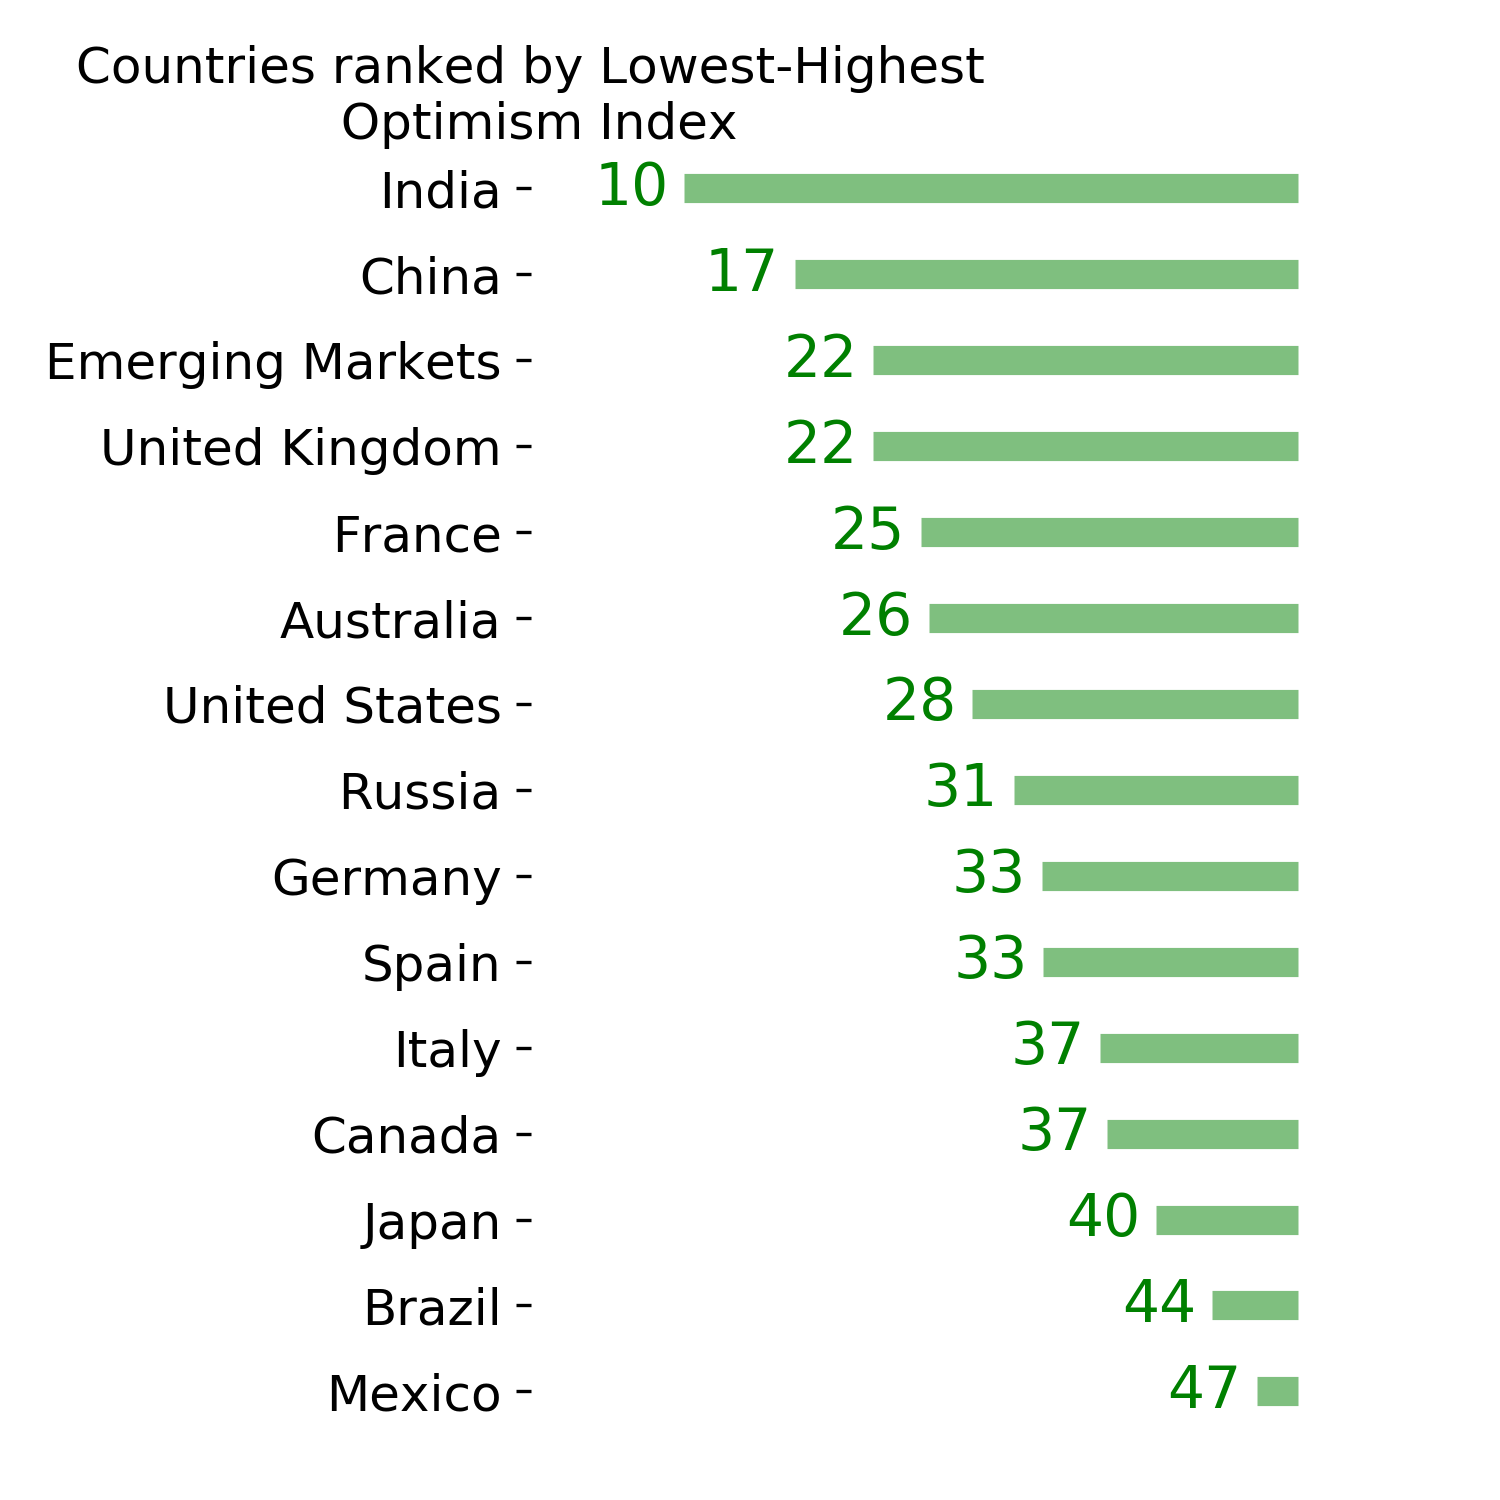
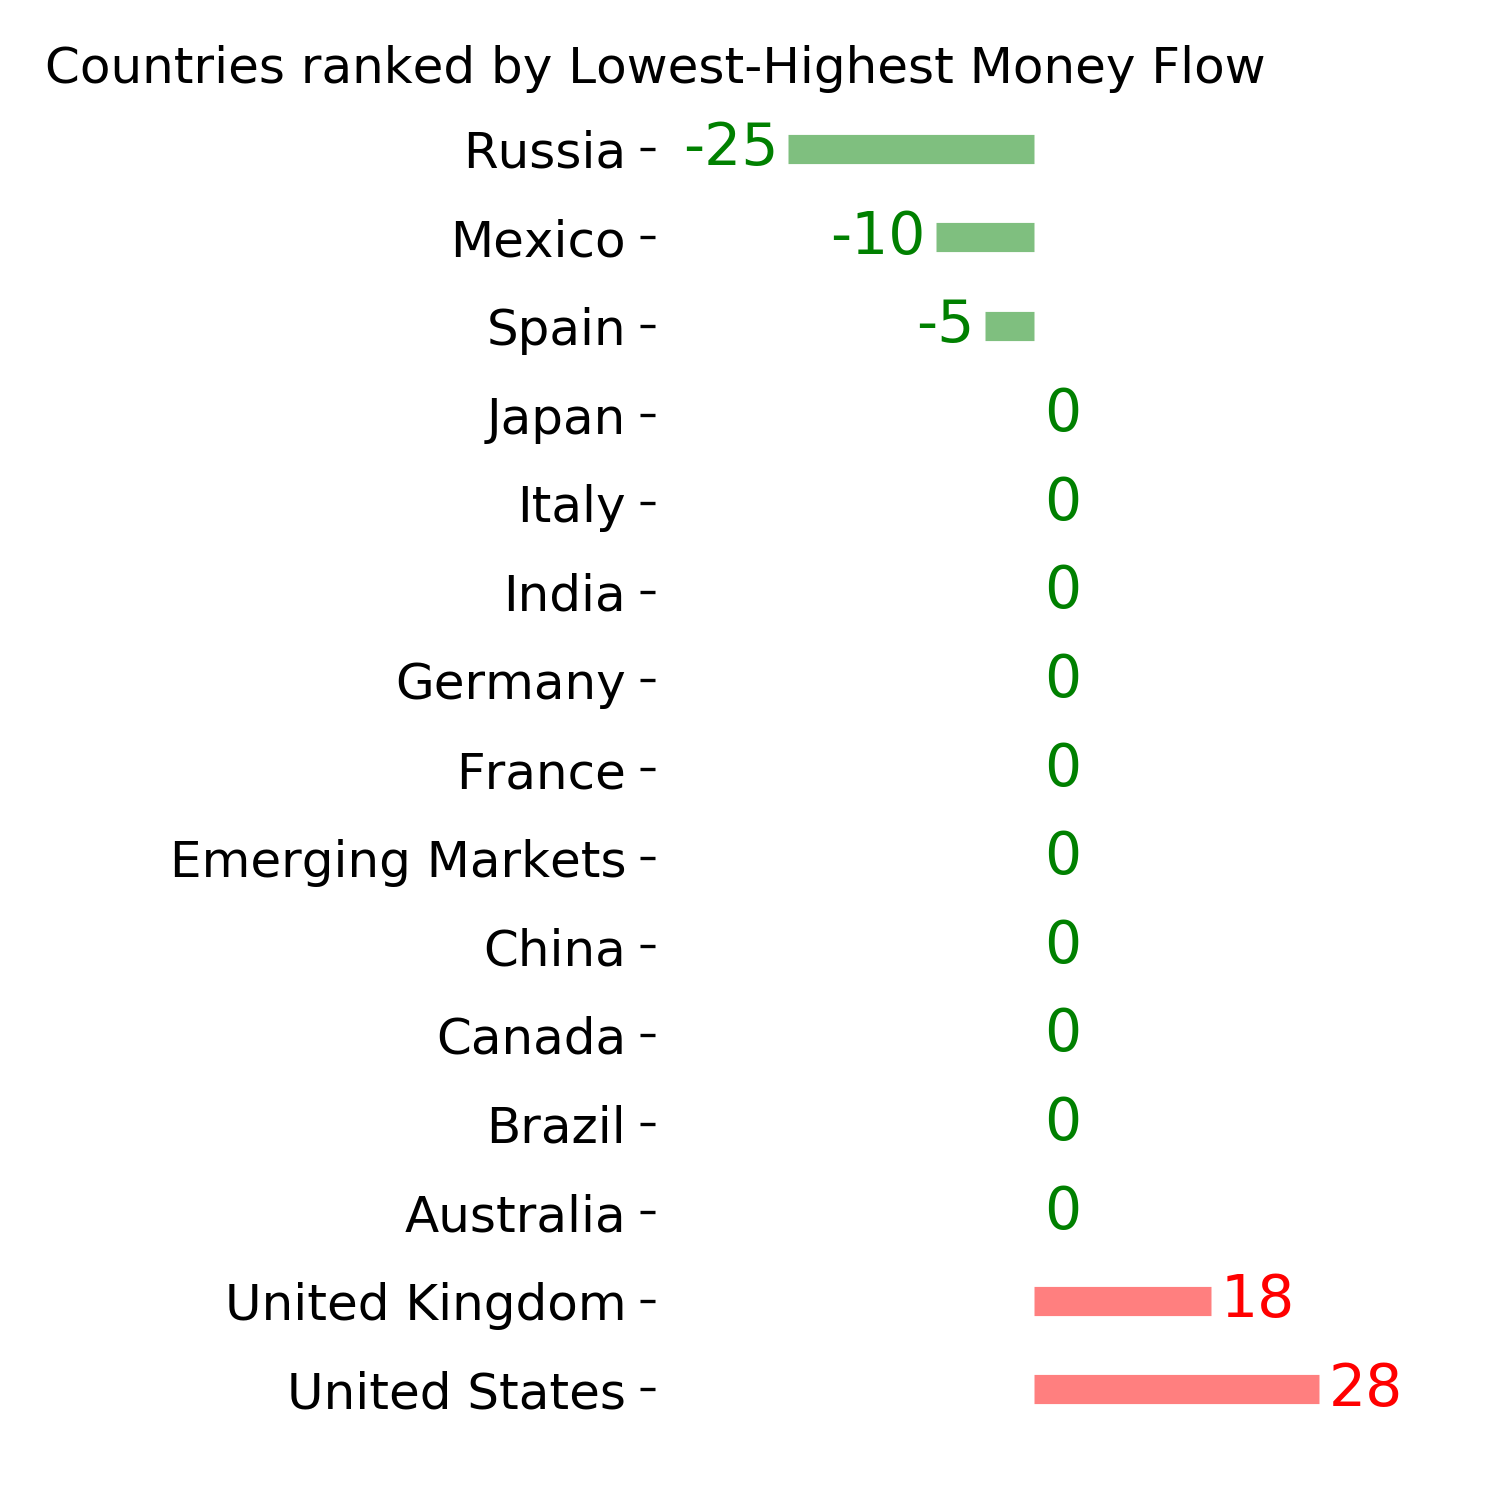
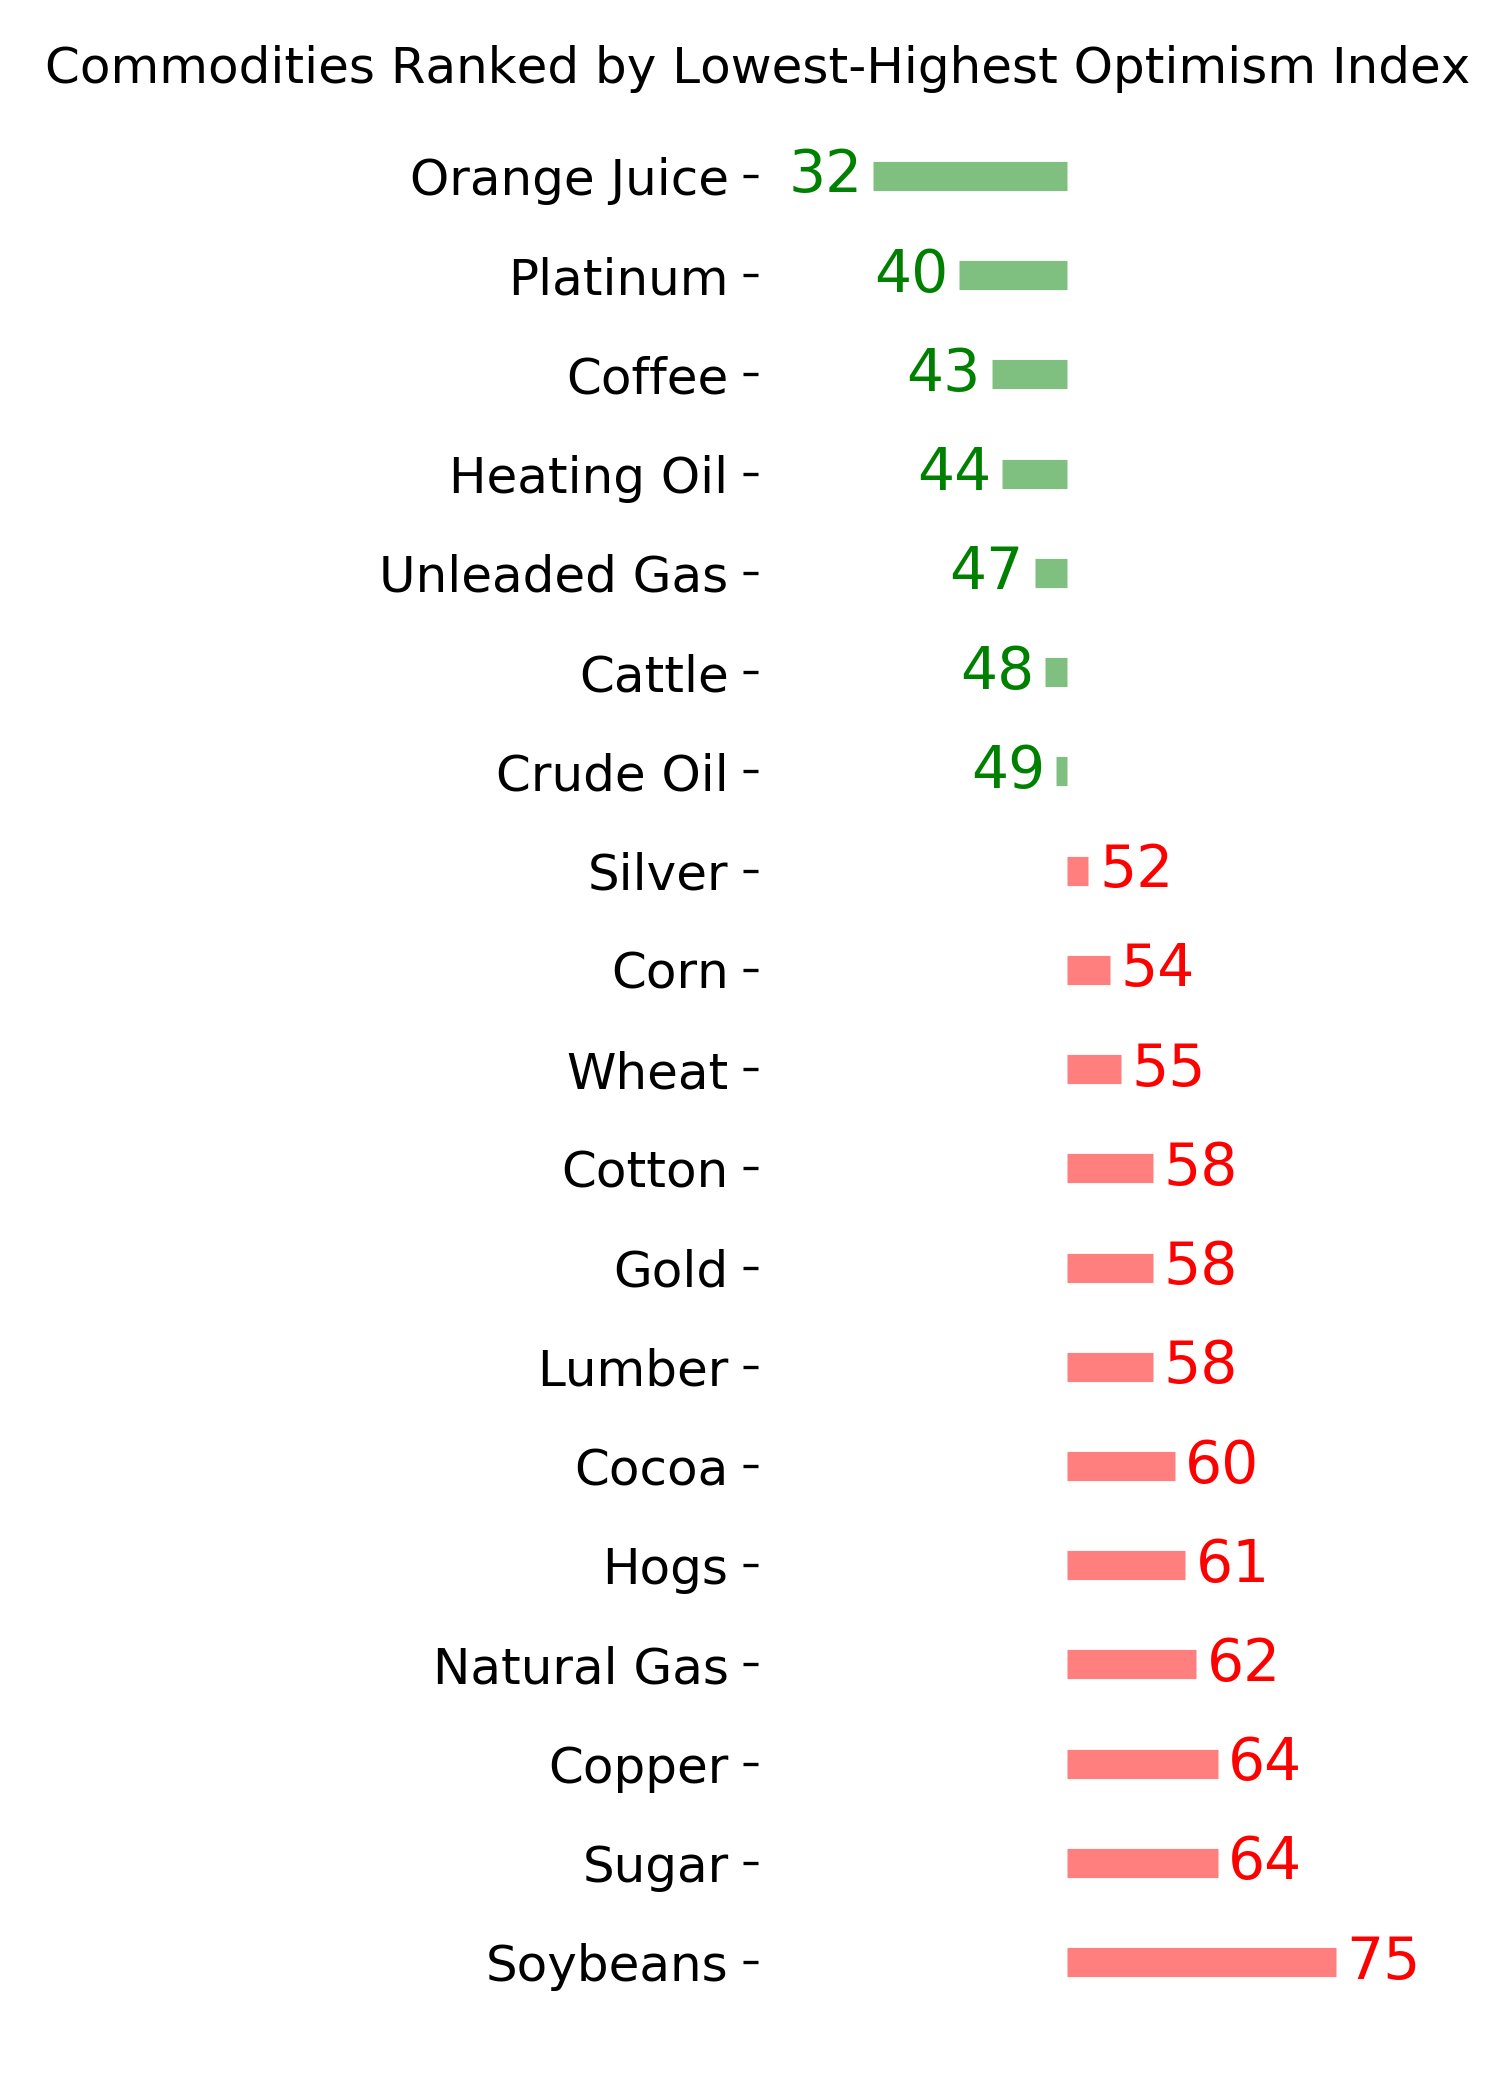
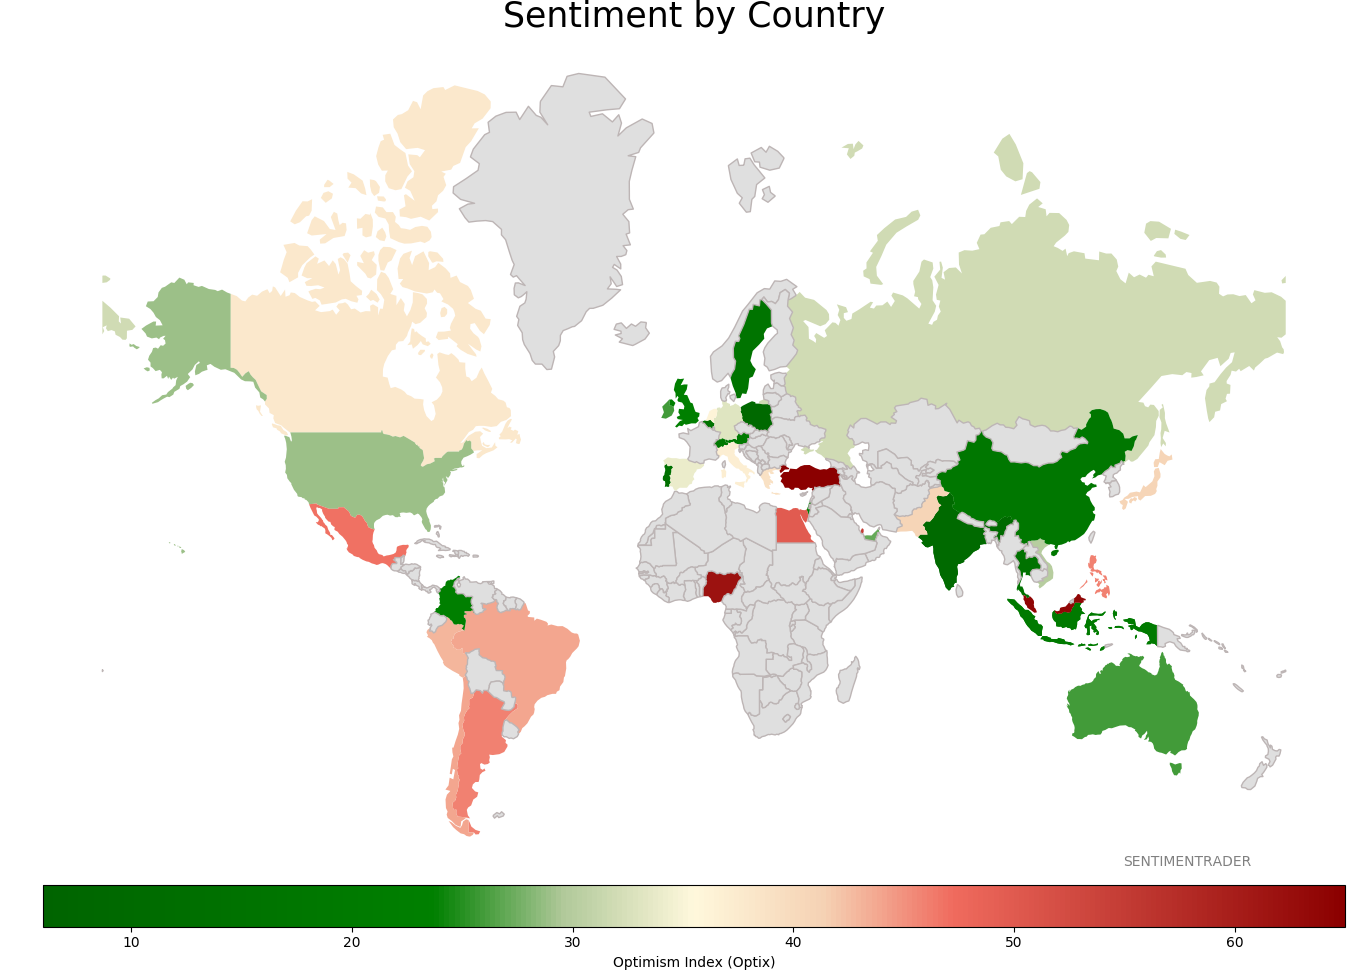
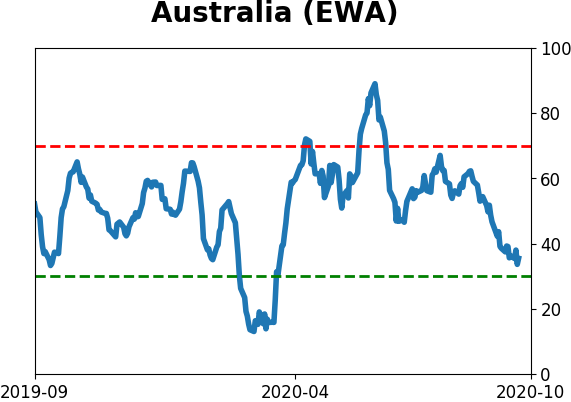
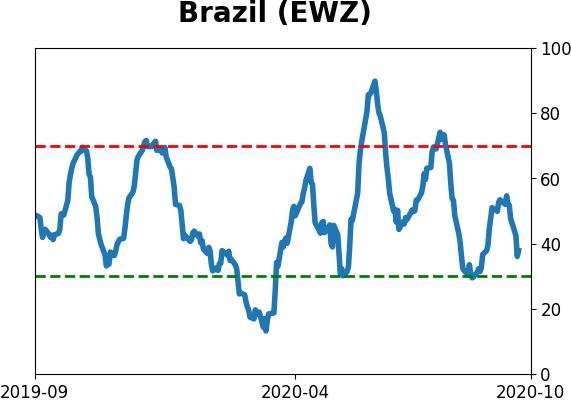
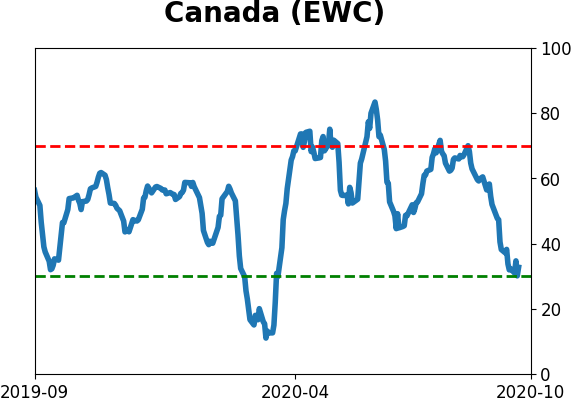
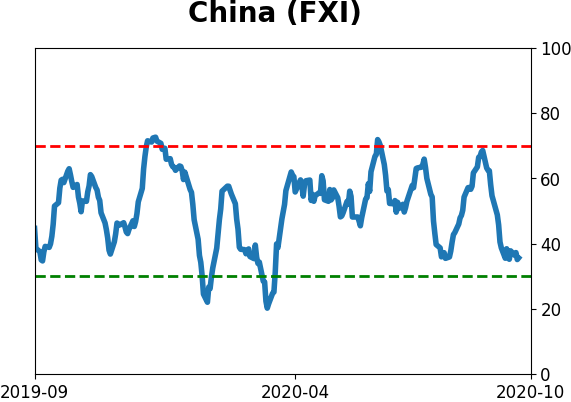
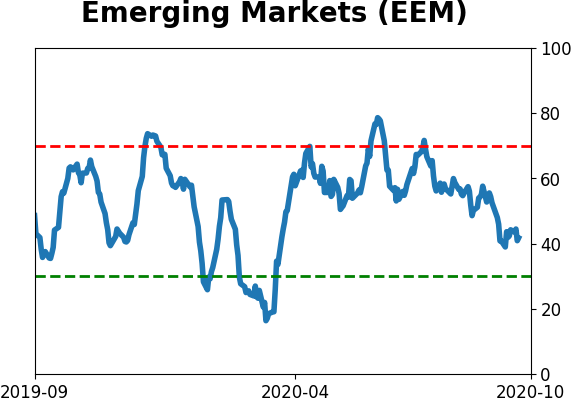
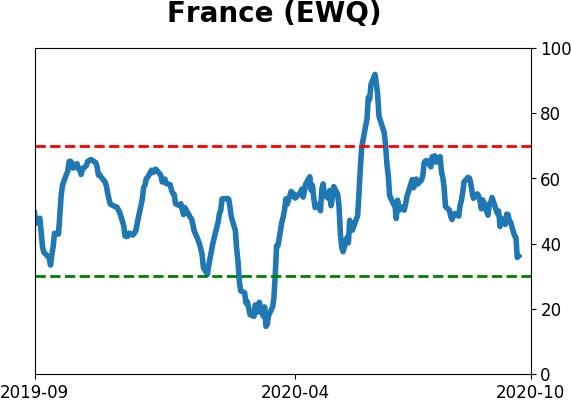
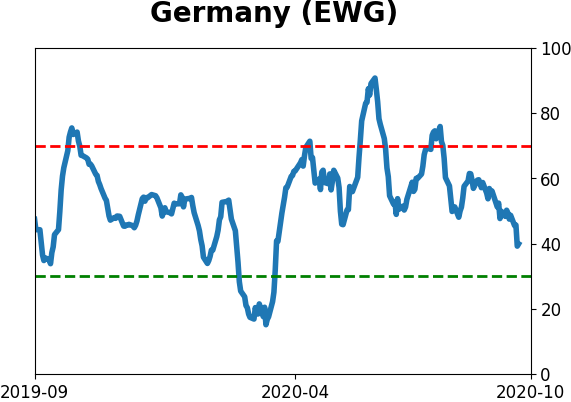
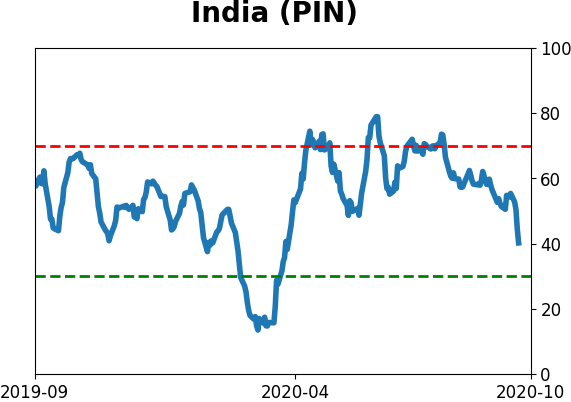
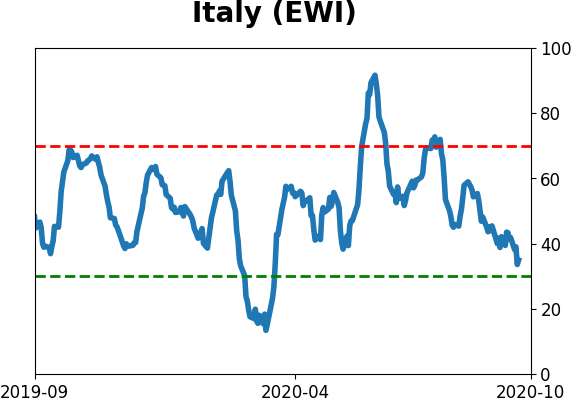
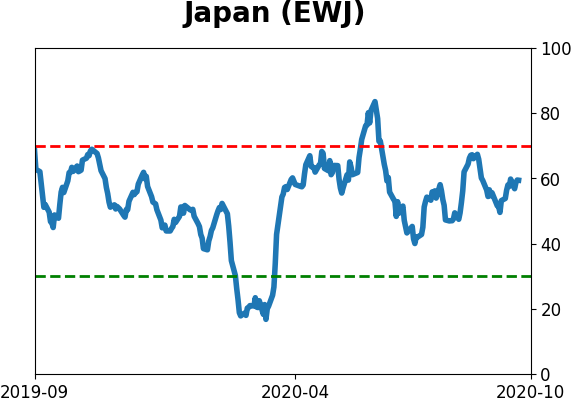
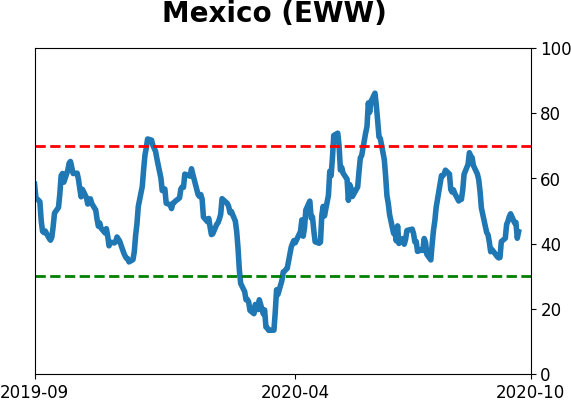
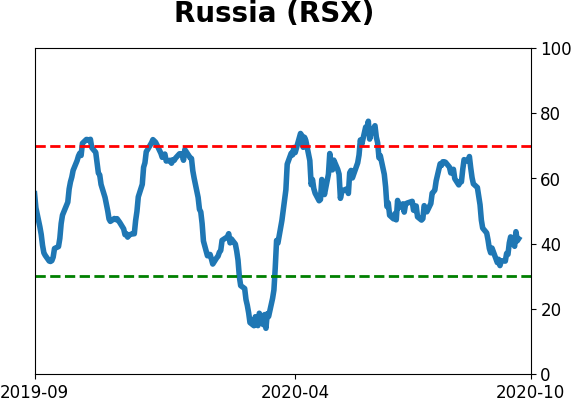
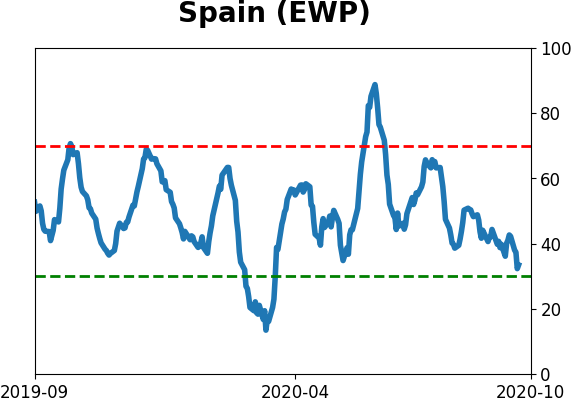
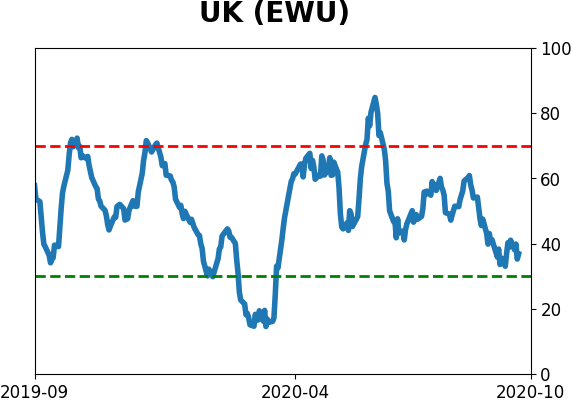
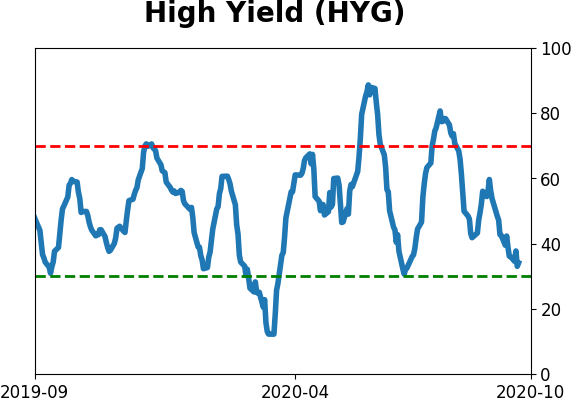
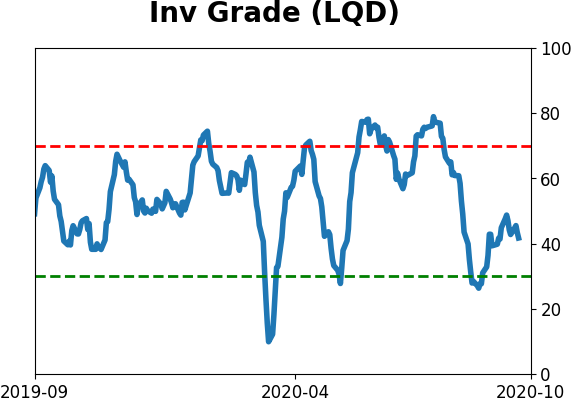
Sentiment Around The World
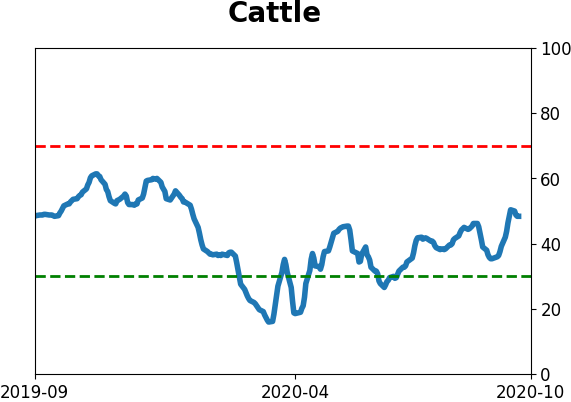
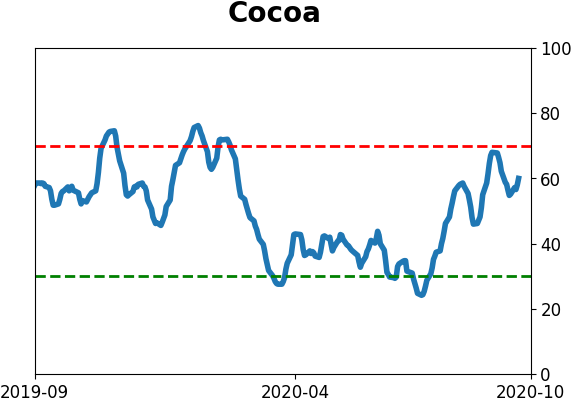
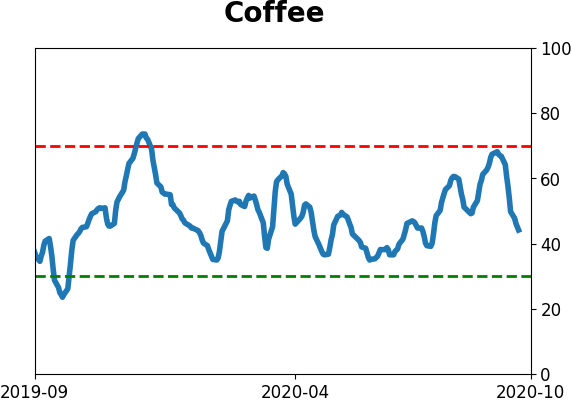
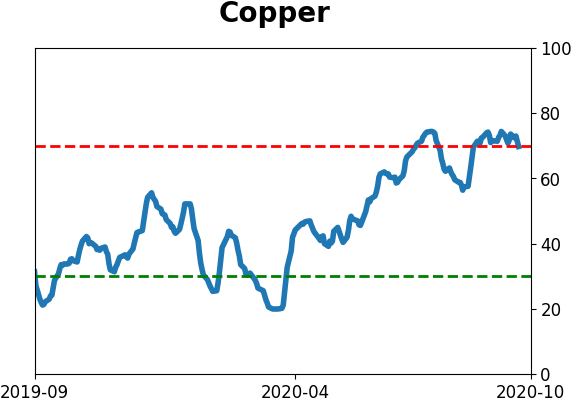
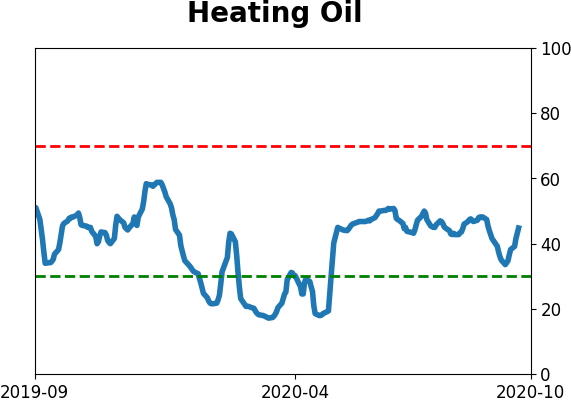
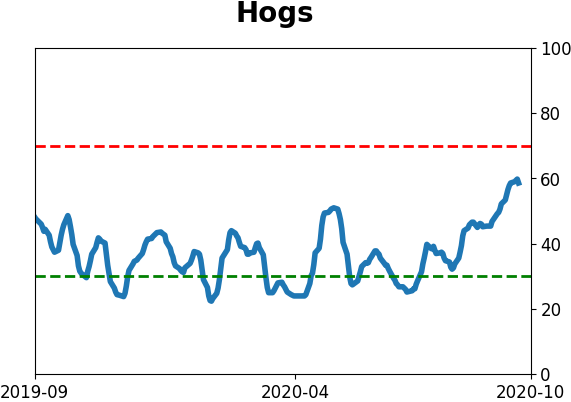
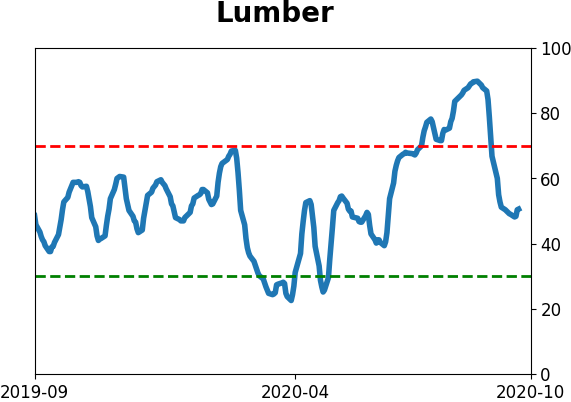
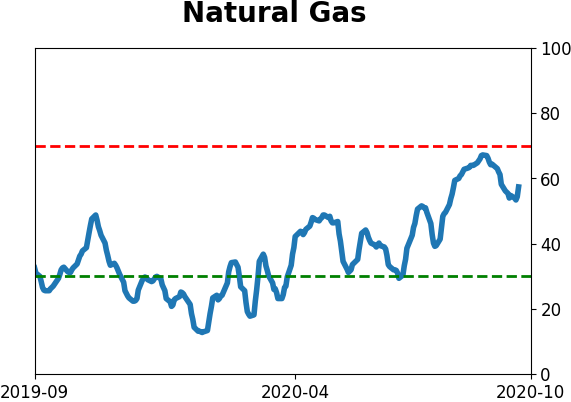
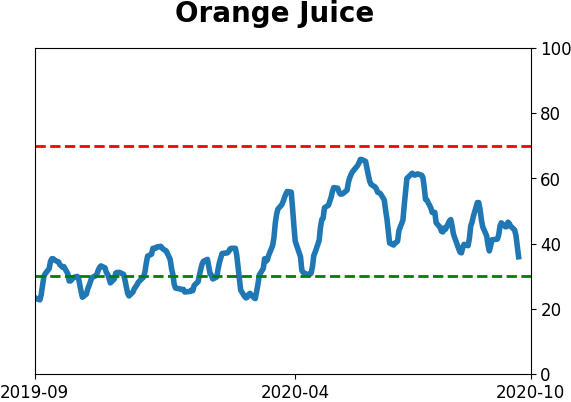
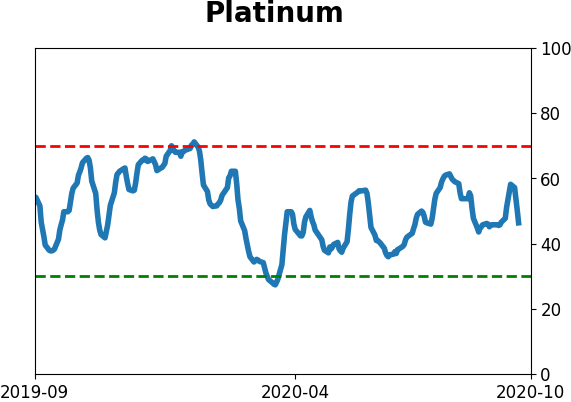
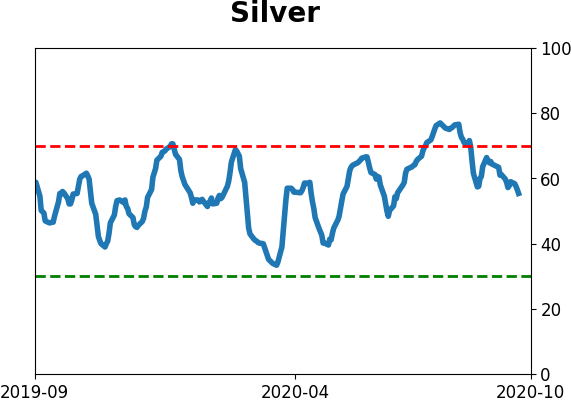
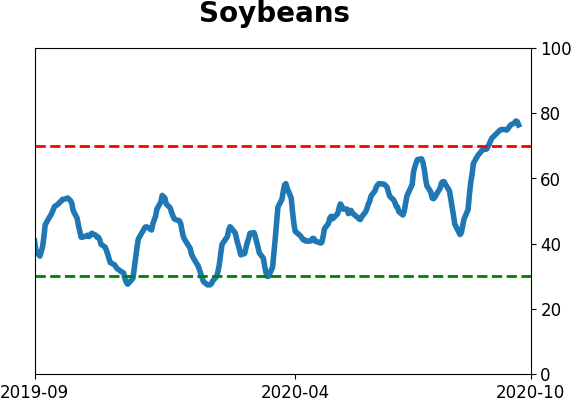
Optimism Index Thumbnails
|
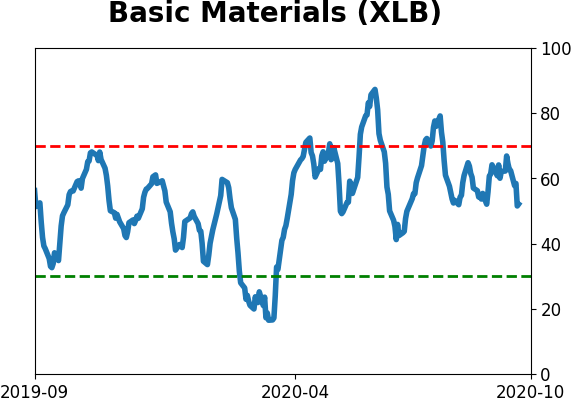
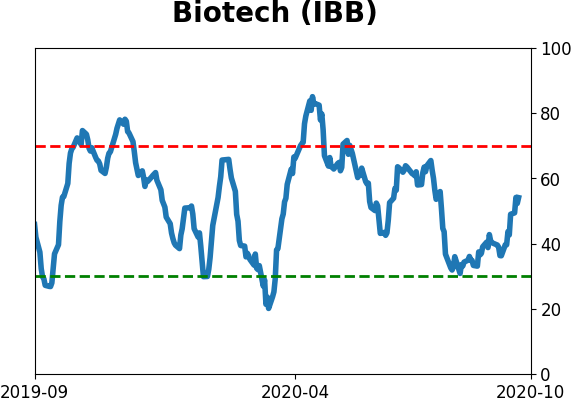
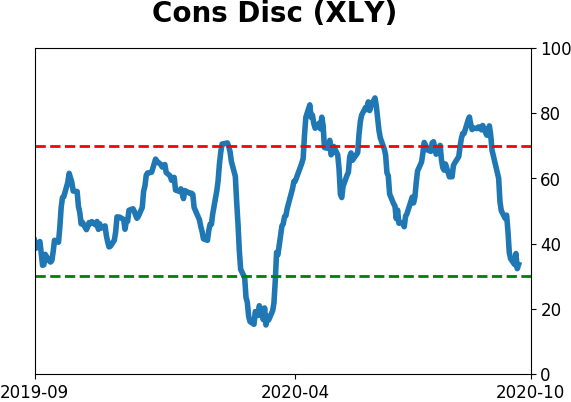
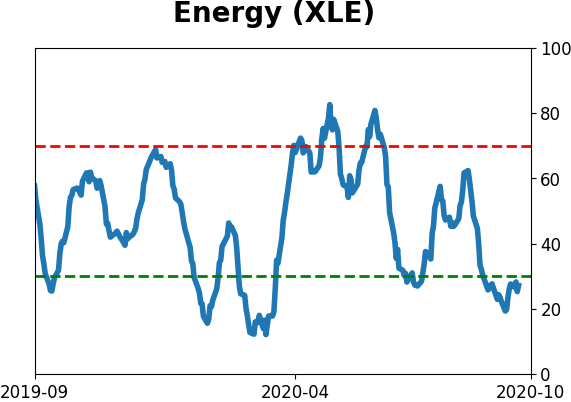
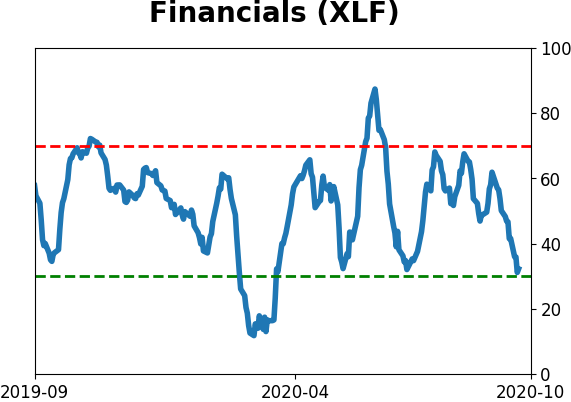
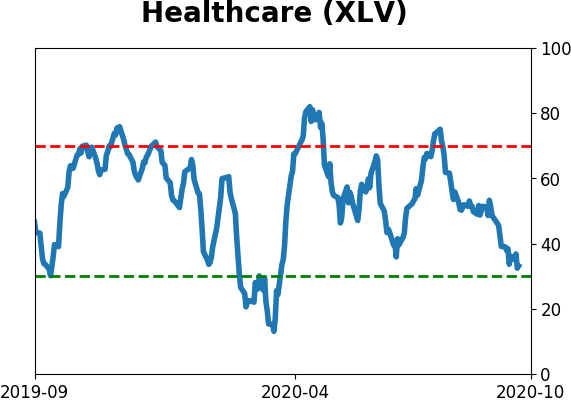
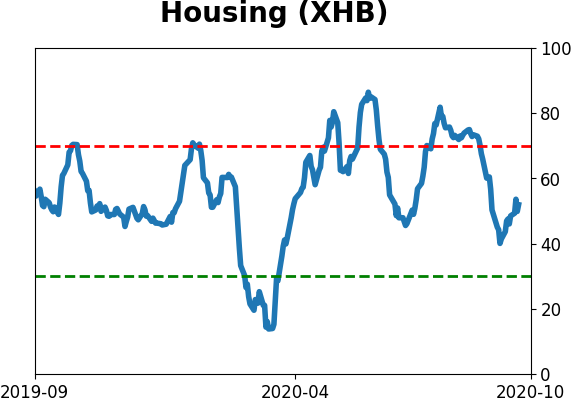
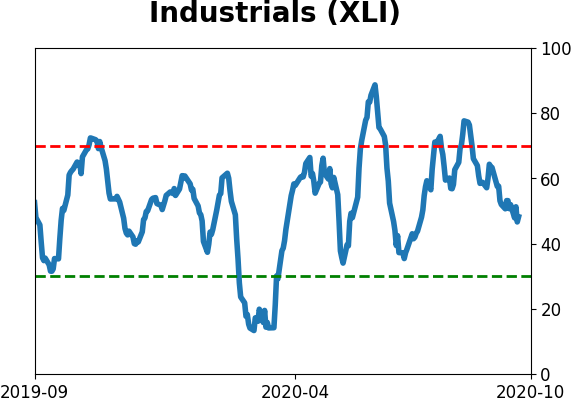
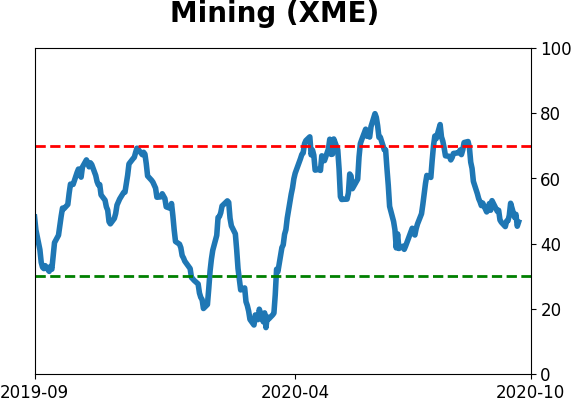
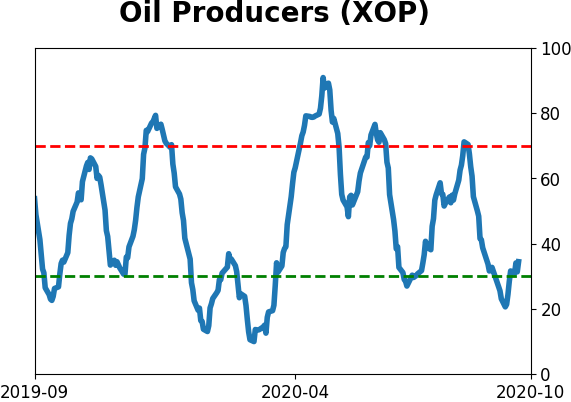
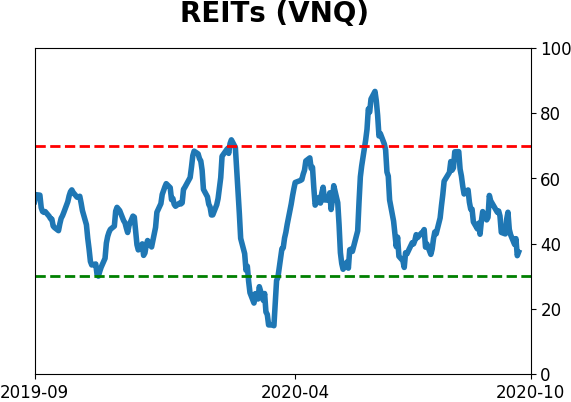
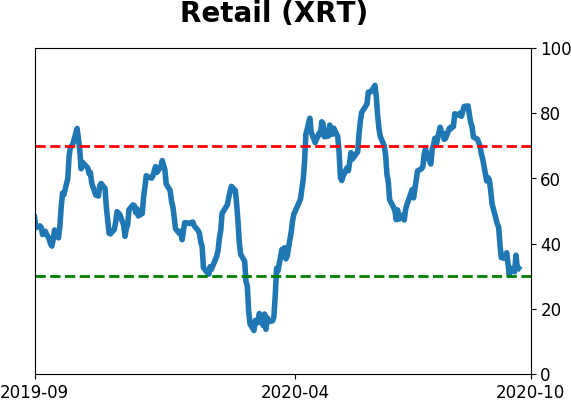
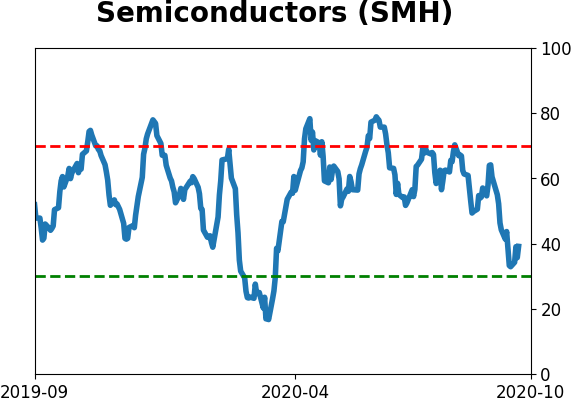
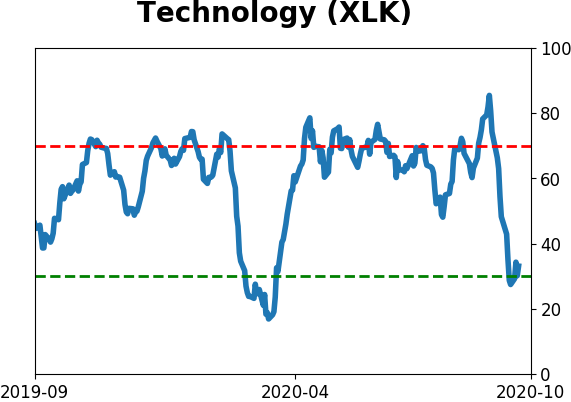
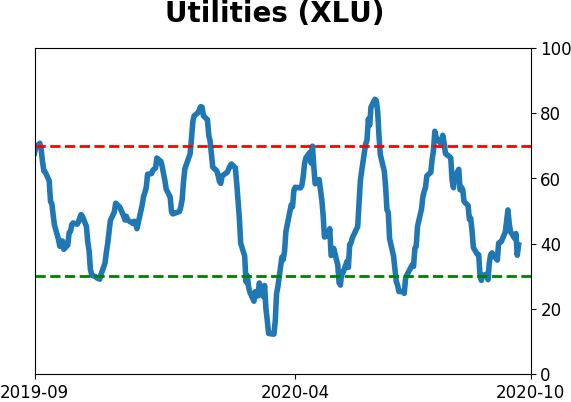
Sector ETF's - 10-Day Moving Average
|
|
|
Country ETF's - 10-Day Moving Average
|
|
|
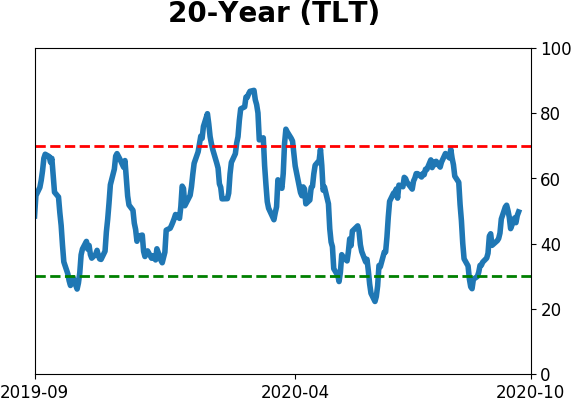
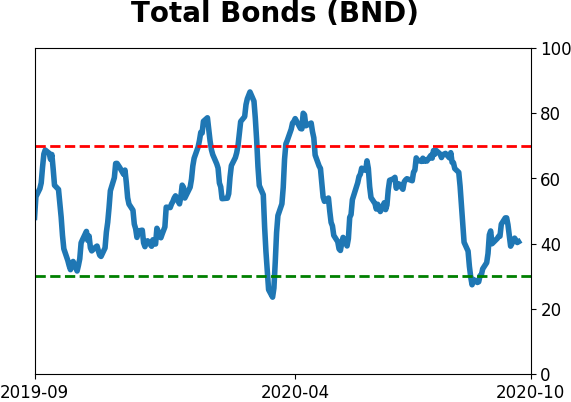
Bond ETF's - 10-Day Moving Average
|
|
|
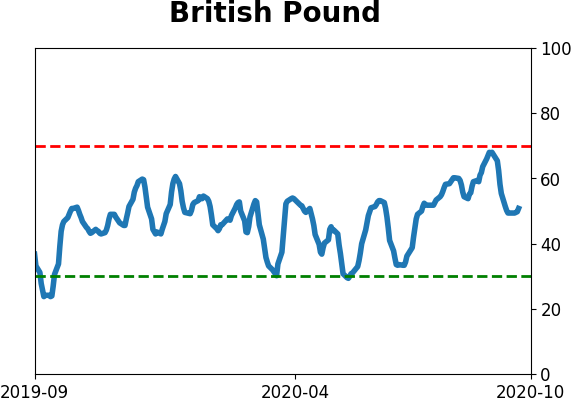
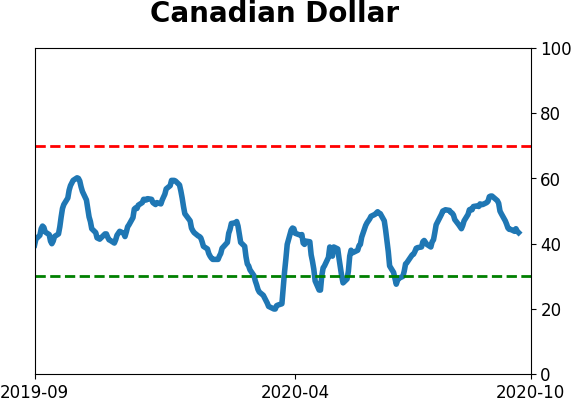
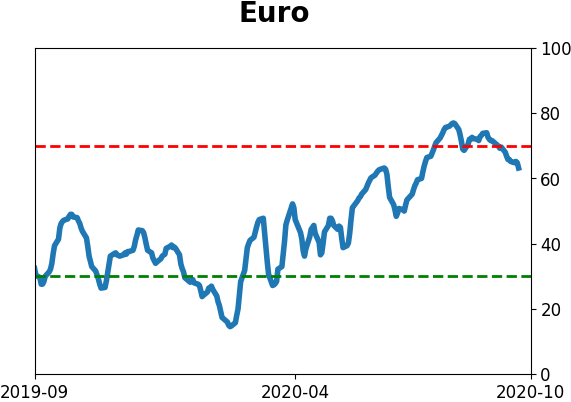
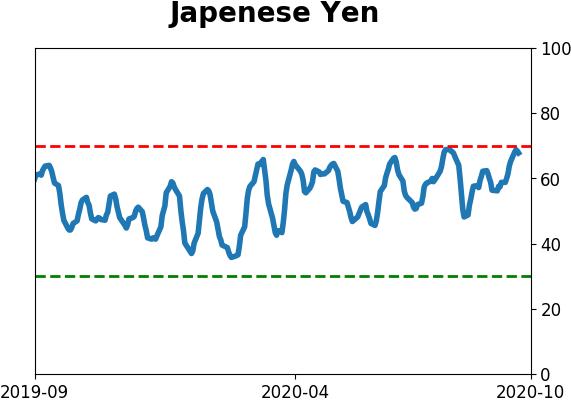
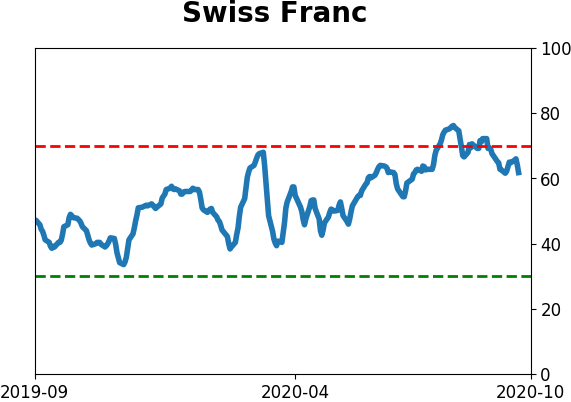
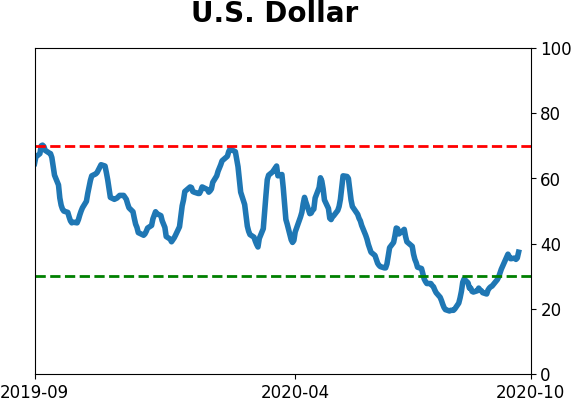
Currency ETF's - 5-Day Moving Average
|
|
|
Commodity ETF's - 5-Day Moving Average
|
|