Environment turning healthier but sentiment still a risk

It pays to step back periodically and re-assess recent developments, which we've been doing weekly. The key questions are whether the market environment is healthy, and how markets are reacting to changes in sentiment as a result.
Environment turning more positive
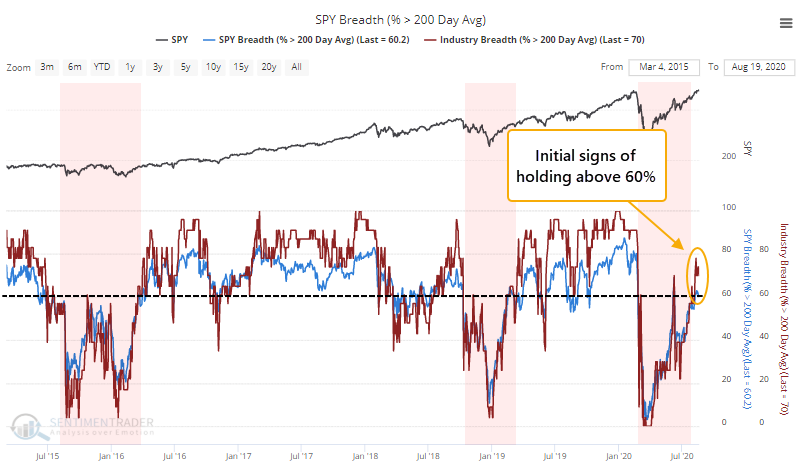
While the breadth thrusts, recoveries, and trend changes have been strongly positive for months, the broader market environment has been neutral at best. The S&P 500 has managed to hold above a rising 200-day average, but its price pattern is mixed, with a higher high but also a lower low. And participation has been an issue.
This week, we're seeing some initial signs that more than 60% of stocks, industries, and sectors are holding above their own averages. The vast majority of time, a healthy environment will see all of those hold well above 60%, rarely dipping below 40%. We're only now seeing the very early stages that this might be the case. There are a lot of qualifiers in that sentence.
The biggest worry at this point is the number of oddities that have built up in recent weeks. We've seen multiple days with larg-ish gains in the indexes, but very weak breadth underlying them.
It hasn't mattered so far, and there have been a few years historically when it didn't matter at all. It's a secondary consideration but still worrying, especially given the still-iffy market environment.
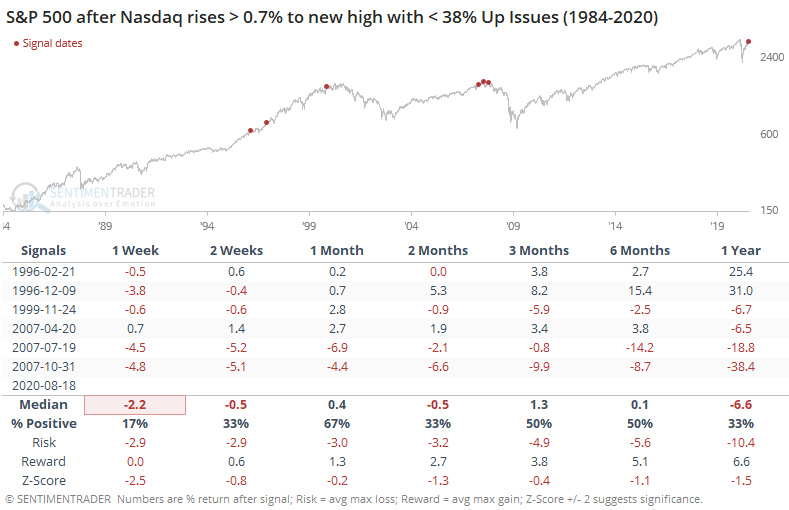
This was an issue once again on Friday. The Nasdaq Composite rose more than 0.4% to a 52-week high, and yet a pathetic 29% of stocks on that exchange managed to rise. This is the lowest in history, at least back to 1984. The next-lowest was a day in July. So, clearly it's been an issue for a while and yet the index continues to levitate.
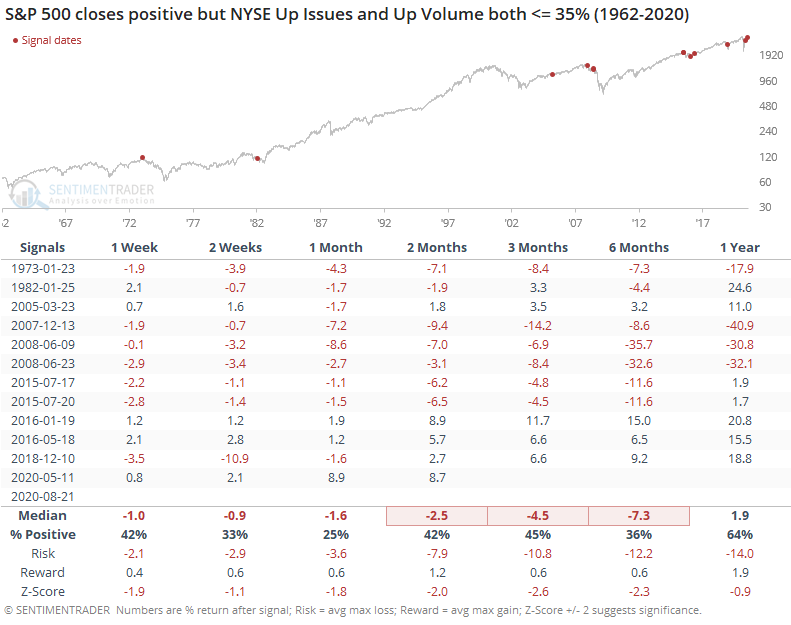
The S&P 500 rose more than 0.3% on Friday, yet the Up Issues Ratio and Up Volume Ratio were both 35% or less. This is the worst ever, dating back to 1962. Even for a day the S&P rose by any amount, it's some of the worst breadth we've ever seen.
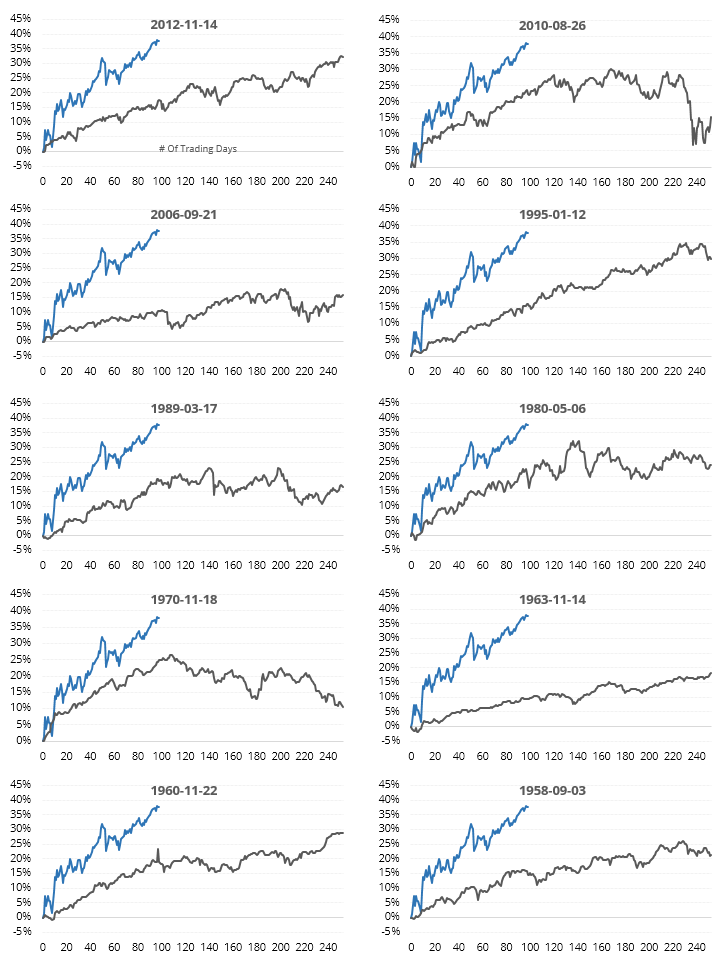
A lot of comparisons have been made to the post-2009 recovery, but as we saw earlier this week, there are other time periods that have a higher correlation. Below, we can see thumbnails of the most recent signals (the dates show the start of the 100-day comparisons). It's interesting to note how many of them started to run into a little bit of trouble around day #100 - 120.
Sentiment is still extremely optimistic
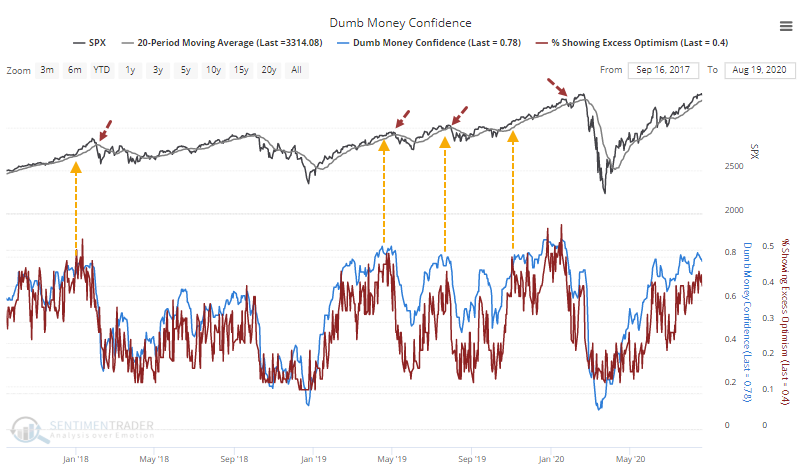
There wasn't much that was new this week. There are outliers, of course, like fund flows. But the majority of our core indicators are still showing high confidence that stocks will rally.
In recent years, when this was the case, stocks fell back soon twice but managed to continue their rallies for a while twice as well. A very general guideline was that most of the weakness was felt once the "creeper" trends were broken decisively, even just using a 20-day moving average on the S&P for that determination.
We tend to shy away from suggesting triggers, as everyone has their own favorite methodology for determining trends on different time frames. That also means that we are typically early since sentiment and our studies tend to precede turns in price. Whatever the trigger, if stocks start to experience some weakness (the indexes, anyway - many individual stocks already have) then the setup is ripe for a pullback.
Other markets
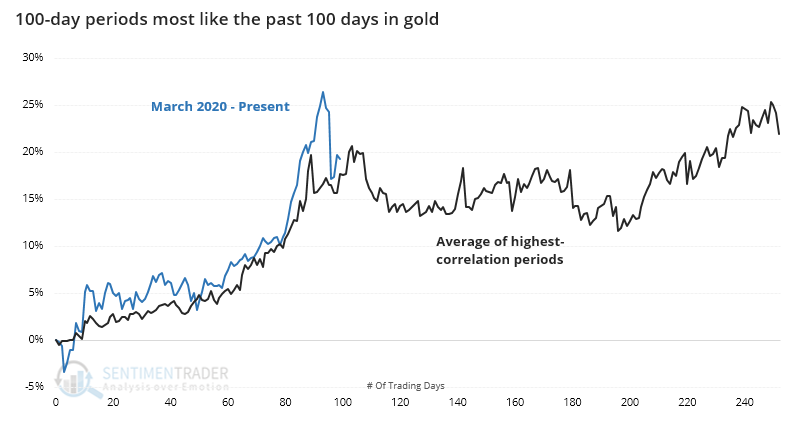
The biggest development we looked at in other markets was the same type of analog in gold that we did for stocks. By the time gold had enjoyed 100-day streaks like the past 100, it ran into some issues.
It has also struggled after the dollar enjoyed a price reversal like it did on Wednesday.
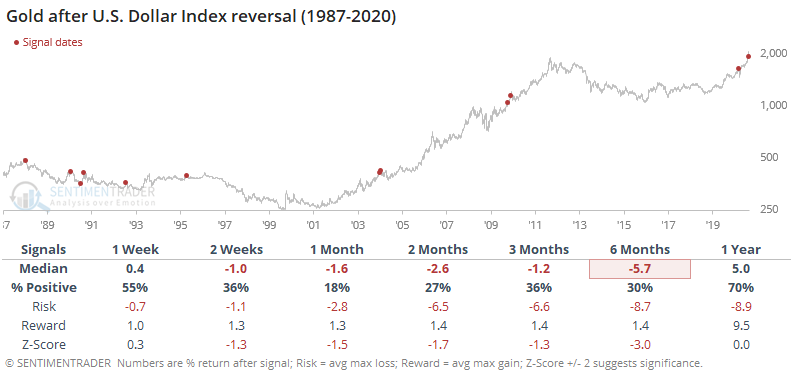
Momentum in the dollar has been very weak, and that tends to persist over the medium- to long-term. Shorter-term, reversals like it saw this week, and heavy pessimism, are better signs shorter-term.
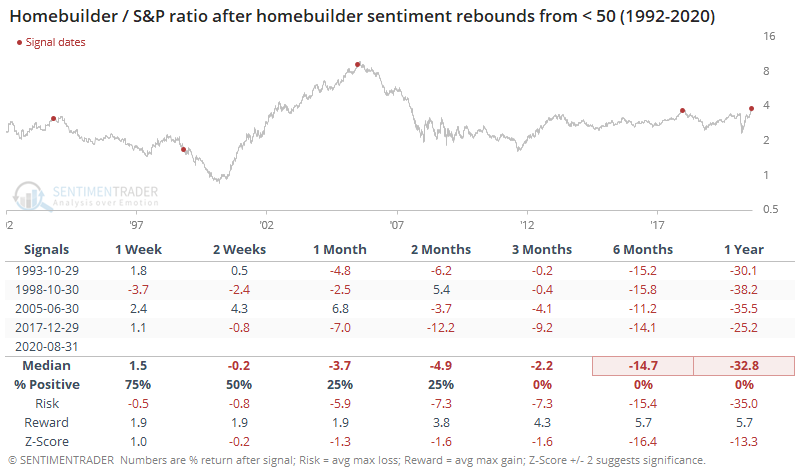
Among sectors, the biggest development was record optimism among homebuilders. The sample size is tiny, but other times builders' sentiment had recovered enough to hit new highs, the sector struggled both absolutely and relatively.