
TradingEdge for Jan 14 - Surge in defensive sectors and value stocks, Energy surge, dollar drop

Key points:
- The McClellan Summation Index for defensive sectors has soared to a near-record high
- Utilities, in particular, may be helped by poor sentiment in the bond market
- Inflation data also suggests that defensive sectors may benefit the most
- Value has surged relative to Growth, setting a 6-month high
- Energy sentiment has reversed from a low level
- The "first 5 days" bias suggests gains for Energy, too
- The Cumulative Advance/Decline Line is diverging for stocks (and high-yield bonds)
- Silver seasonality is positive at the moment
- Other commodities have recovered, pushing more of them above their 50-day moving averages
- At the same time, the dollar crossed below its 50-day average, ending a historically long streak
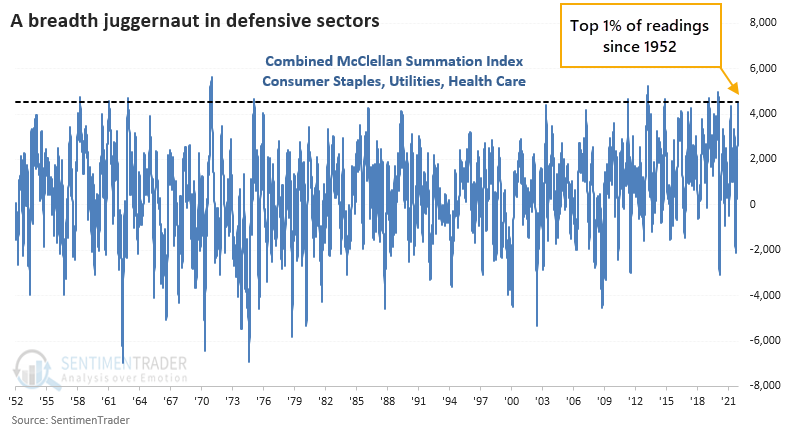
Defensive sectors are showing persistent internal momentum
Consumer Staples stocks have been on a roll. In December, we saw that those stocks were seeing an impressive thrust and longer-term recovery, which has tended to see further gains in the months ahead.
So far, that's been the case. The McClellan Summation Index for Staples is now well above +1000, one of its highest readings in a decade.
It's not just Staples. Another core defensive sector, Utilities, is also seeing impressive internal momentum.
And so is the other one, Health Care.
The Summation Index for all 3 sectors is now well above +1000, and their combined value is now in the top 1% of all days since 1952.
It's assumed that if investors are so hyper-focused on defensive stocks, it's a bad omen for the broader market. Not to be. While the S&P 500 didn't exactly go gangbusters after these signs of long-term internal momentum in the defensive sectors, it still showed above-average returns. It was rare to see a loss over the next 6-12 months.
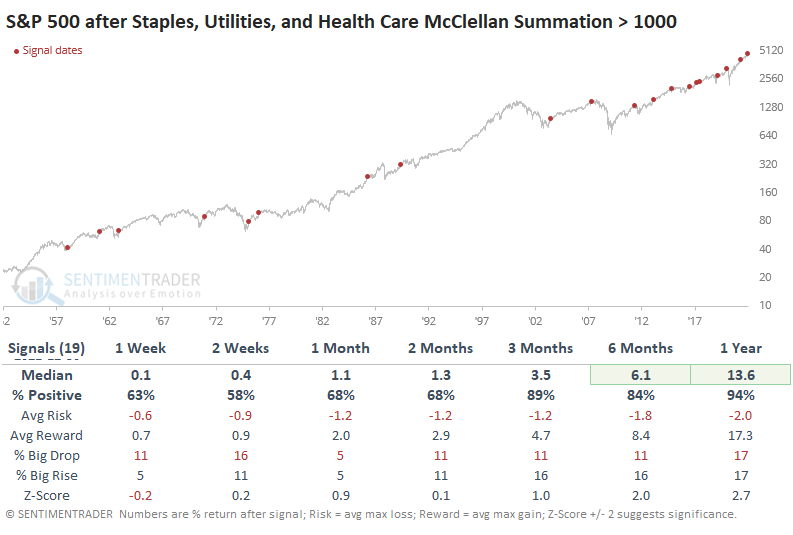
The Risk/Reward table shows small drawdowns with 2 exceptions (2011 and 2020). Outside of those two dates, the S&P didn't lose more than 6% at any point within the next 6 months. By comparison, 13 of the signals showed a gain of more than +6% at some point in the next 6 months.
The most impressive performance for the sectors themselves was longer-term, except for Utilities. That sector always seems to have problems holding any kind of upside momentum extreme.
Bond pessimism should be a good sign for Utilities, too
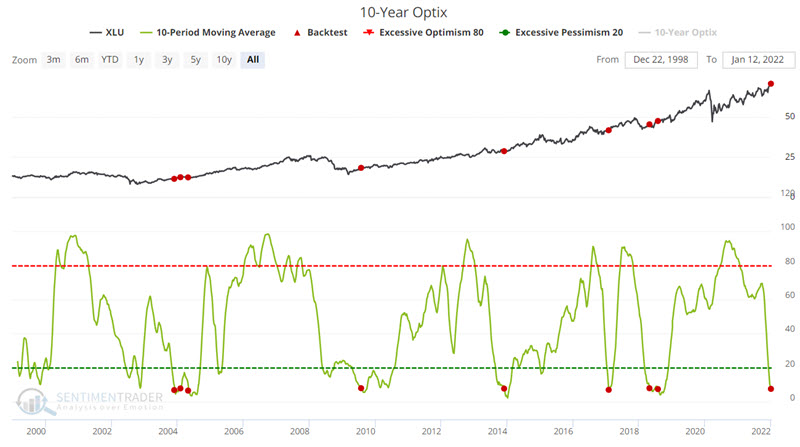
Many investors trade utility stocks as a proxy for the bond market because utility stocks typically offer a higher dividend yield than other stock market sectors. Jay showed some noteworthy results for utility stocks that have followed excesses in bond trader sentiment.
The top line in the chart below displays the Utilities Select Sector SPDR Fund ETF (XLU). The bottom line shows those times when the 10-day moving average for 10-year treasury note Optix has crossed below 8 for the first time in a month.
The table below displays a summary of XLU performance following previous signals.
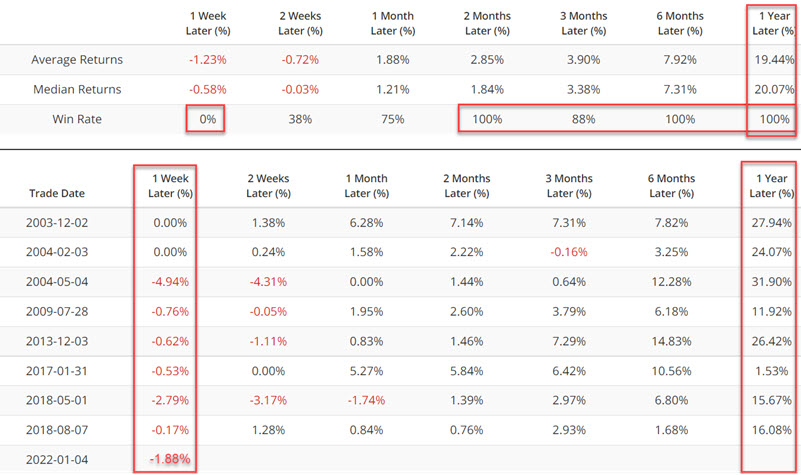
The results for XLU have had some interesting quirks:
- XLU has never shown a gain in the first week after a signal
- 2-month, 6-month, and 1-year returns have been positive after each signal
- The average and median returns for 1-year have been exceptionally robust
In this context, the sharp decline for XLU in the week following the latest signal might be viewed as a buying opportunity.
Inflation data is mostly good for defensive sectors, too
Jay looked at using inflation data to determine potentially favorable (and unfavorable) sectors.
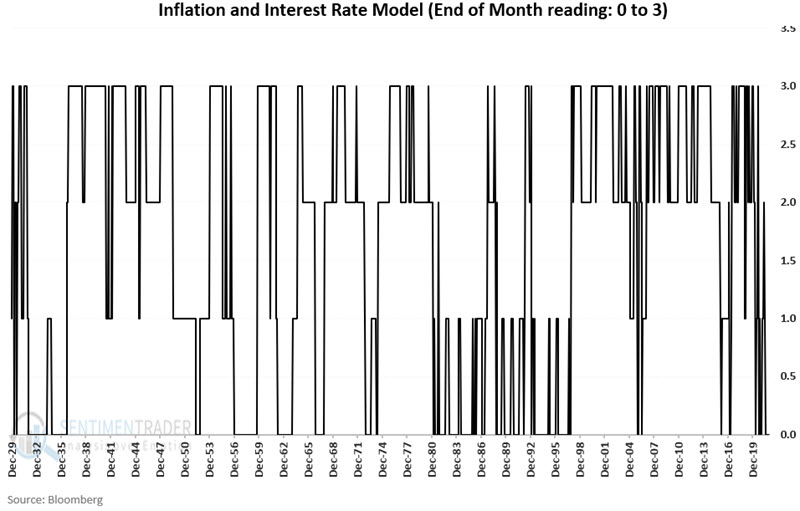
His Combined Model is calculated at the end of each month by looking at the CPI and 10-year Treasury yield relative to their long-term trends. The model will read:
- +3 = If both inflation and interest rates are falling
- +2 = If inflation is falling and interest rates are rising
- +1 = If inflation is rising and interest rates are falling
- 0 = If both inflation and interest rates are rising
The chart below displays the month-end status of the Combined Model starting in 1930 through the end of 2021.
The table below displays the total return for each sector if held only during different Combined Model readings. In other words, the column titled "+3" shows the cumulative return for each sector ONLY during those months when the Combined Model ended the previous month with a reading of +3, and so on.
For each Combined Model reading level, the top-performing sector is highlighted in green. The second top-performer is highlighted in blue.
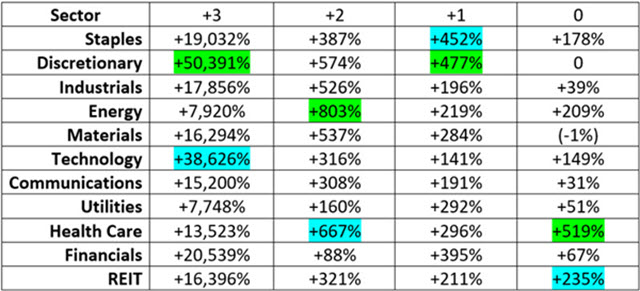
The Combined Model has been at "0" since 9/30/2021 as both inflation and interest rates are deemed to be rising. This regime has benefited some of the most defensive sectors the most.
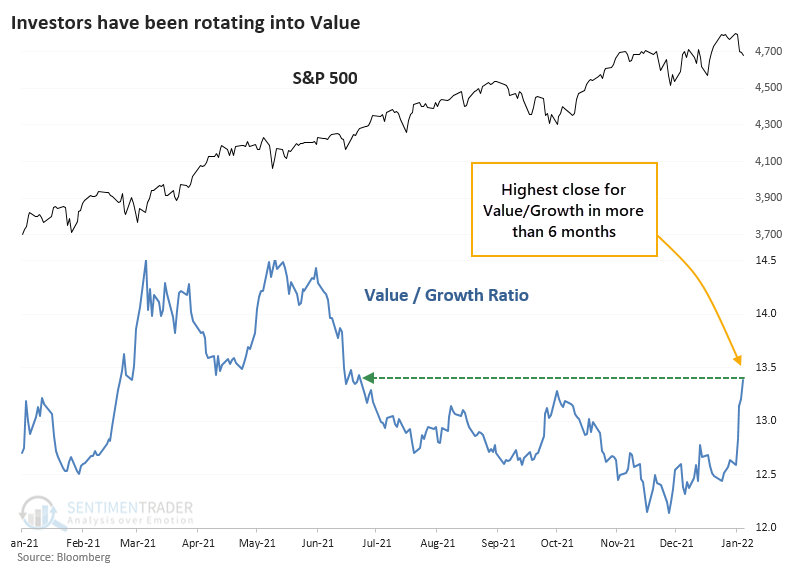
Value has been surging relative to Growth
One of the most vicious reversals of the new year has been the rotation out of Growth and into Value. After plunging to nearly a 20-year low late last year, the ratio between Value and Growth factors has soared. On Monday, it reached a 6-month high, surpassing its peak from October.
This is yet the latest temptation for Value investors. Previous rallies were nothing but siren songs, but hope springs eternal. At some point, valuations have to matter. Right?
There may be a silver lining here for those who insist on actual profit-earning businesses that aren't absurdly speculative. After the Value/Growth ratio cycled from a 1-year low to a 6-month high within 3 months, Value continued to outperform in the months ahead. Value investors tend to have time frames that extend for years, not months, but the edge isn't significant after the first few months.
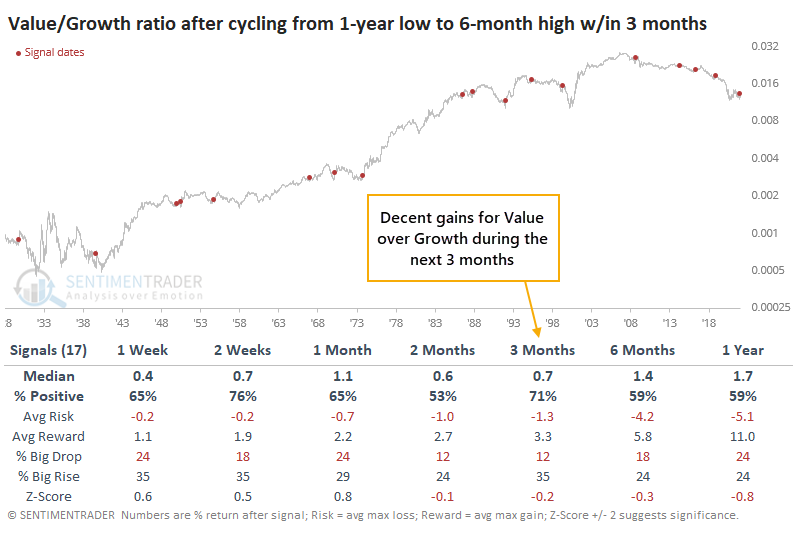
For the broader market, it was a mixed blessing. One might reasonably assume that a sudden shift toward Value would be a dire warning for the S&P 500, but that wasn't really the case. Over the next 2 months, it showed below-average returns, and up to 3 months later, the risk/reward was about even. But only 4 of the 17 signals preceded double-digit declines in the months ahead.
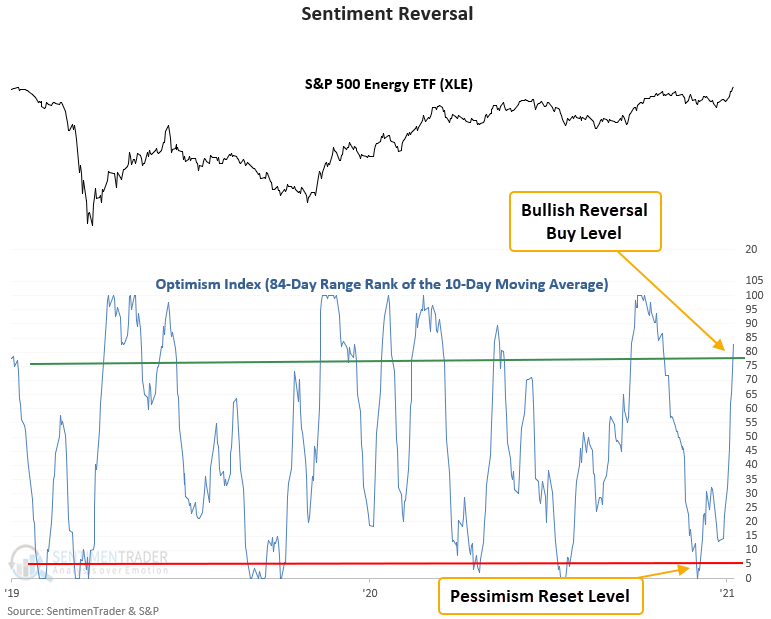
Energy's resurgence has improved sentiment greatly
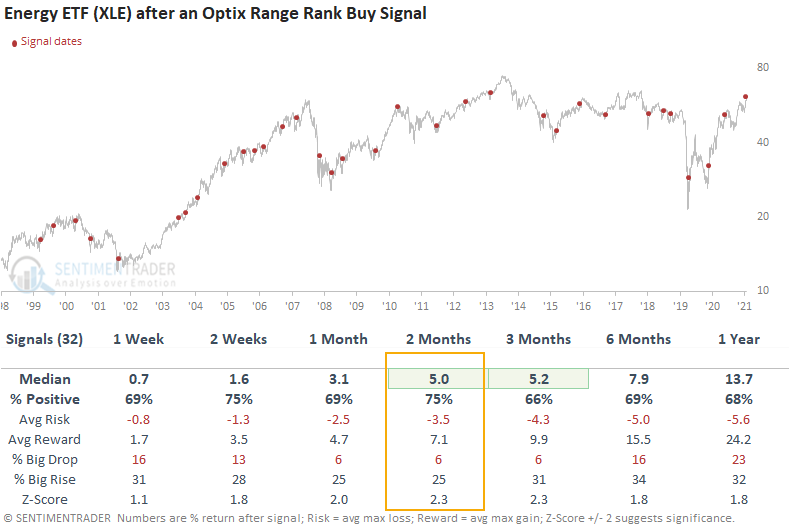
Dean showed that a trading model that uses the Optix Index to identify when sentiment reverses from a period of pessimism issued a buy signal for the energy sector on 1/7/22.
The model applies an 84-day range rank to the 10-day moving average of the Optimism Index for the XLE ETF. A new buy signal occurs when the range rank crosses back above the 78th percentile. At the same time, market momentum must be positive.
This signal has triggered 32 other times over the past 22 years. After the others, energy sector future returns, win rates, and risk/reward profiles were solid across all time frames, especially the 2-month window. The trading model performed well during the most recent energy bear market period between 2014-2020, with positive returns at some point up to 2 months later in 6 out of 7 instances.
Another positive sign for Energy - a good start to the year
A well-known seasonal pattern, originated by Stock Trader's Almanac, suggests that how investors behave in the first 5 days of a new year sets the tone for the rest of the year.
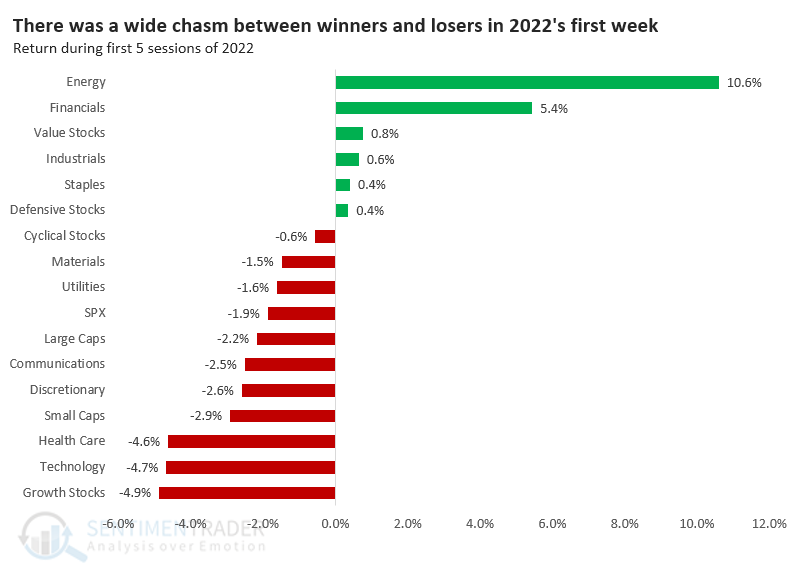
Instead of rehashing the familiar, let's look at sectors and factors and see if there is any reason to be especially bullish or bearish on their prospects for the rest of this month and this year, depending on how they were treated during that first week. Based on that theory, things are looking good for Energy, Financial, and Value stocks. High-beta investors might have a reason to worry.
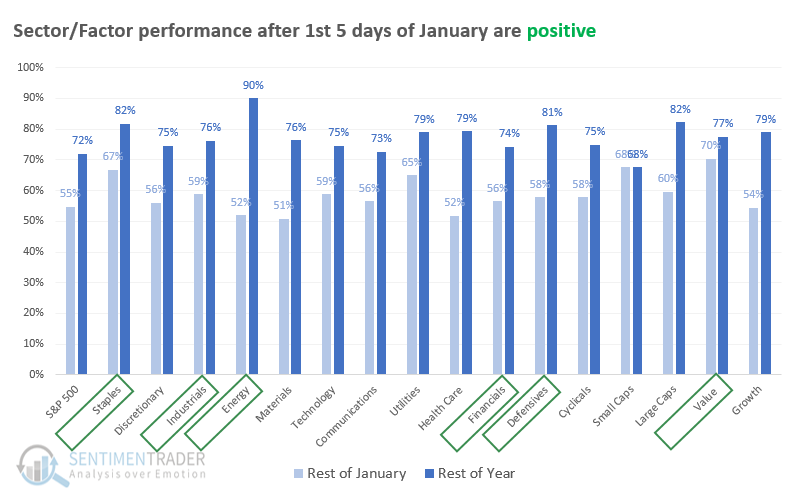
The results were good when we looked at how first-week winners performed for the rest of the month and the rest of the year. The chart below shows how often each sector and factor showed a positive return through January and year-end (not including the first 5 days of the year).
Taking first place was Energy, which added to its gains during the rest of the month only 52% of the time, but during the other approximately 247 other days in the year, it rose a whopping 90% of the time. The boxes highlight the relevant sectors/factors for the first 5 days.
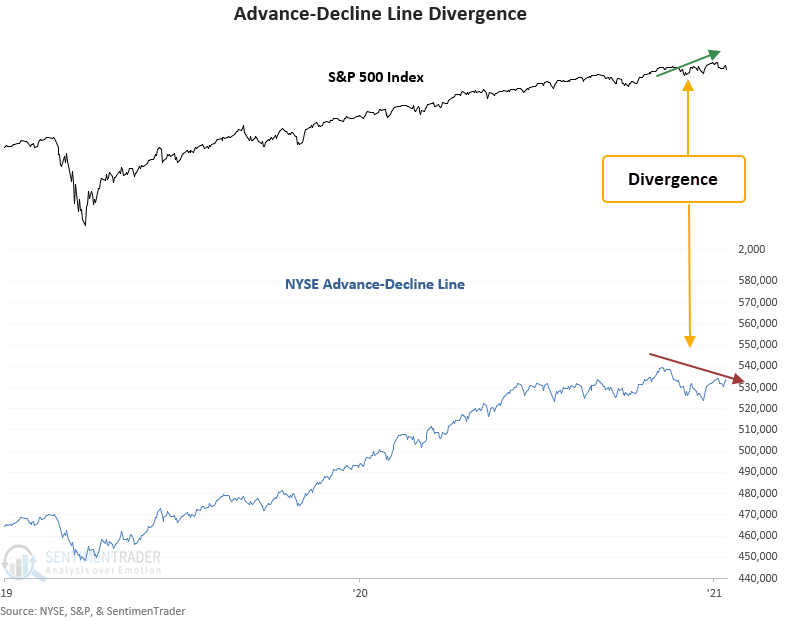
Some broad-market divergences are starting to pop up
A new signal from a voting member in Dean's TCTM Risk Warning Model registered an alert on Thursday. The component is called the Advance-Decline Line Divergence Model.
The model identifies the following:
- The 1-year range rank for the NYSE advance-decline line is below 89.75%
- The S&P 500 records a new 2-year high
- The advance-decline line has not registered a new high in 30 days or longer.
Once those conditions are confirmed, an alert is triggered when the S&P 500 closes at a 3-week low.
When the advance-decline line indicator registers a series of lower lows, and an index records a new high, something is amiss with market participation. The shot across the bow is a warning that we should be alert to rising risks. As always, it's essential to use a weight-of-the-evidence approach and not rely upon any single indicator.
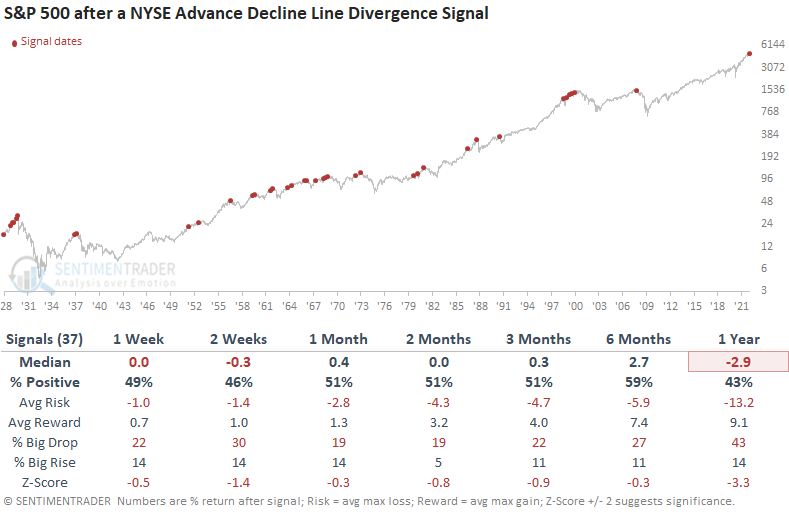
This signal triggered 37 other times over the past 94 years. After the others, S&P 500 future returns and win rates were slightly weak to flat on a short and medium-term time frame. The 1-year results, while negative, are influenced by whether a signal occurred around a bear market peak. Historically, the AD line can be early. For instance, four alerts occurred between January 1999 and January 2000, which led to consolidations and corrections, but not the ultimate peak.
There is also an ongoing divergence in the High-Yield Bond Cumulative Advance/Decline Line for the first time in 3 years.
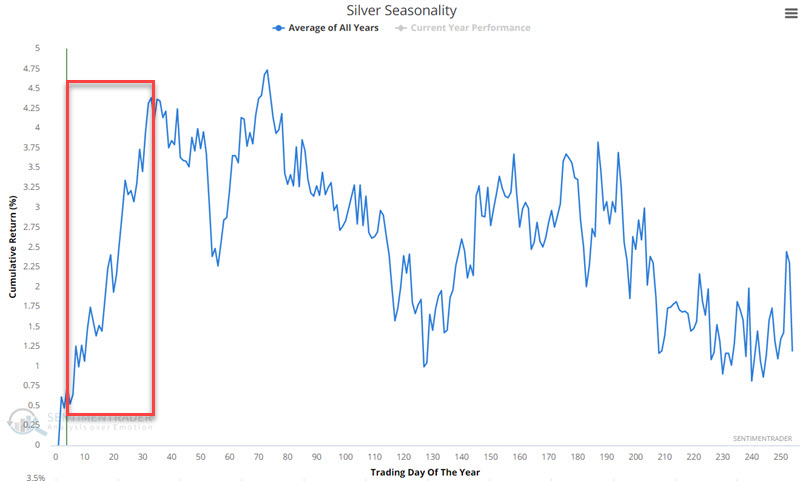
Silver's seasonality and a way to trade it
Jay noted that silver is presently within a seasonally favorable period. Specifically, this favorable period lasts through roughly February 18th.
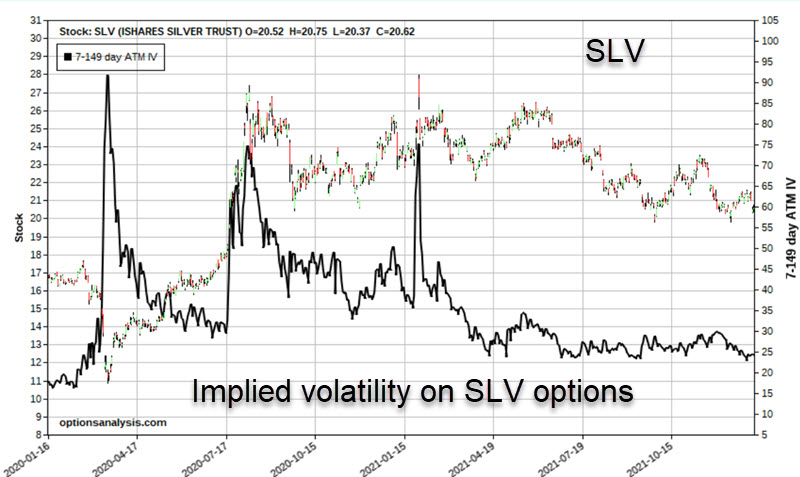
The chart below shows that the implied volatility (IV) for options on SLV is presently towards the low end of the historical range. In layman's terms, this means that the amount of time premium built into SLV options is relatively low, i.e., SLV options are "cheap" (remember, the higher the IV, the more time premium built into the options, and the lower the IV, the less time premium built into the options).
Consider a trader with a $25,000 account. The most straightforward bullish approach would be to buy 100 shares of SLV for $21.51. The trader could place a stop-loss order below recent support - at, let's say, $19.40 a share. This trade would involve a commitment of $2,151 and an anticipated risk of -$211 (assuming SLV does not gap below the stop-loss price). For each point SLV shares rise or fall, this position will gain or lose $100.
Now let's consider an alternative using options on SLV. The trade we will examine involves a bullish call calendar spread strategy. Let's say our trader recognizes this trade to be highly speculative and decides to commit no more than 1% of their capital - or $250 (a trader wishing to be more aggressive can buy a larger lot-size). Our example trade involves:
- Buying 13 SLV Mar18 2018 23 calls @ $0.32
- Selling 13 SLV Feb18 2018 23 calls @ $0.13
This trade is presented not as a recommendation but as an example of one way to play the long side of silver without taking on a significant dollar risk. The particulars for this position and the risk curves appear in the charts below.
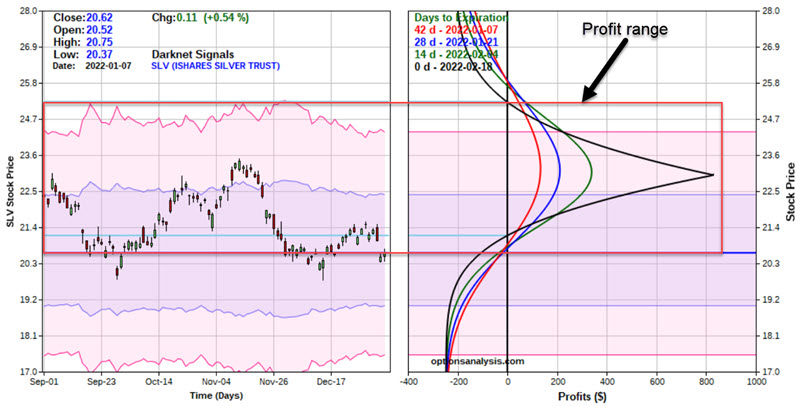
Key things to note:
- The total commitment - and maximum risk - for this trade is $247
- This position presently has a "Delta" of roughly 99 - this value can change, but for now, it means the position is roughly equivalent to buying 99 shares of SLV at a fraction of the cost
- This trade has a "profit range." Barring changes in implied volatility, this trade should show a profit as of February options expiration on February 18th if SLV is trading between $21.15 and $25.23. Outside of that range, this trade will show a loss
- This position has a "Vega" of $17.21. This means that if implied volatility rises by one whole percentage point, this position should gain $17.21 in value and vice versa. The trader hopes for a higher IV before Feb. expiration to inflate the value of this position
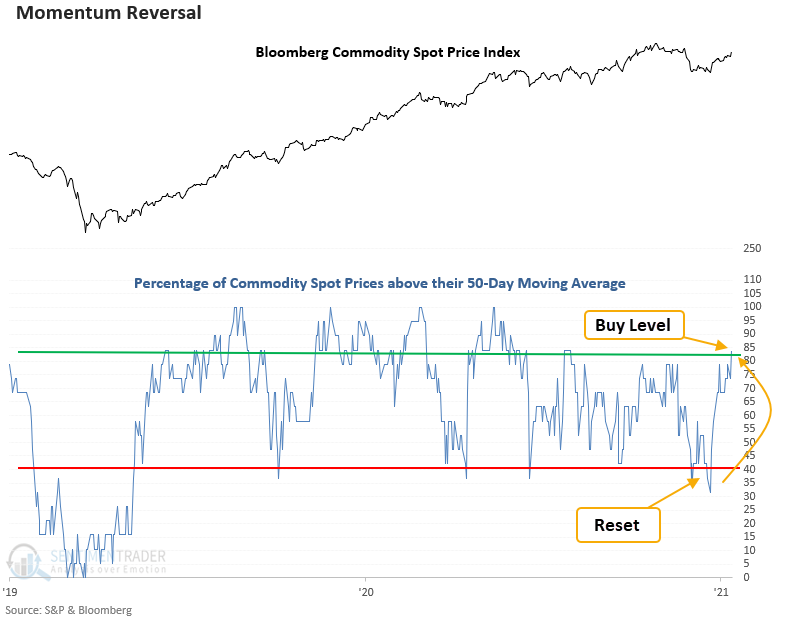
More commodities are moving above their 50-day averages
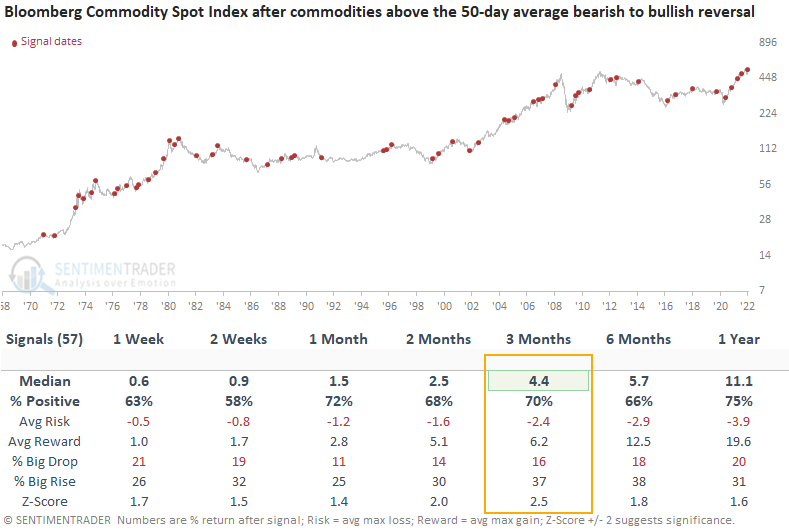
Dean assessed the outlook for the Bloomberg commodity spot price index when a basket of spot commodities trading above their respective 50-day average reverses from less than 40% to greater than 83% within 30 days.
This signal has triggered 57 other times over the past 51 years. After the others, commodity future returns, win rates, and z-scores look solid across all time frames, especially the 3-month window. Recent consistency looks excellent in the 2 and 3-month time frames, with 16 out of 17 and 15 out of 17 winners, respectively.
The declining dollar helps
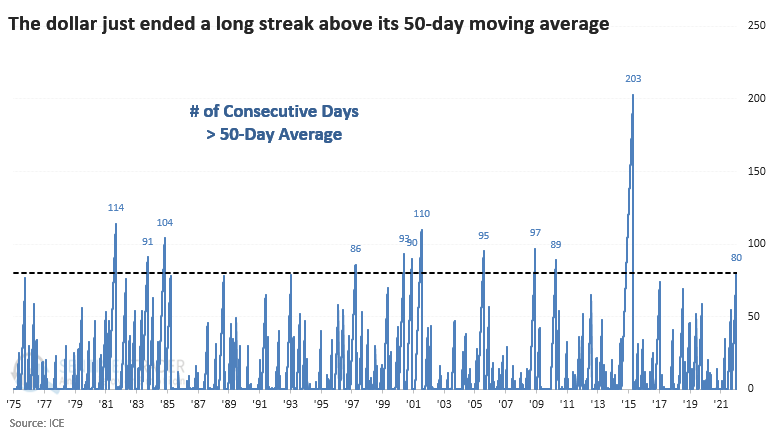
The U.S. dollar has been on investors' radars for months as it climbed to its highest level in more than a year. In recent weeks, the uptrend stagnated. The buck crossed below its 50-day average on Friday, followed by a lower low on Tuesday, potentially confirming the move lower.
The dollar had gone 80 sessions above its 50-day average. The drop on Friday ended one of its longest-ever streaks above its medium-term moving average.
When the dollar fell below its 50-day average for the first time in months and had set a 52-week high at some point in the prior 2 months, it has usually kept falling. Its shorter-term returns were fragile, with only 19% of the signals preceding a bounce over the next 1-2 weeks.
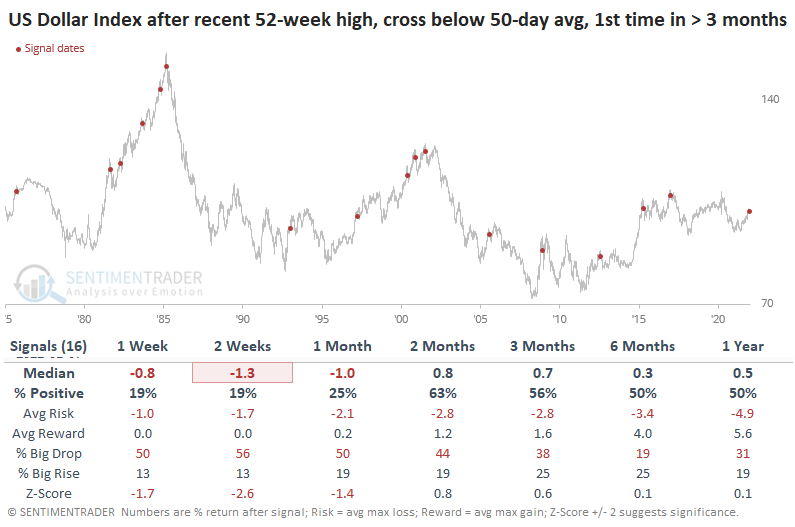
We might expect a falling dollar to be a net positive among other markets. Gold did tend to see a quick bounce, but it showed weak returns after that. So did crude oil and commodities in general. Treasury notes tended to rise (in price, meaning a lower yield), but it wasn't a decisive edge.
Other reasons to be cautious on the dollar include the fact that the 50-day average of the Optimism Index for the dollar just crossed above 65%. While currencies tend to trend, rendering sentiment extremes less consistent as contrary indicators, the Backtest Engine shows the dollar struggled with high optimism.
About the Weekly Wrap...
The goal of the Weekly Wrap is to summarize our recent research. Some of it includes premium content (underlined links), but we're highlighting the key focus of the research for all. Sometimes there is a lot to digest, with this summary meant to highlight the highest conviction ideas we discussed. Tags will show any symbols and time frames related to the research.